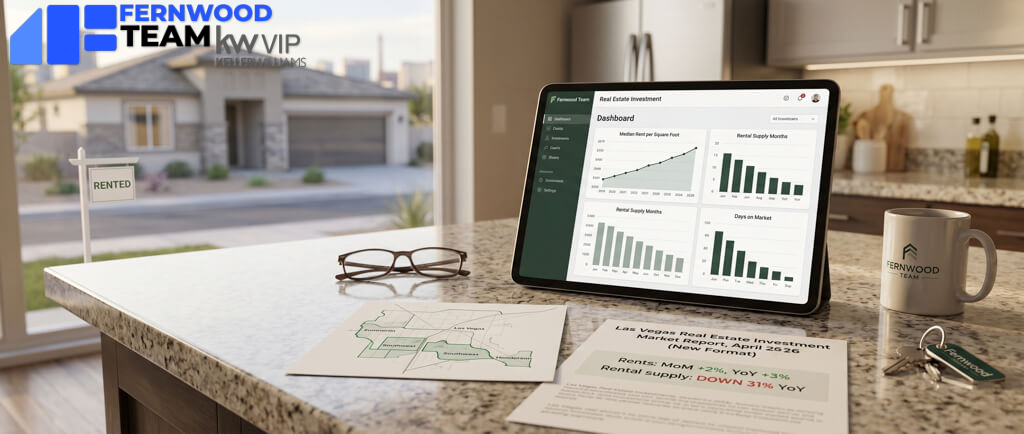
Starting this month, we will refocus our monthly market report. Instead of centering it around an article, it will focus solely on the market trends data for our target property segment. The weekly newsletters will continue to include a real estate investment-focused article.
This report tracks the Las Vegas market for the type of rental properties we typically help clients buy. It does not try to summarize the entire housing market. It focuses on the segment that matters most to long-term investors, properties that appeal to stable tenants, produce reliable rental income, and have historically delivered better long-term results.
Key Takeaways
-
Rents: Continued to increase MoM since January. MoM is up 2%. YoY is up 3%.
-
Leasing speed: Days to rent continued to decrease rapidly MoM since January.
-
Rental supply: Rental months of supply continued to drop rapidly MoM. YoY is down 31%!
-
Prices: Decreased slightly MoM (down 1%). YoY is down 2%.
-
Sales supply: Months of supply decreased significantly MoM. Now at the lowest level in the last 13 months.
-
Investor takeaway: Less homes for sale, rental market is heating up.
Market Scope and Methodology
This report reflects the Las Vegas market for the type of properties we typically recommend to clients, not all homes in the valley. The data applies only to properties that conform to our investment property profile and is based on data from the Greater Las Vegas Association of REALTORS (GLVAR) MLS.
Note: The data shown in this report:
- Type: Single-family
- Configuration: 3+ bedrooms, 2+ baths, 2+ car garages, 1,100 to 2,400 SF, one or two stories, lot size >3,000 SF.
- Rent range: $1,900/Mo to $2,400/Mo
- Price range: $320,000 to $475,000
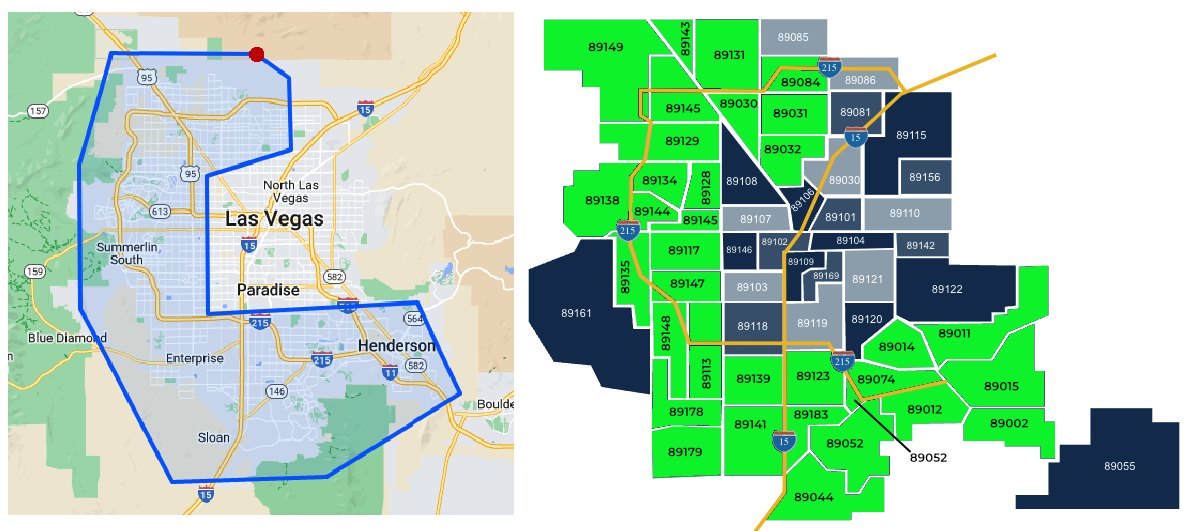
- Location: All zip codes marked in green below have one or more of our client’s investment properties.
Unless noted otherwise, the charts compare the most recent month against the prior 12 months. We track the section of the market that matters most to buy-and-hold investors; this is not a broad market summary that includes property types and price ranges our clients would never buy.
Rental Market
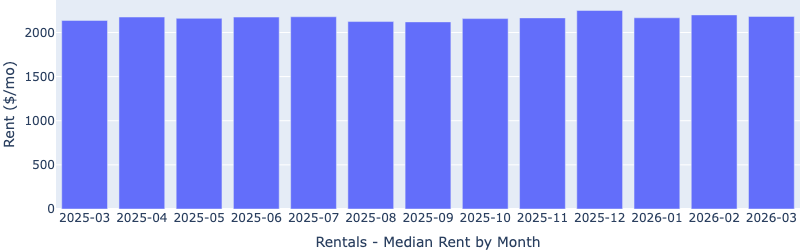
Median Rent by Month
This is a new chart that we started monitoring. It’s interesting to see that the median rent over the last 13 months has been very consistent, slightly above $2,000/Mo. This shows the segment’s stability. Keep in mind that this data includes homes of all sizes.
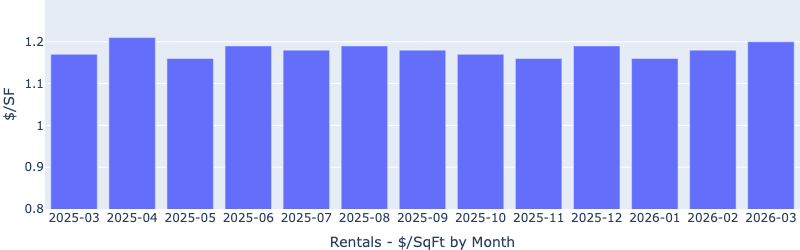
Rent $/SF by Month
This is the metric that we have been using to monitor the rent trend. Rent per square foot has been rising steadily since January, in line with the seasonal trend. This shows the rental market is heating up. YoY is up 3%.
The $/SF has stayed within a very tight band between $1.17 – $1.2 for the last 13 months, indicating a highly stable market for investors, with very little “downside” risk seen over the last (tumultuous)year.
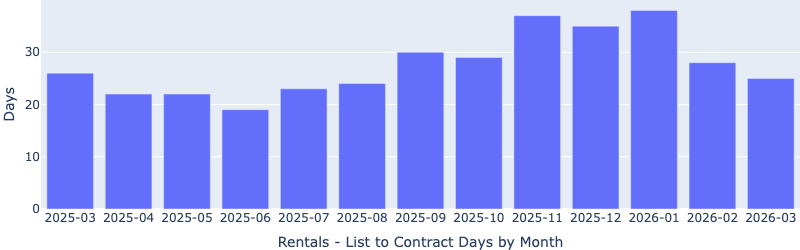
Time to Rent
Days to rent continued to decrease rapidly since January, now at a very healthy 25 days. This shows the rental demand is increasing.
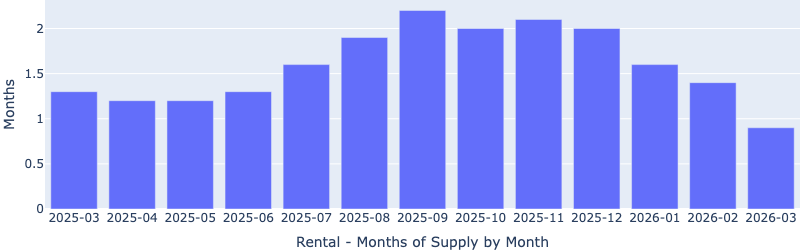
Rental Supply
Inventory has plummeted for three consecutive months, now at only 0.9 months (less than a 30-day supply), the lowest in the last 13 months, and 30% down YoY. This is a strong landlord’s market, and rents are likely to keep rising.
Sales Market
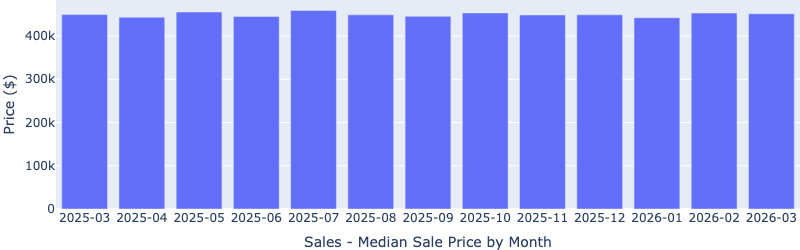
Median Sale Price
The median sale price has also remained in a tight band, between ~$450,000 to $460,000 over the last 13 months, despite external pressures from geopolitical and economic uncertainty.
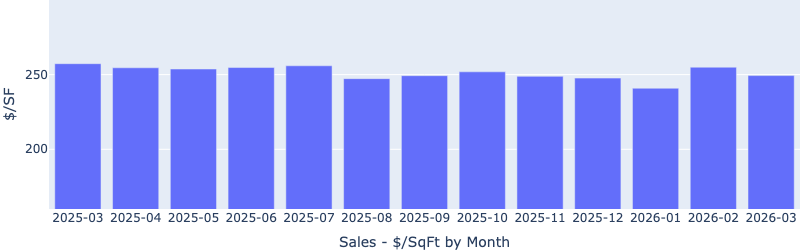
Price per Square Foot
Median price per square foot decreased slightly MoM, bucking the usual seasonal trend (it usually increases during the spring). This shows that more sellers are willing to accept lower (than their desired) prices in order to make a sale.
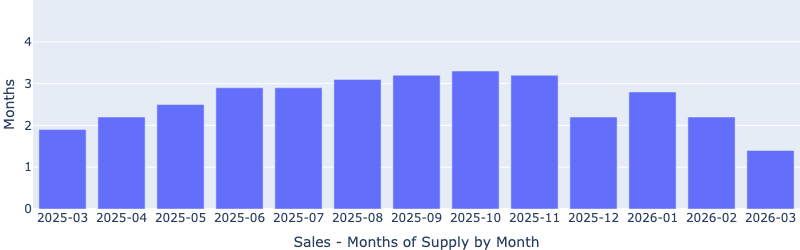
Months of Supply
Inventory is at a 13-month low, now at only 1.4 months. This likely resulted from a (fewer sellers) and a higher in March (more transactions likely due to more sellers accepting lower prices as mentioned above).
A balanced market is about 6 months of supply, where prices can be expected to remain stable. A 1.4 months of supply indicates a strong seller’s market, and puts upward pressure on the prices. It also signals strong buyer demand.
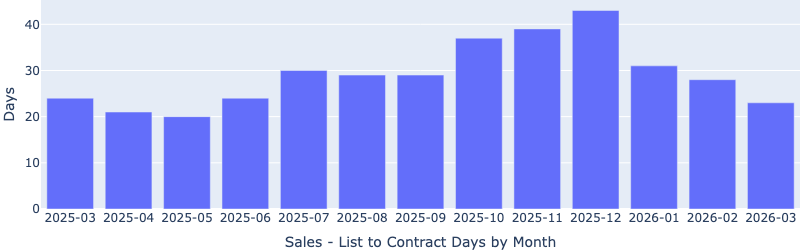
Days on Market
Days to sell continued to decrease rapidly MoM, now only at about 23 days. This indicates a high-demand environment where well-priced homes are selling within days. Notice here too, the apparent slower selling period in the winter months.
What This Means for Investors
For long-term investors, this is an attractive time to buy. We are seeing some excellent options even in the sub $400k price range, which has not been the case for a while. The higher mortgage rates since the Iran War began probably pushed some buyers to the sidelines, creating more opportunities for us to secure properties at lower prices amid less competition. In the meantime, the rental market is heating up, which means the newly acquired properties will likely rent faster and for more.
Related Resources
-
- Annual Investor Outlook: 2026 Investor Outlook
- Investor Guides: The Fernwood Investment Framework
- Example Candidate Properties
- Schedule a Conversation: Let’s Talk Strategy