13 Months Trailing Statistics

The statistics provided by the local press have many problems. Because we need accurate information, we compile statistics on the narrow segment of single-family properties we target.

Note: The data shown in this article only applies to properties that conform to our investment property profile and are based on data from the Greater Las Vegas Association of REALTORS (GLVAR) MLS.
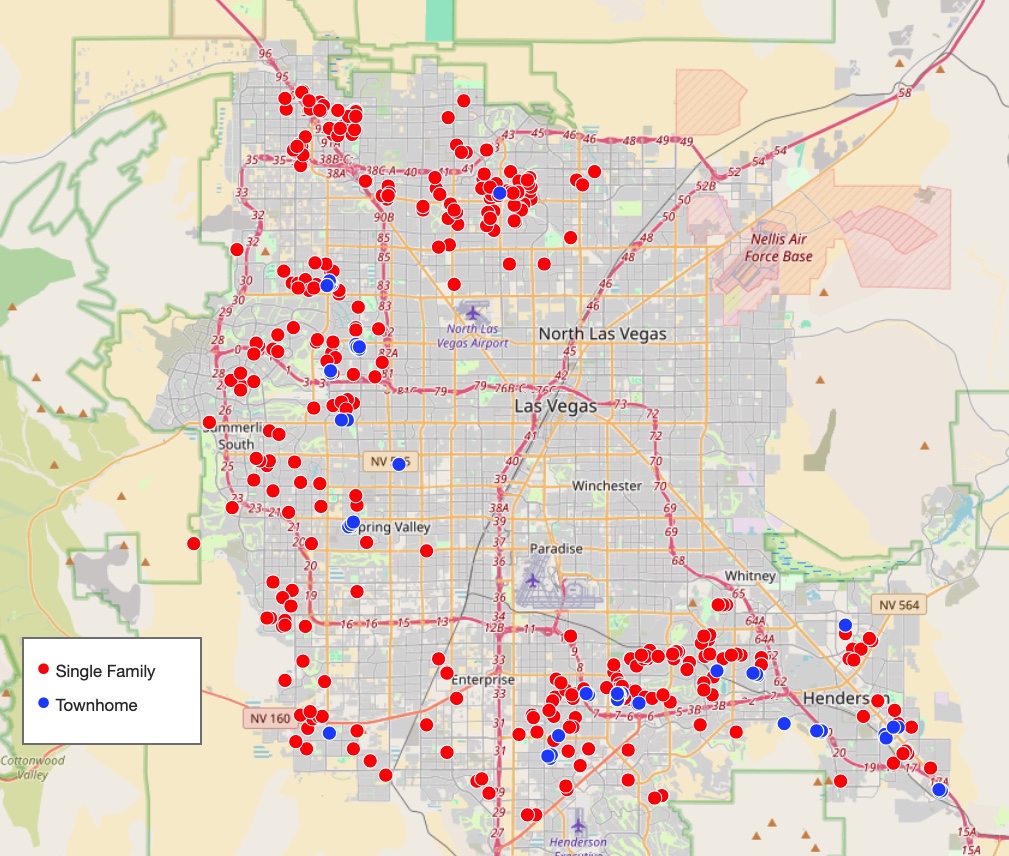
  • Type: Single-family
  • Configuration: 3+ bedrooms, 2+ baths, 2+ car garages, 1,100 to 2,400 SF, one or two stories, lot size 3,000 SF to 6,000 SF.
  • Rent range: $1,900/Mo to $2,300/Mo
  • Location: See the map below for the general areas.

Map of greater Las Vegas showing the general areas where Fernwood investment properties are located.

Rental Statistics

Rentals – Median $/SF by Month

Bar chart: Rentals median price per square foot by month, March 2025 to March 2026. Values remain stable between approximately $1.15 and $1.21/SF across all 13 months, with a peak in April 2025 and no significant trend up or down.

Rentals – List to Contract Days by Month

Bar chart: Rentals median days from list to contract by month, March 2025 to March 2026. Days range from about 20 in June 2025 to a peak of 37 in January 2026, with a clear seasonal rise through fall and winter before dropping back to 25 days in March 2026.

Rentals – Availability by Month

This chart shows the average daily number of properties that were for rent in a particular month.
Bar chart: Rentals average daily availability by month, March 2025 to March 2026. Inventory grows steadily from about 800 properties in spring 2025 to a peak of approximately 1,550 in December 2025 and January 2026, then drops sharply to about 975 by March 2026.

Rentals – Closings by Month

Bar chart: Rental closings by month, March 2025 to March 2026. Closings hold steady between roughly 590 and 670 from March through September 2025, then increase steadily, reaching a 13-month high of approximately 1,075 in March 2026.

Rentals – Months of Supply

Bar chart: Rental months of supply by month, March 2025 to March 2026. Supply rises from about 1.3 months in spring 2025 to a peak of roughly 2.2 months in September through November 2025, then falls sharply to about 0.9 months by March 2026, indicating tightening rental inventory.

Sales Statistics

Sales – Median $/SF by Month

Bar chart: Sales median price per square foot by month, March 2025 to March 2026. Values remain stable between approximately $243 and $260/SF across all 13 months, with a slight dip in July 2025 and January 2026, showing broadly flat sale prices.

Sales – List to Contract Days by Month

Bar chart: Sales median days from list to contract by month, March 2025 to March 2026. Days trend upward from about 20 to 24 days in spring 2025 to a peak of approximately 44 days in December 2025, then decline back to about 23 days by March 2026, reflecting seasonal buyer activity.

Sales – Availability by Month

This chart shows the average daily number of properties that were for sale in a particular month.
Bar chart: Sales average daily availability by month, March 2025 to March 2026. Inventory grows from about 1,175 homes in March 2025 to a peak of roughly 1,800 in September and October 2025, then declines steadily to about 1,100 by March 2026.

Sales – Closings by Month

Bar chart: Sales closings by month, March 2025 to March 2026. Monthly closings hold between approximately 540 and 640 from March through November 2025, dip to about 500 in January 2026, then spike to roughly 800 in March 2026, the highest point in the 13-month period.

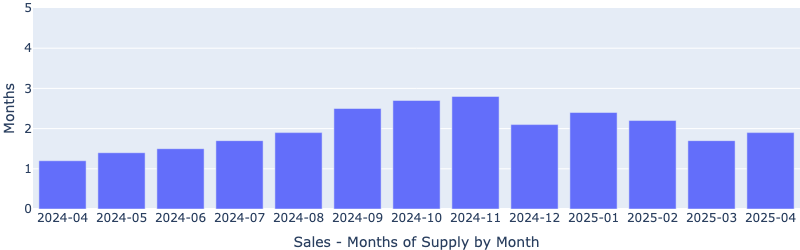
Sales – Months of Supply

Bar chart: Sales months of supply by month, March 2025 to March 2026. Supply rises from about 2.0 months in March 2025 to a peak of approximately 3.4 months in September through November 2025, then falls to about 1.4 months by March 2026, signaling tightening sales inventory.

© 2005 to 2026 Cleo Li and Eric Fernwood, all rights reserved.