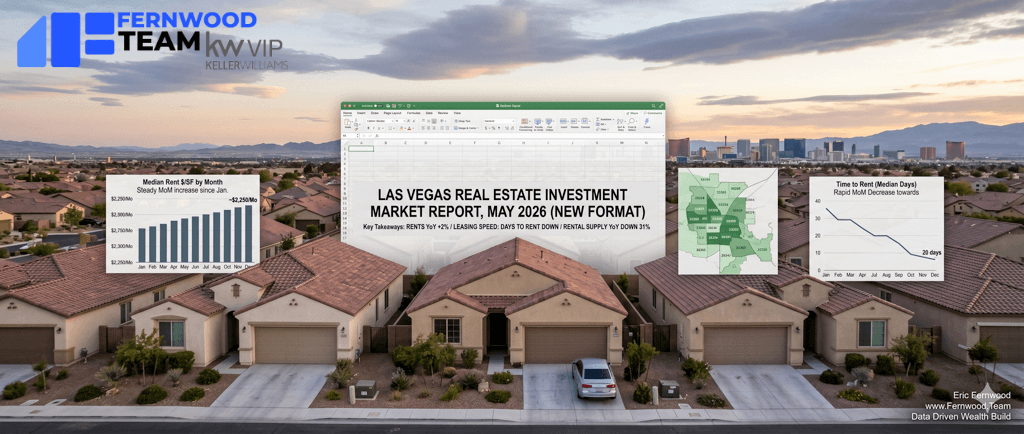
This report tracks the Las Vegas market for the type of rental properties we help clients buy. It is not a summary of the entire housing market.
Key Takeaways
- Rents: Continued to increase MoM since January. MoM is up 2%. YoY is up 2%.
- Leasing speed: Days to rent continued to decrease rapidly MoM since January.
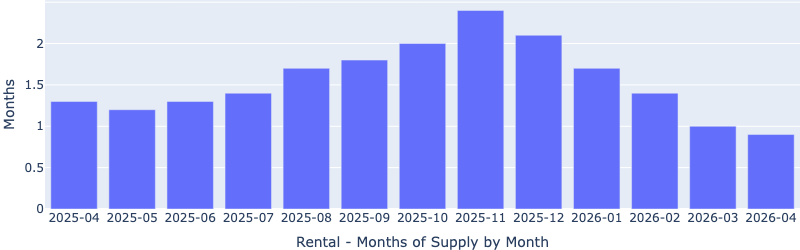
- Rental supply: Rental months of supply continued to decrease MoM. YoY is down 31%!
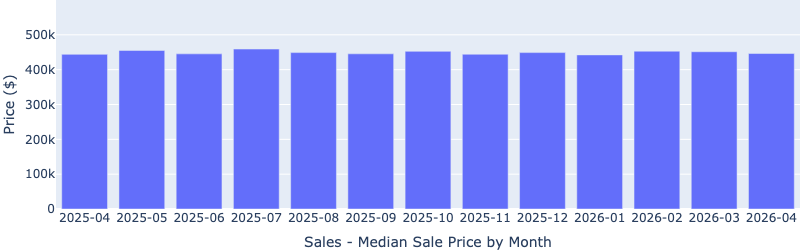
- Prices: Unchanged MoM. YoY is down 2%.
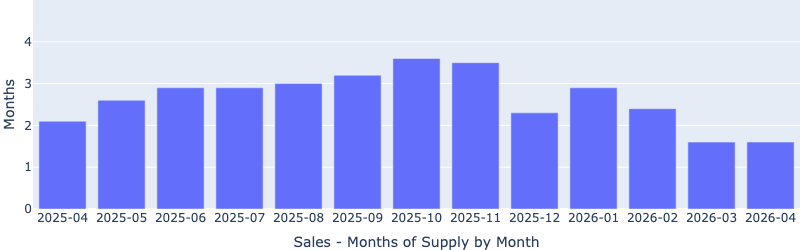
- Sales supply: Months of supply unchanged MoM, still at the lowest level in the last 13 months.
- Investor takeaway: A lukewarm spring sales season, while the rental market continues to heat up.
Market Scope and Methodology
This report reflects the Las Vegas market for the type of properties we typically recommend to clients, not all homes in the valley. The data applies only to properties that conform to our investment property profile and is based on data from the Greater Las Vegas Association of REALTORS (GLVAR) MLS.
Note: The property data in this report only includes the following:
- Type: Single-family
- Configuration: 3+ bedrooms, 2+ baths, 2+ car garages, 1,100 to 2,400 SF, one or two stories, lot size >3,000 SF.
- Rent range: $1,900/Mo to $2,400/Mo
- Price range: $320,000 to $475,000
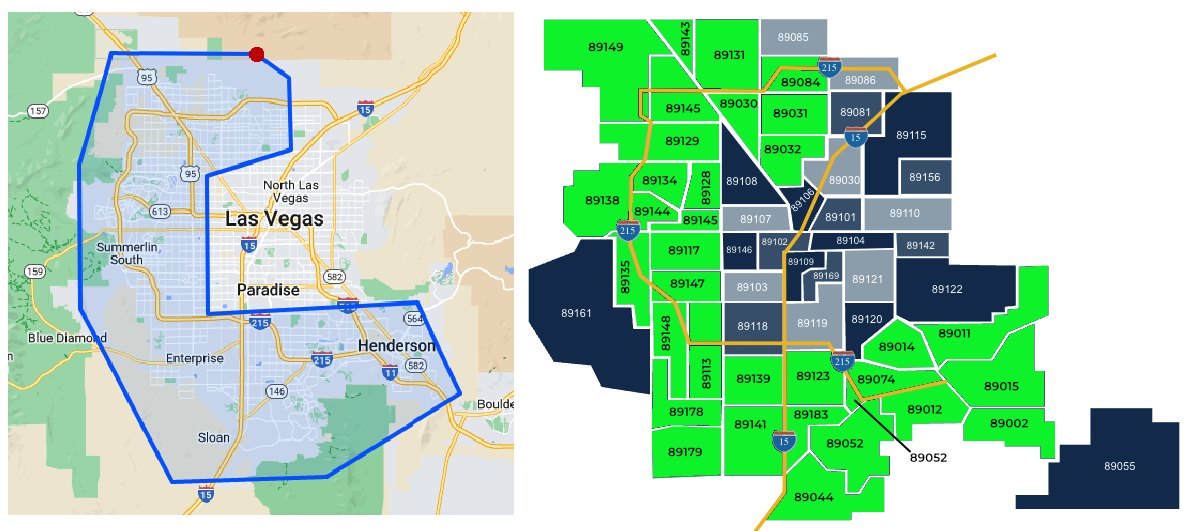
- Location: All zip codes marked in green below that have one or more of our clients’ investment properties.
Unless noted otherwise, the charts compare the most recent month against the prior 12 months.
Rental Market
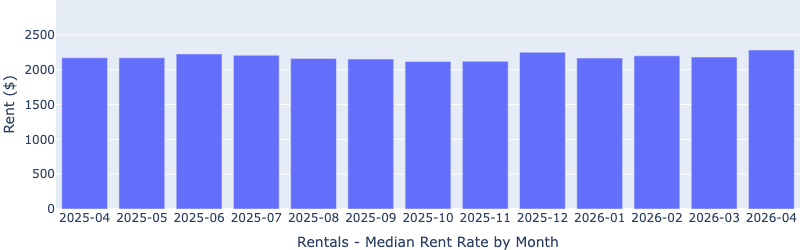
Median Rent by Month
This is a new chart that we started monitoring. Note that it is at the highest level in the last 13 months, up about 5% YoY. Keep in mind that this data includes homes of all sizes.
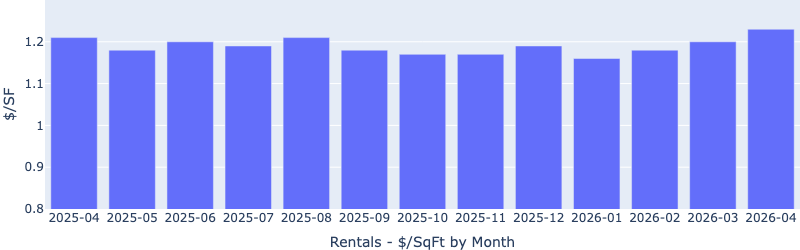
Rent $/SF by Month
Rent per square foot has been rising steadily since January, in line with the seasonal trend. This shows the rental market is continuing to heat up as we progress into the peak spring/summer season. YoY is up 2%.
It’s also worth noting that the $/SF has reached its highest in the last 13 months, despite the uncertainty that may have arisen from geopolitical headlines. We will see if this is a blip or a resume of the growth trend.
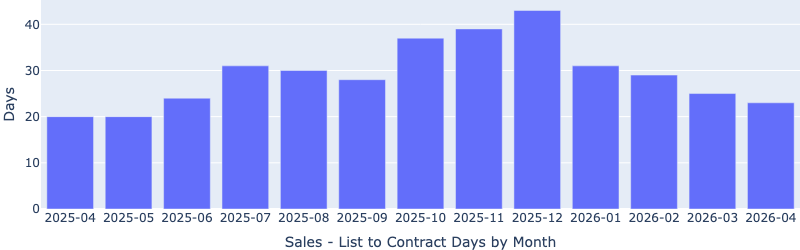
Time to Rent
Median days to rent continued to decrease rapidly since January, now at just above 20 days (it was 25 days in March). This shows the rental demand continues to increase.

Rental Supply
Inventory had another slight decrease since March, after plummeting for four consecutive months prior, now at only 0.9 months (less than a 30-day supply), the lowest in the last 13 months, and down 30% YoY! This indicates a strong landlord’s market, and rents are likely to keep rising.
Sales Market
Median Sale Price
The median sale price decreased marginally MoM and is virtually unchanged YoY, indicating a stable sales market despite external pressures from geopolitical and economic uncertainty.
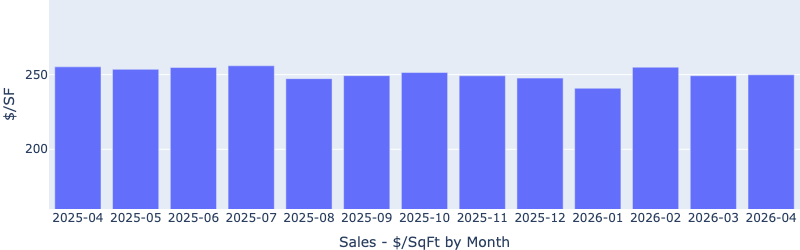
Price per Square Foot
Median price per square foot remained flat MoM, bucking the usual seasonal trend (it usually increases during the spring). This may indicate the price level the sellers will have to accept to make a sale at the current elevated interest rate.
Months of Supply
Inventory remains unchanged MoM, still at a 13-month low, now at only 1.5 months. Note that this is down 25% YoY. MoM (fewer sellers), and the in April also decreased slightly, again pointing to a “stalemate” in the market with lower transaction volume.
However, a balanced market is about 6 months of supply, where prices can be expected to remain stable. A 1.5 months of supply is firmly in the strong seller’s market, and puts upward pressure on the prices. It also signals strong buyer demand.
Days on Market
Days to sell continued to decrease MoM, now only at about 22 days. This indicates a high-demand environment where well-priced homes are selling within days.
What This Means for Investors
Taken together, this month’s data suggests that the sales market is a lackluster rather than a typical active, hot spring/summer season. This is likely still due to the higher interest rate, which is pushing many buyers to the sidelines. The rental market, however, continues to heat up, as evidenced by rising rents and shorter time-to-rent. While the sale price per square foot was flat MoM, the time to sell continued to decrease. This indicates persistent buyer demand, especially for well-priced homes. This means the home values will hold.
For long-term investors, we still believe this is an attractive time to buy. We continue to see some excellent options, even in the sub-$400k price range, popping up occasionally, though the best ones sell within a day or two. Investors would face less competition and more opportunities to secure properties at lower prices. In the meantime, the rental market is heating up, which means the newly acquired properties will likely rent faster and for more.
Related Resources
- Annual Investor Outlook:
- Investor Guides:
- Schedule a Conversation: