
- Your Rental Income Isn’t the Goal. Your Purchasing Power Is.
- Potential Investment Properties
- Market Trends
- About the FERNWOOD Team
Your Rental Income Isn’t the Goal. Your Purchasing Power Is.
Most investors focus on cash flow.
That’s not the real goal.
The real goal is sustained purchasing power over your lifetime.
Sustained purchasing power requires a rental income that increases faster than inflation, or you will be forced back to work to make up for the declining purchasing power.
The Problem
Suppose you need $250 per week for groceries today. If inflation averages 4% per year, in 15 years you will need:
-
$250 × (1 + 4%)^15 ≈ $450
$450 is not an upgrade. It is what you need to buy the same set of groceries as $250 will buy today. If you do not have the needed $450, you will be forced back to work to make up for lost purchasing power. According to research by Life, 64% of Americans “worry more about running out of money than death.”
What Actually Matters
To maintain your purchasing power throughout your retirement, you need rental income that meets two requirements.
-
Rent must increase faster than inflation
-
The rental income must be reliable, meaning tenants stay and pay reliably throughout market cycles
If either fails, your income becomes unstable or loses purchasing power—at a time when returning to work is least feasible.
How Has Las Vegas Measured Up?
So, how have properties that match our property profile performed against inflation?
We analyzed our target property segment from 2015 through 2025.
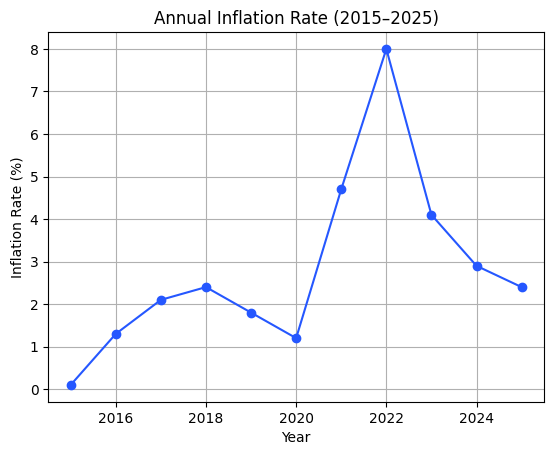
- Inflation averaged about 2.8% per year
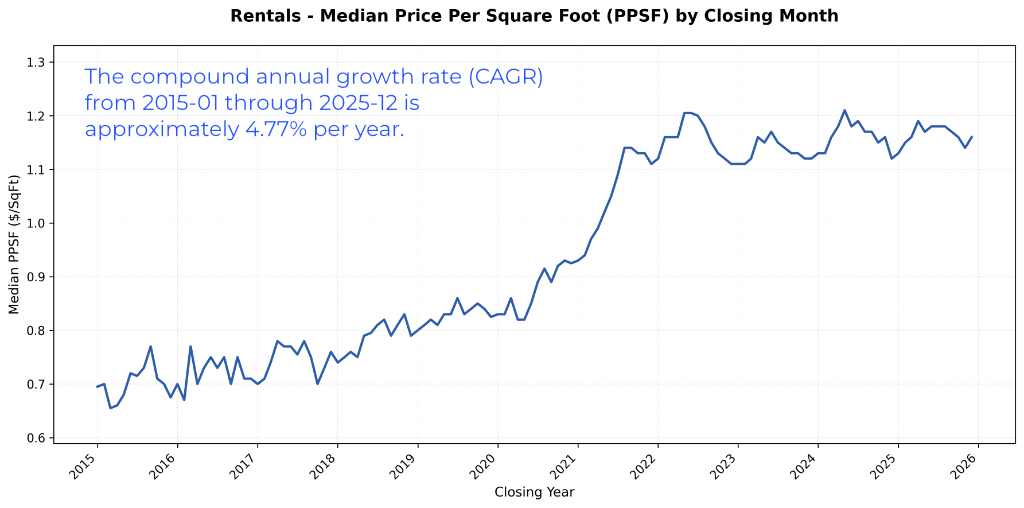
- Rent growth averaged about 4.77% per year
That difference matters.
It means rent growth did not just keep up with inflation.
They exceeded it.
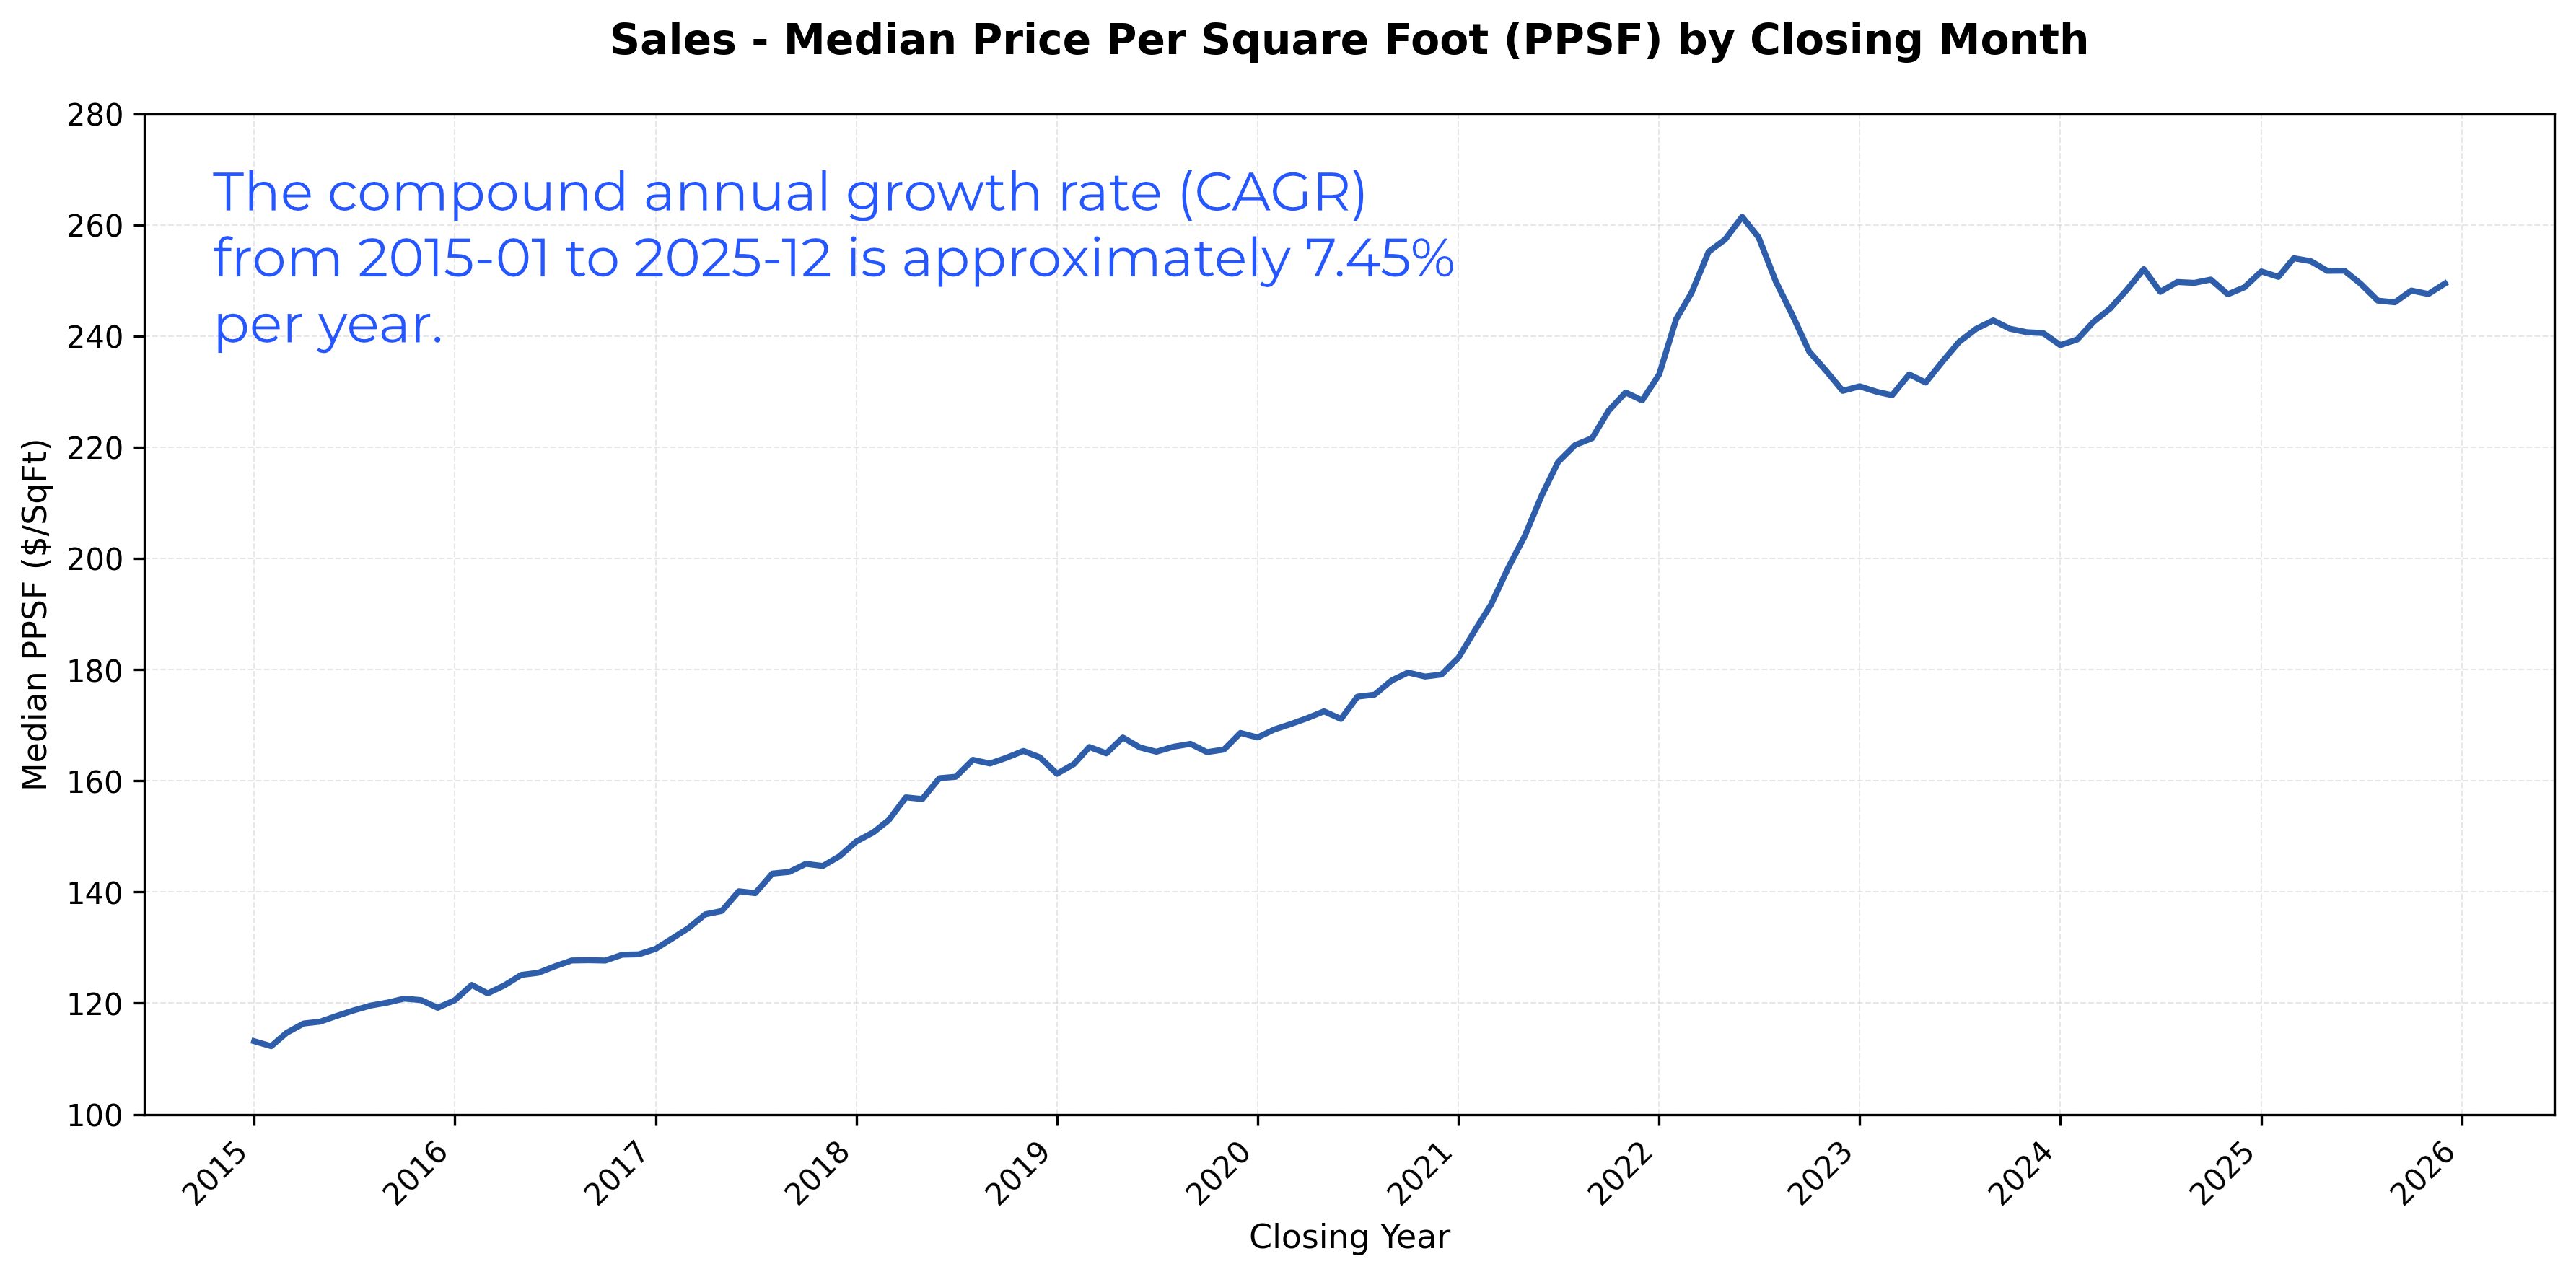
Below are the charts showing inflation, rent growth, and the cumulative comparison.
[]
[Source: ]
[Source: ]
The chart below compares cumulative rent growth and inflation over the same period.
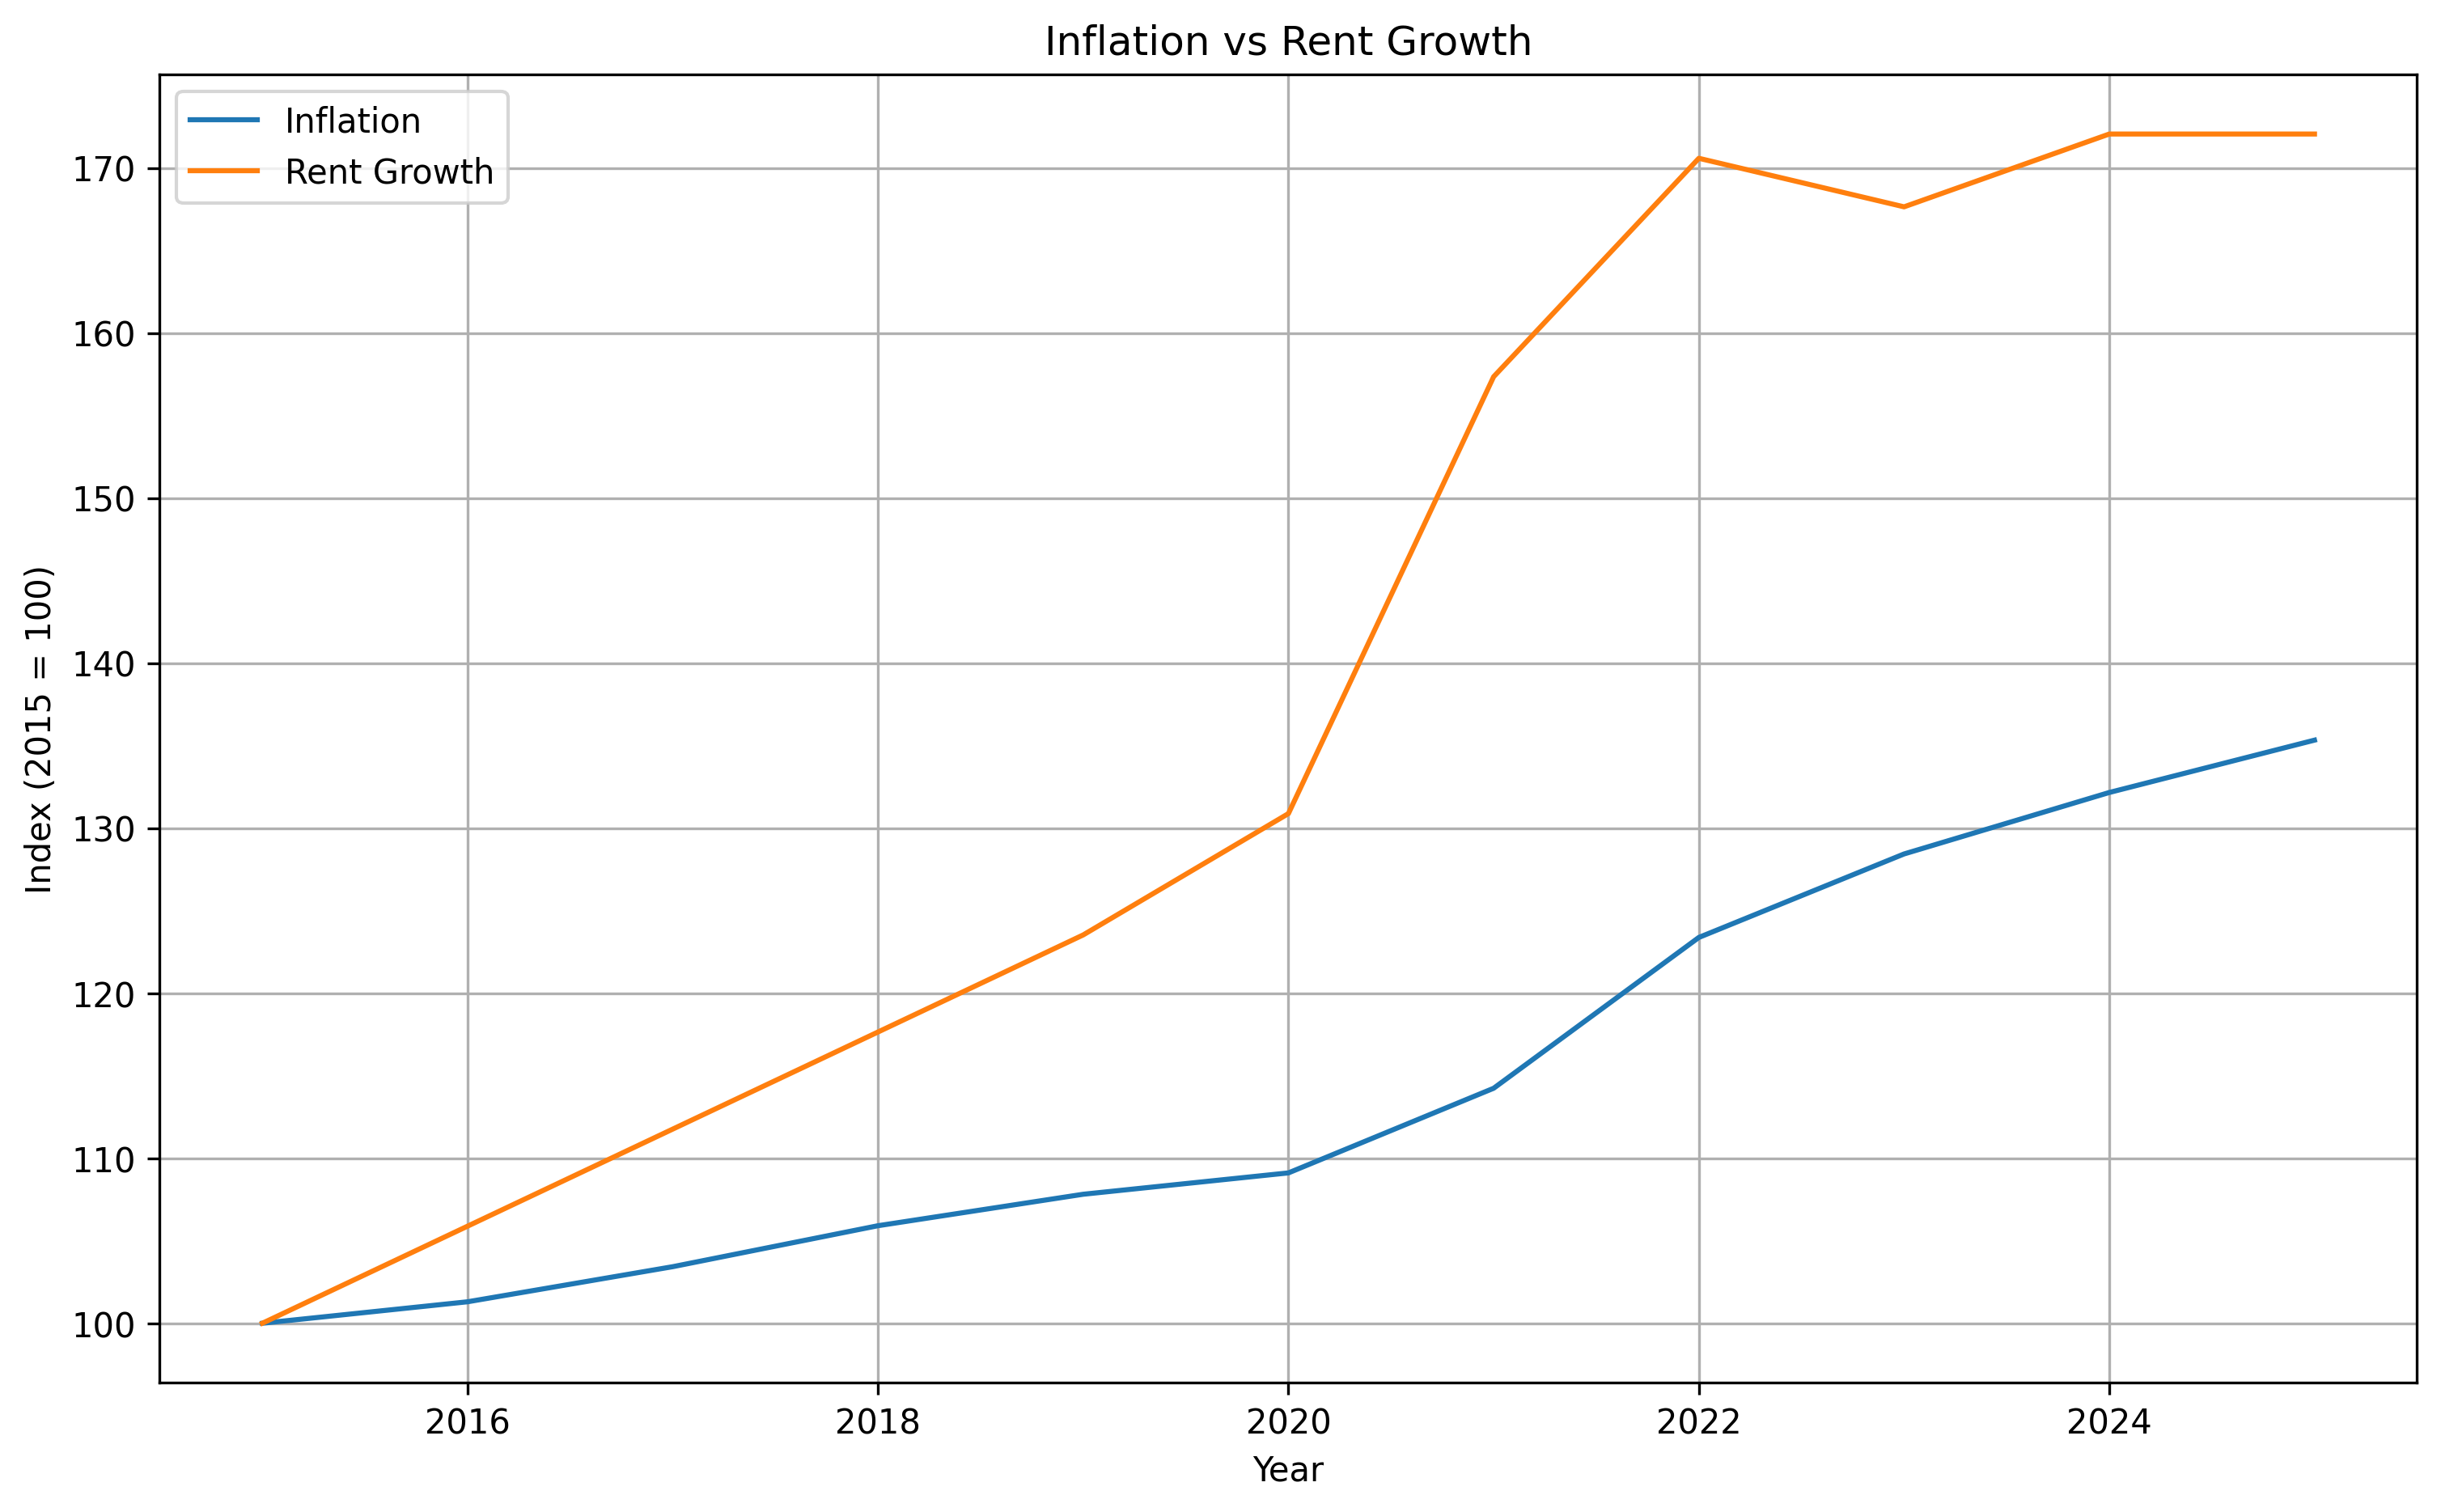
Even with the inflation spike after 2020, cumulative rent growth remained ahead of cumulative inflation.
What This Means Over Time
The difference between rent growth and inflation in this period is about 1.97% per year.
That may look small. Over time, it is not.
If you start with $2,000 per month in rental income, at a net (inflation-adjusted) growth rate of 1.97%/Yr:
- After 10 years: ≈ $2,418/Mo ($2,000 x (1 +4.77%)^10/(1+2.8%)^10)
- After 20 years: ≈ $2,924/Mo
- After 30 years: ≈ $3,535/Mo
- After 40 years: ≈ $4,273/Mo
Because rents for our target property segment rose faster than inflation, the purchasing power increased. Consequently, your standard of living increased.
The Takeaway
Real estate works when it increases your purchasing power. That requires two things:
- Investing in a city where rents grow faster than inflation
- Properties that attract tenants who stay for many years and pay on schedule
Most investors focus on price, cash flow, or property type.
Those are all secondary.
If your purchasing power is not increasing, the strategy is not working.
If you’re interested in exploring how the current Las Vegas market conditions could align with your goals, please use the link below to schedule a time that works best for you.
…Eric
Potential Investment Properties
Below is a link to this month’s list of candidate investment properties. Our proprietary data mining software selected these candidate properties from thousands of available properties, and this is just the first step in our multi-step validation process, as shown below. 
Market Trend
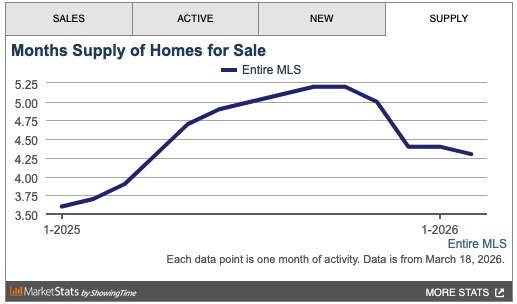
Below are charts from our latest trailing 13-month market report, which includes February data. Remember that this data is only for our target property profile, not the entire metro area. The chart below, from the MLS, includes ALL property types and price ranges. The overall inventory is trending down.
Rentals – Median $/SF by Month Rents increased MoM. YoY is up 2.6%.

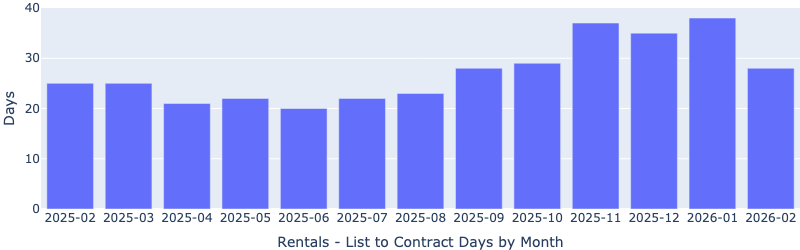
Rentals – Median Time to Rent by Month Median days to rent decreased significantly MoM, now at 28 days, conforming to the seasonal trend.
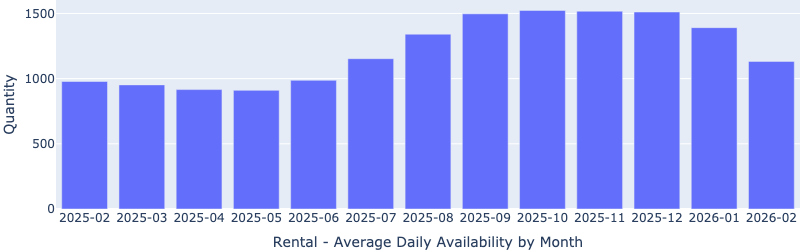
Rentals – Availability by Month The number of homes for rent decreased significantly MoM, which is a bit unusual for the time of the year.
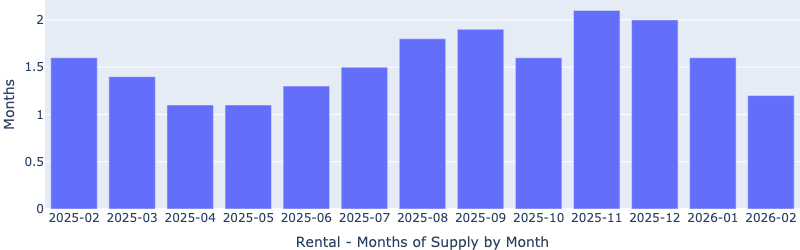
Rentals – Months of Supply Rental inventory decreased significantly again MoM, now at only 1.2 months, indicating a landlord’s market.
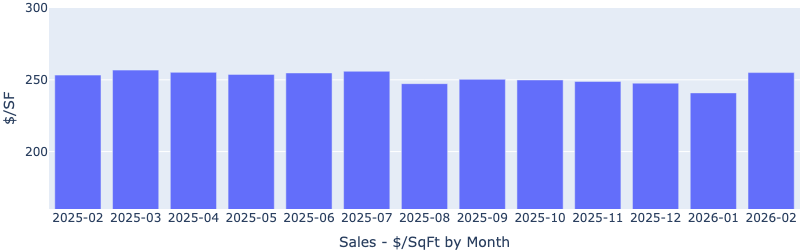
Sales – Median $/SF by Month Prices bounced back significantly MoM, indicating strong buyer demand. YoY is up marginally (~1%).
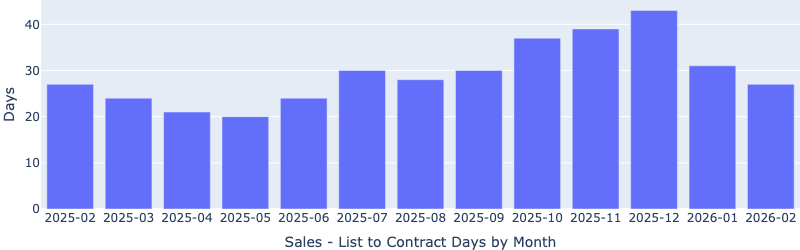
Sales – List to Contract Days by Month Median days on the market decreased again MoM, now at 27 days. This is alongside the strong price increase, indicating a heating up market.
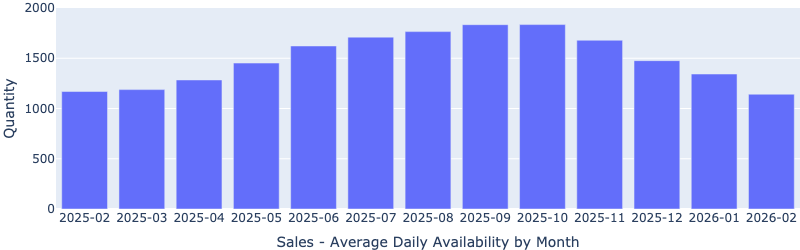
Sales – Availability by Month The number of properties for sale has been steadily decreasing since September, which is a bit unusual for the time of the year (listings usually increase as the spring approaches).
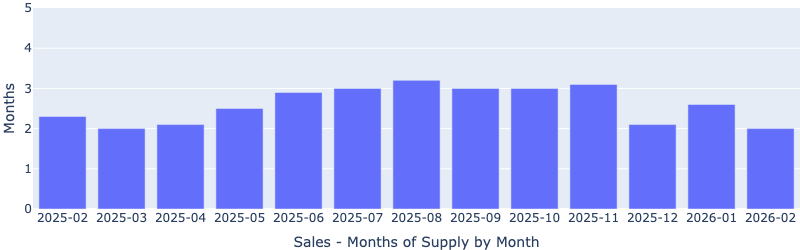
Sales – Months of Supply Sales inventory has come back down MoM to just 2 months, alongside the price increase and shorter time to sell, indicating a heating up market.
About the FERNWOOD Team
We Help Busy Professionals Build Wealth and Reliable Income through Strategic, Data-driven Real Estate Investments in Las Vegas. Here is what our clients have to say about us:
-
For the last 17+ years, we’ve helped clients build highly reliable, passive income streams through real estate that they will not outlive. Several are now retired and living entirely on their rental income. Most never invested in real estate before they started working with us, and most live in other states or countries. Below is a two-minute video of the services we provide.

Want to know what we can do for you?
© 2005-2025 Cleo Li and Eric Fernwood, all rights reserved.