
In This Report
- Why Now Is the Best Time of the Year to Buy Properties
- Potential Investment Properties
- Market Trends
- About the Fernwood Real Estate Investment Group
Why Now Is the Best Time of the Year to Buy Properties
I meet with multiple prospective clients every week. I often hear, “I wish I had purchased sooner.” They regret missing out on rent growth and appreciation. We are approaching what I call another “I wish I had” time in the Las Vegas real estate investment market.
Why Now?
As we approach the holiday season—and particularly this year, with the upcoming presidential election, there are fewer buyers and sellers in the real estate market. (I’ll share my thoughts on the election’s potential impact on property prices and interest rates in next week’s blog post.) Those who keep their properties listed during this period are often motivated to sell, presenting opportunities for better deals. This raises an important question: Is now the right time to buy, or should you wait?
Waiting only makes sense if you can purchase a property for less in the future due to significantly lower interest rates or prices. So, let’s look at interest rates and prices in the foreseeable future.
Interest Rates
The chart below illustrates the monthly inflation rate derived from the 12-month percentage change in the Consumer Price Index (CPI) as reported by the U.S. Bureau of Labor Statistics. The inflation rate dropped from 3.7% in September 2023 to 2.5% by August 2024.
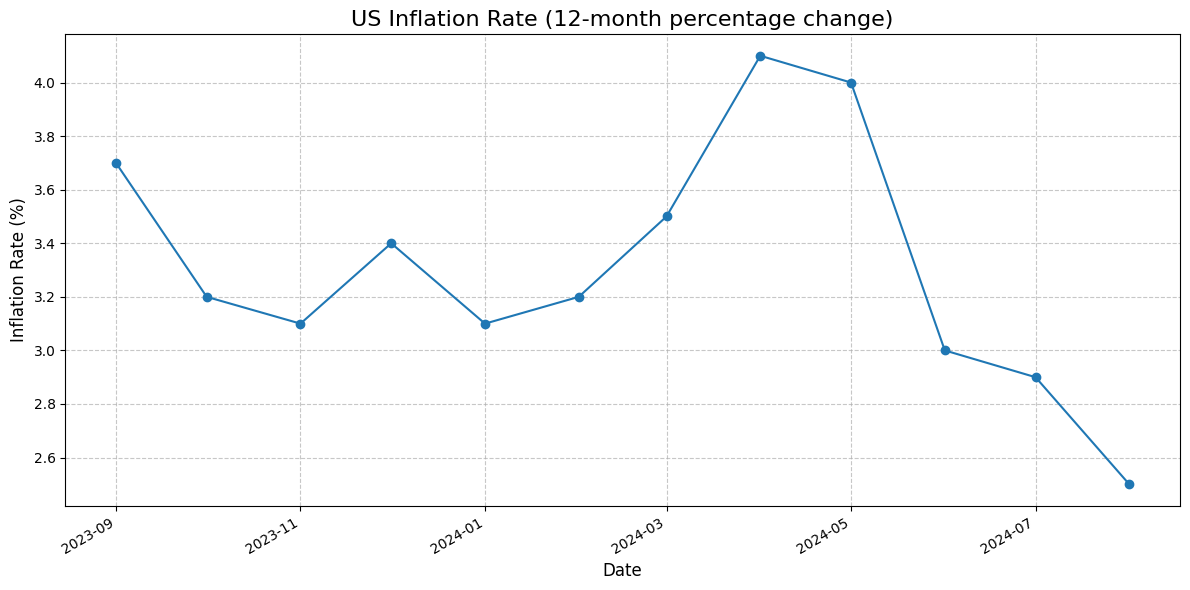
Higher interest rates and other economic factors have slowed inflation. The Fed has begun cutting rates in response. Given the apparent downward trend in inflation, it’s unlikely that interest rates will rise in the near future.
Jobs
The Fed watches the unemployment rate to determine whether to decrease interest rates to stimulate the economy. According to the latest U.S. Bureau of Labor Statistics report, the unemployment rate in September 2024 was 4.1%. This is the most recent official figure available and remains near historical lows.
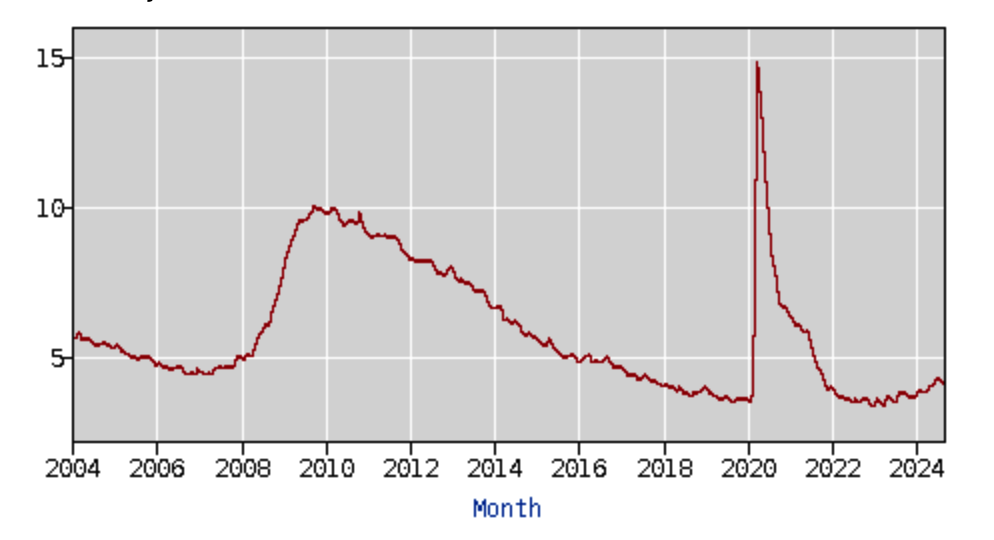
Source: U.S. Bureau of Labor Statistics.
The initial jobless claims are also at or near a 20-year low.
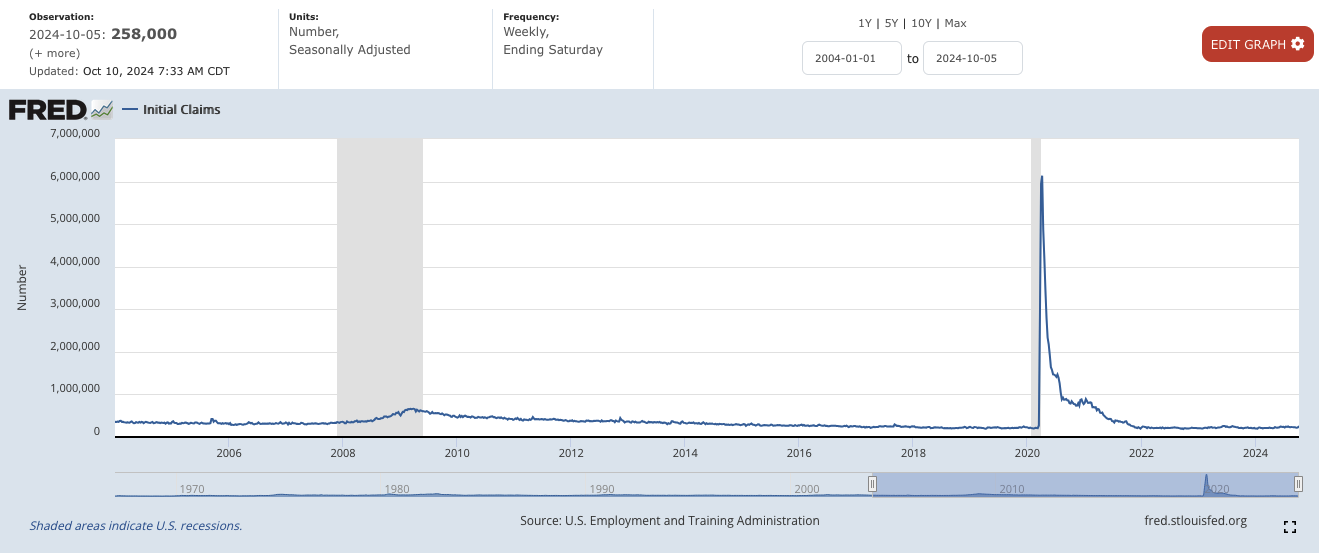
Source: Federal Reserve Bank of St. Louis
Additionally, the wage growth rate is at a 20-year high.
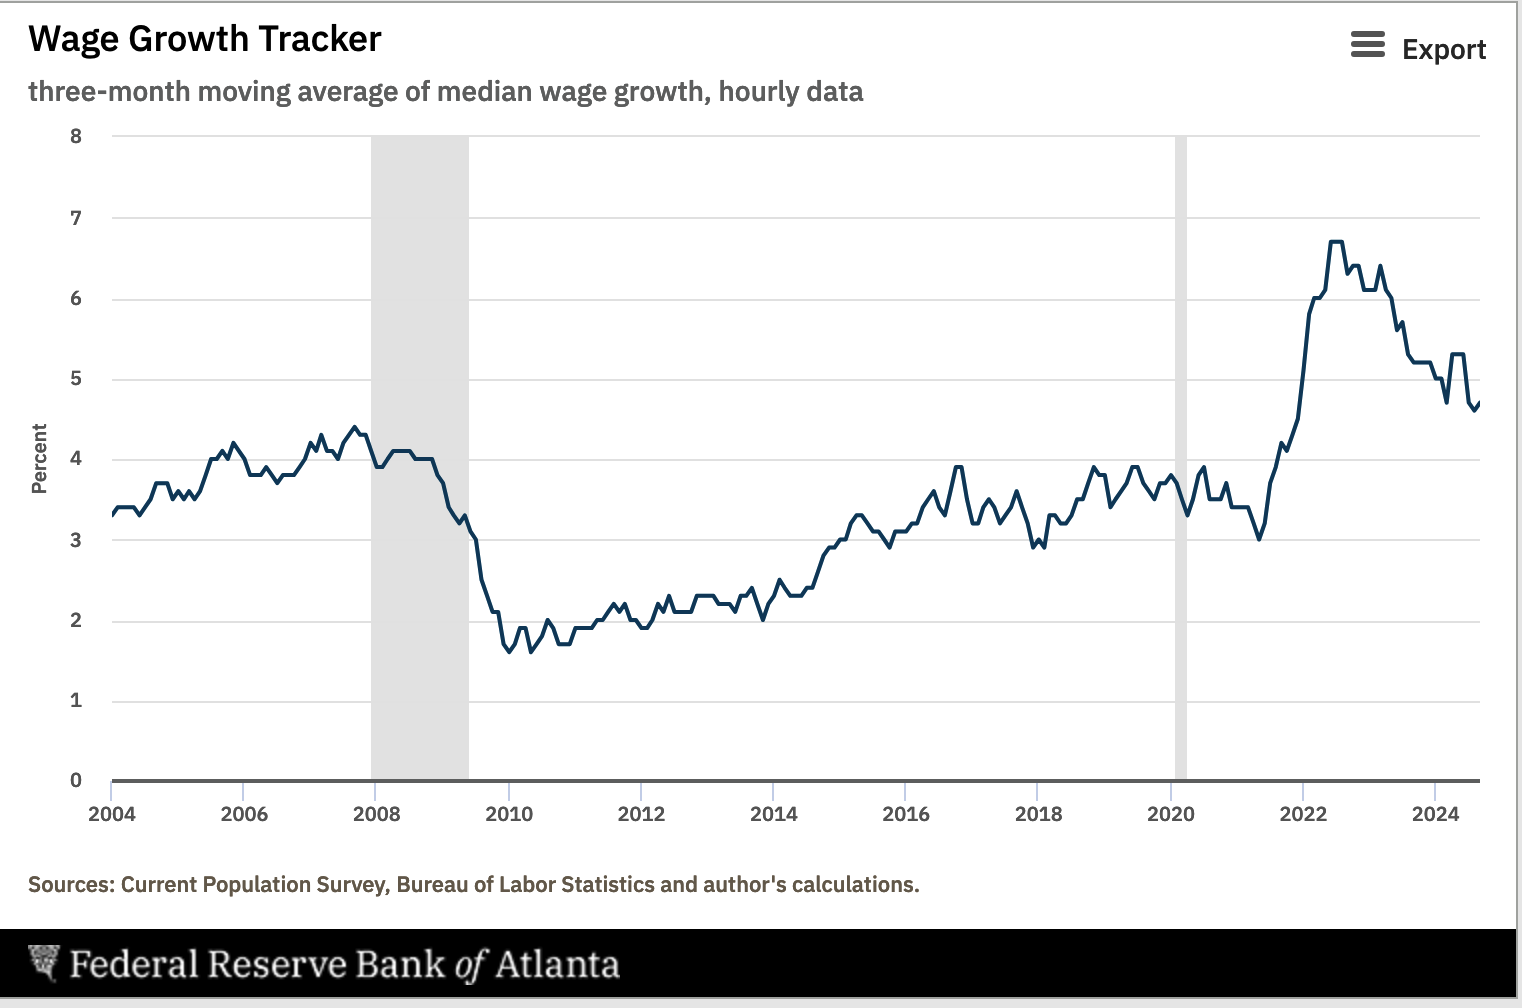
Source: Federal Reserve Bank of Atlanta
With unemployment at this low level, the Federal Reserve has no reason to aggressively lower rates to stimulate the economy—doing so might even drive up inflation again. As a result, I don’t anticipate the Fed significantly reducing rates to boost job creation.
Prices
Given that interest rates are unlikely to fluctuate significantly over the next six to nine months let’s examine the current state of the Las Vegas investment market.
Typically, in the fourth quarter, we expect an increase in inventory (months of supply), longer days on the market, and a slight decrease in price per square foot ($/SF). We anticipate similar trends for rentals. So, what’s the current situation for the property segment we target as of October 14, 2024?
Sales – Months of Supply by Month
Inventory increased slightly, which is reflected in the minor decrease in price per square foot ($/SF) shown in the following chart. Six months of inventory is considered a balanced market, where the number of sellers roughly equals the number of buyers. As you can see, our target segment has about 1.5 months of inventory, indicating a firm seller’s market.

Sales – $/SqFt by Month
There was a slight decrease in $/SF month-over-month, which aligns with historical holiday season trends. Fewer buyers and increased inventory enhance the likelihood of price negotiations, making the fourth quarter an optimal time of year to buy.

In summary, the combination of (relatively) stable interest rates and increased inventory suggests we’re in a lull before an intense period of real estate activity. I expect this heightened activity to begin after January 15th and continue through the summer of 2025.
The Cost of Waiting
I put together the following (oversimplified) table to show the cost of waiting. Below is an explanation of each column:
- Month: I chose to start the table in December 2024.
- % Increase: I assumed 10% appreciation in 2025 (see our 2024 Investor Outlook for my reasons for this appreciation rate). I assumed the appreciation would be .8%/Mo (10%/12). This is invalid because nothing in the real world is linear, but it is the best I could think of.
- Purchase Price: I started at $400,000 in December 2024 and increased the price each month by .8%/Mo due to appreciation.
- % Down: I assumed a 25% down payment.
- $ Down: This is 25% of the purchase price.
- Debt Service: I decreased the interest rate (Interest Rate column) each month to keep the debt service constant at $1,847/Mo.
- Interest Rate: This is the critical column. For the interest rate to offset the increased price and debt service due to appreciation, it must decrease every month. However, based on current economic indicators, it’s unlikely that mortgage rates will decrease by almost 1% in 2025.
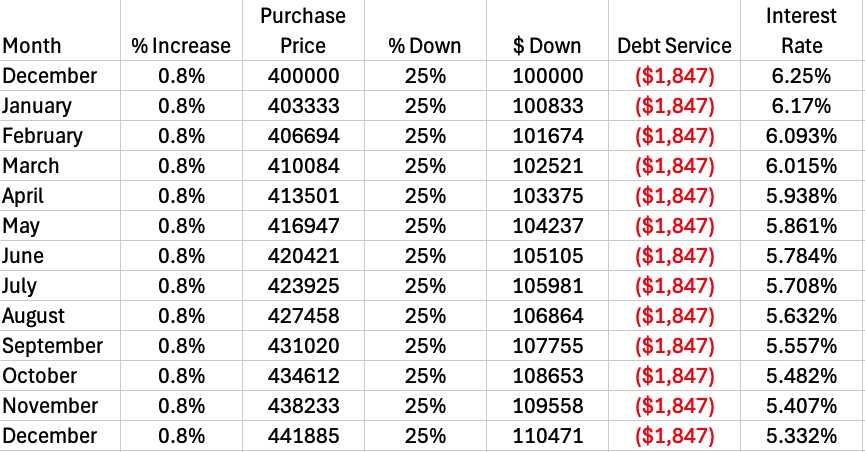
Another crucial factor to consider is the pent-up demand from potential buyers who’ve been priced out of the market due to higher interest rates. If rates drop even slightly, we’re likely to see an influx of these buyers, driving up prices. We’ve observed this pattern repeatedly in our market segment, which is particularly sensitive to interest rate fluctuations. As a result, our 10% appreciation estimate for 2025 might actually be conservative.
If you’re interested in exploring how the current market conditions could align with your goals, please use the link below to schedule a time that works best for you.
Best regards,
…Eric
Potential Investment Properties
Below is a link to this month’s list of candidate investment properties. Our proprietary data mining software selected these candidate properties from thousands of available properties, and this is just the first step in our multi-step validation process, as shown below.

This Month’s List of Candidate Properties
Market Trend
Below are charts from our latest trailing 13-month market report, which includes September data. Remember that this data is only for our target property profile, not the entire metro area. To see all the charts, please click here.
Rentals – Median $/SF by Month
Interestingly, September saw a rent increase MoM ($1.21/SF vs. $1.18/SF), bucking the traditional seasonal slowdown trend. YoY is up 6%.

Sales – Median $/SF by Month
As expected of the season, the $/SF dropped slightly MoM. YoY is up 3%.

Rentals – Median Time to Rent by Month
The median time to rent increased MoM from 22 days in August to 27 days in September. This is in line with the expected seasonal trend and probably correlated to the rent increase in September.

Sales – List to Contract Days by Month
Median days on the market increased marginally MoM, conforming to the seasonal trend.

Rentals – Availability by Month
The number of homes for rent remained flat MoM. YoY increased ~16%.

Sales – Availability by Month
This chart shows the average daily number of properties for sale in a particular month. We are also seeing a slight increase MoM.

Rentals – Months of Supply
About 1.4 months of supply for our target rental property profile. YoY is down 6.7%. Demand is greater than supply. This will pressure up the rents.

Sales – Months of Supply
There are about 1.5 months of supply for our target property profile. A 6 months supply is considered a balanced market. This will continue to drive up the prices.

About the Fernwood Real Estate Investment Group
We Help Clients Acquire Highly Reliable Passive Income Streams
Here is what our clients have to say about us:
For the last 17+ years, we’ve helped clients build highly reliable, passive income streams through real estate that they will not outlive. Several are now retired and living entirely on their rental income. Most never invested in real estate before they started working with us, and most live in other states or countries. Below is a two-minute video of the services we provide.
Want to know what we can do for you?
© 2005-2024 Cleo Li and Eric Fernwood, all rights reserved.


