
Each month, we update this page with 13 months of Las Vegas real estate market statistics for the single-family rental property segment we target. The charts track rental rates, sale prices, inventory, market time, closings, and months of supply, helping investors distinguish short-term fluctuations from meaningful market trends.
The statistics reported by the local press often cover the entire Las Vegas market and may not reflect the properties our clients purchase. For that reason, we compile data for the narrower segment of single-family homes that conforms to our investment property profile.
Note: The data shown in this article only applies to properties that conform to our investment property profile and are based on data from the Greater Las Vegas Association of REALTORS (GLVAR) MLS.
- Type: Single-family
- Configuration: 3+ bedrooms, 2+ baths, 2+ car garages, 1,100 to 2,400 SF, one or two stories, lot size >3,000 SF.
- Rent range: $1,900/Mo to $2,400/Mo
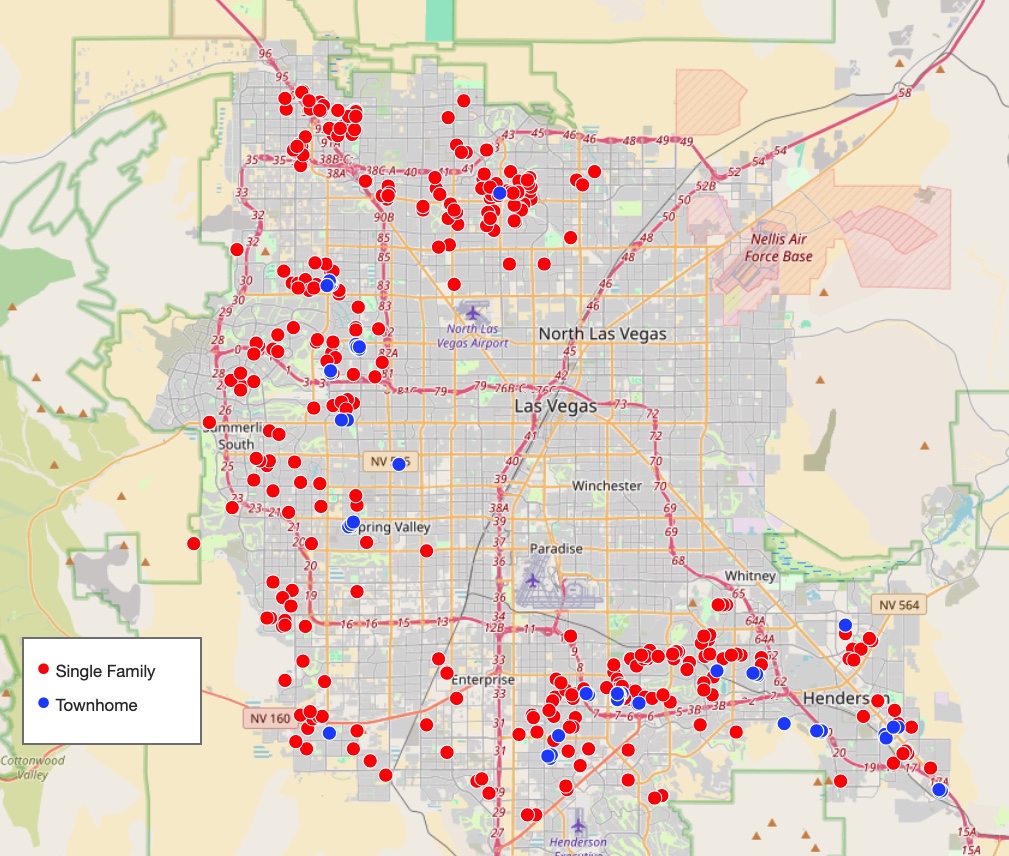
- Location: See the map below for the general areas.
Rental Statistics
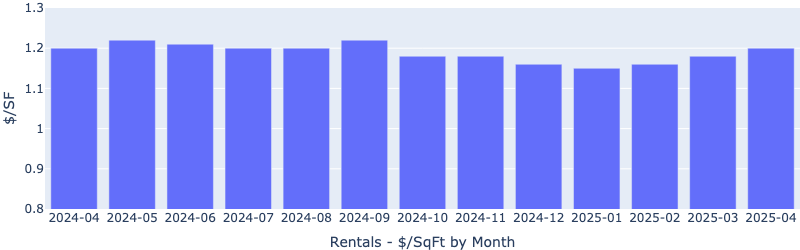
Rentals – Median $/SF by Month
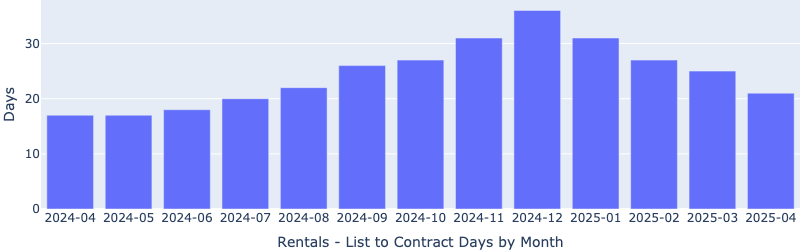
Rentals – List to Contract Days by Month
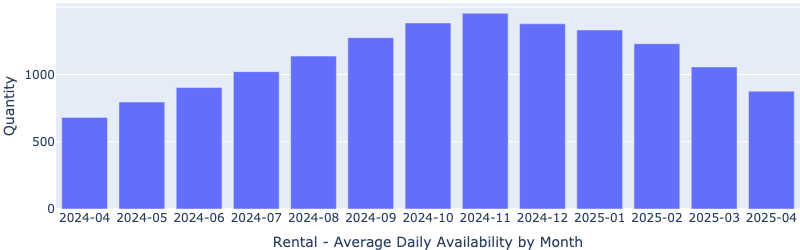
Rentals – Availability by Month
This chart shows the average daily number of properties that were for rent in a particular month.
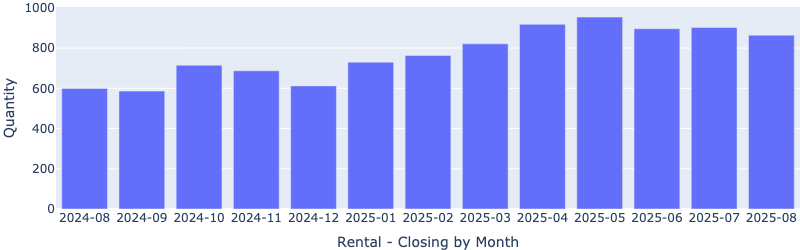
Rentals – Closings by Month
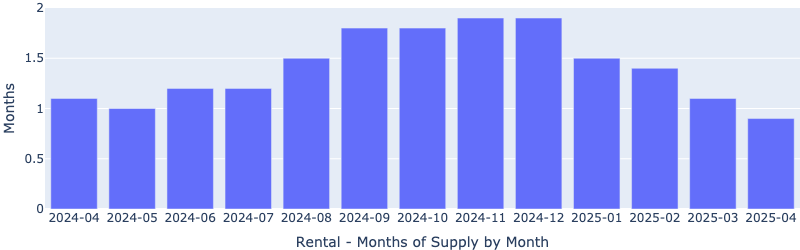
Rentals – Months of Supply
Sales Statistics
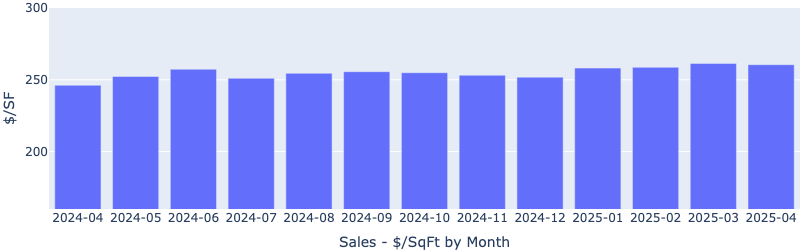
Sales – Median $/SF by Month
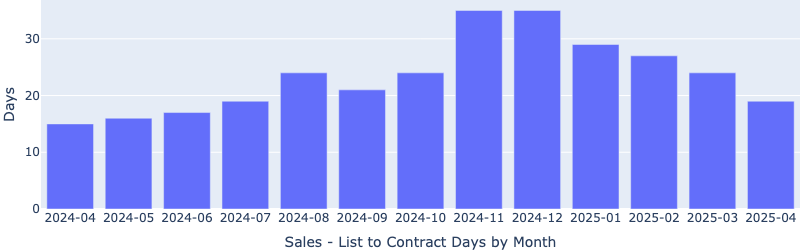
Sales – List to Contract Days by Month
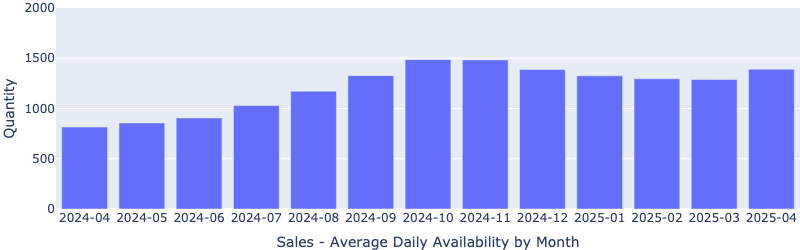
Sales – Availability by Month
This chart shows the average daily number of properties that were for sale in a particular month.
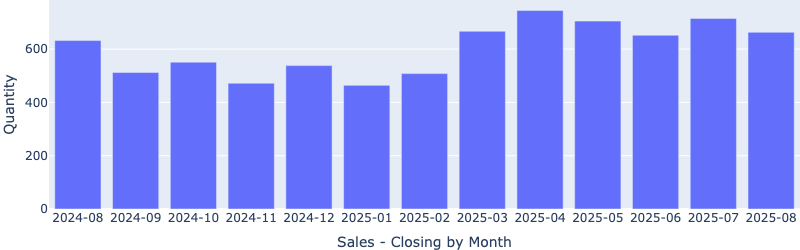
Sales – Closings by Month
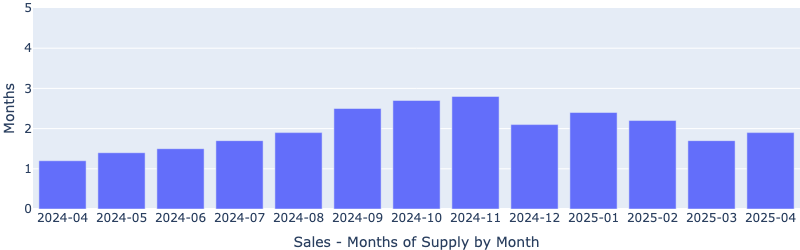
Sales – Months of Supply
© 2005 to 2026 Cleo Li and Eric Fernwood, all rights reserved.
By choosing to use this tool and or information, you are agreeing to the terms on the this license page.