
Las Vegas Appreciation Rates by Areas
All the areas we target outperformed the metro area. The area that performed the best surprised me.
[Image generated with Dall-E]
Clients frequently ask about the appreciation rates for the different areas of Las Vegas. I will use the charts provided by the Las Vegas Realtor Association MLS to show comparable trends.
Below are two charts showing the median $/SF over the past ten years for single-family homes priced between $150,000 and $500,000, with a size between 1,000 and 3,000 SF. This is the configuration that roughly matches our target property profile.
The MLS statistics tool allows a maximum of four areas, so two carts with different areas are below.
The first chart contains:
- Entire MLS: These properties have the same basic parameters as the other areas but include the entire metro area.
- 89123 & 89183: This includes the area referred to as Silverado Ranch.
- Green Valley & Green Valley Ranch: This is the area commonly referred to as Green Valley.
- Summerlin: An area on the west side of Las Vegas commonly referred to as Summerlin.
The second chart contains:
- Entire MLS: These properties have the same basic parameters as the other areas but include the entire metro area.
- Centennial Hills: An area on the northwest side of Las Vegas.
- Summerlin: An area on the west side of Las Vegas commonly referred to as Summerlin.
- Green Valley & Green Valley Ranch: This is the area commonly referred to as Green Valley
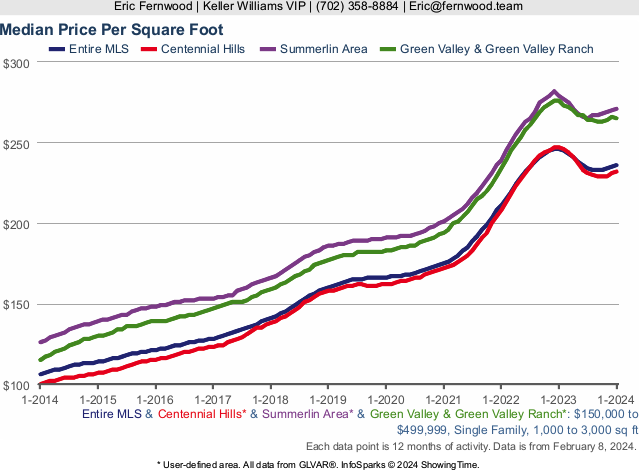
Based on the two line charts above, it’s evident that all our target areas perform similarly. Below is a summary table displaying ten-year performance, followed by area maps and more detailed performance information.
- Summerlin area: 114.29%
- Green Valley and Green Valley Ranch: 130.43%
- Silverado: 135.85%
- Centennial Hills: 132%
- Entire MLS: 122.64%
Area Maps and Performance
Summerlin area
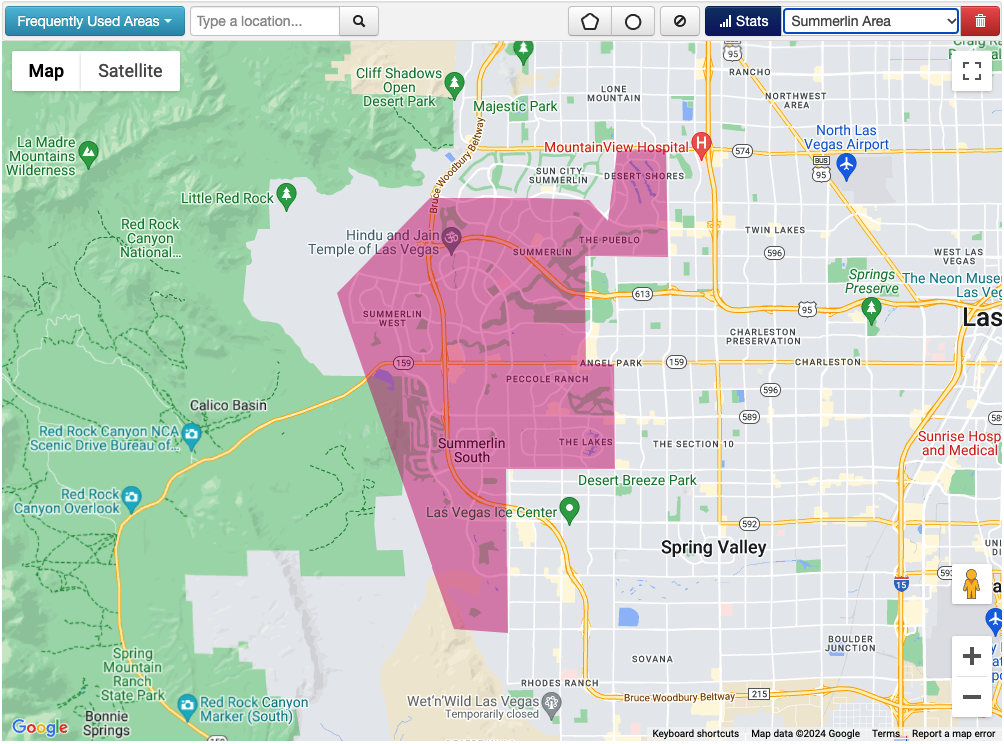
- January 2024: $270/SF
- January 2014: $126/SF
- Growth over the last ten years: ($270 – $126)/$126 = 114.29%
Green Valley and Green Valley Ranch
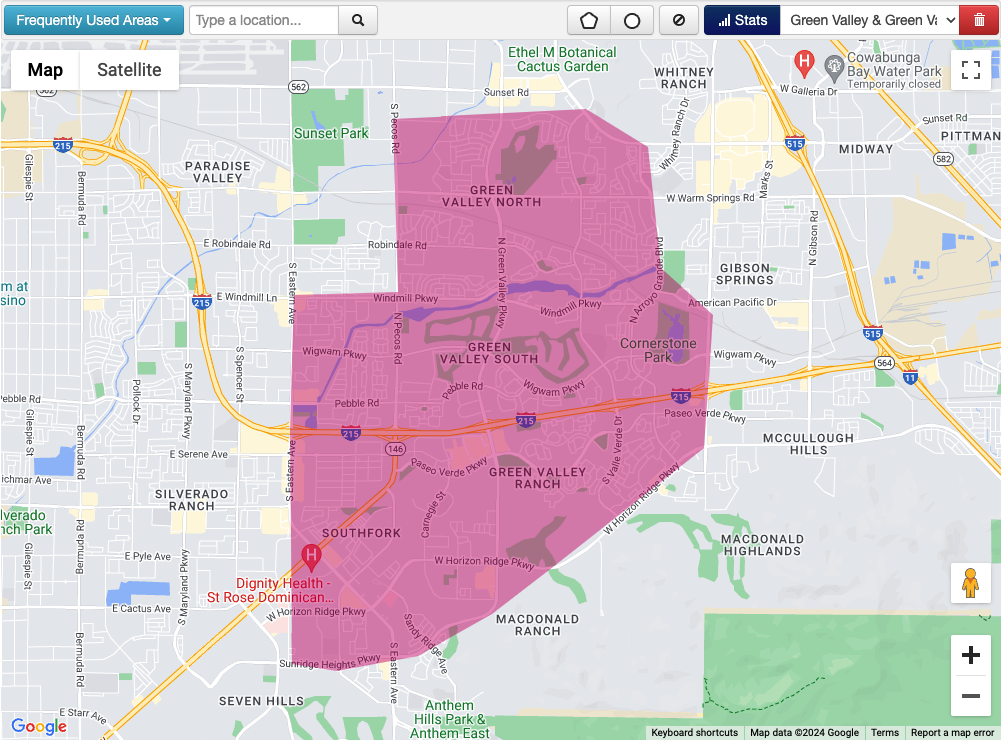
- January 2024: $265/SF
- January 2014: $115/SF
- Growth over the last ten years: ($265-$115)/$115 = 130.43%
Silverado
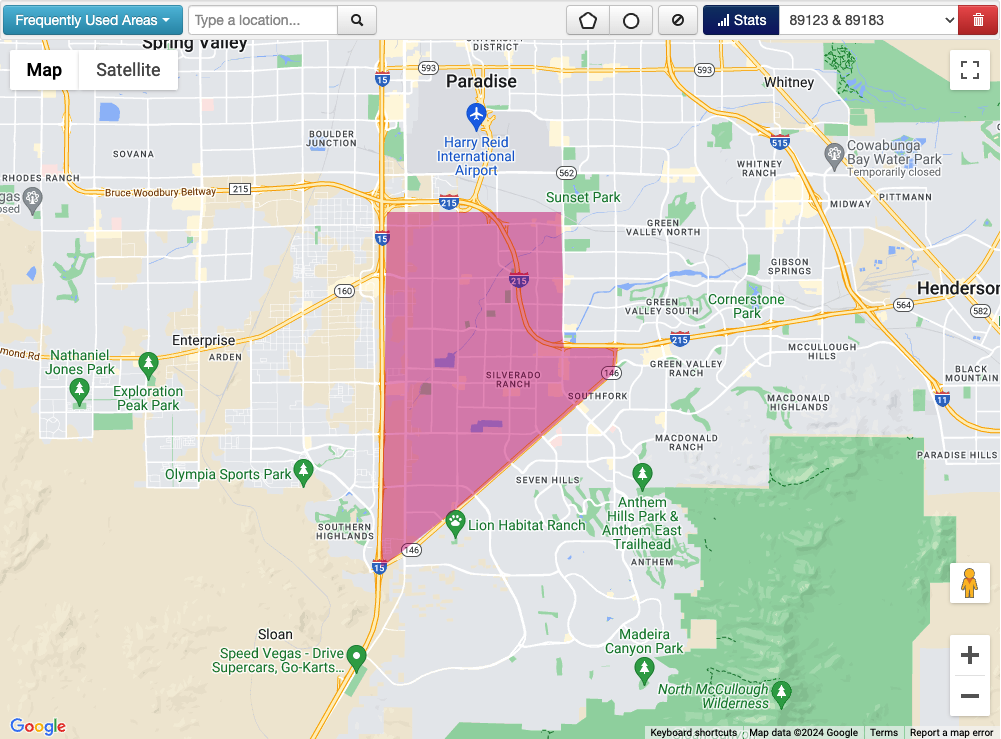
- January 2024: $250/SF
- January 2014: $106/SF
- Growth over the last ten years: ($250 – $106)/$106 = 135.85%
Centennial Hills
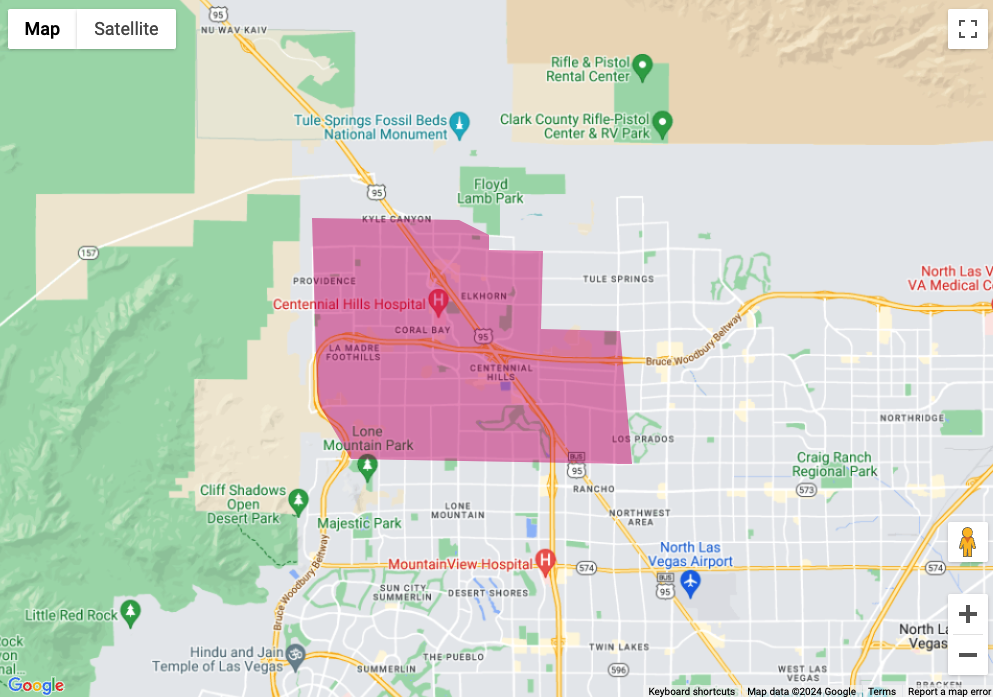
- January 2024: $232/SF
- January 2014: $100/SF
- Growth over the last ten years: ($232-$100)/$100 = 132%
Entire MLS
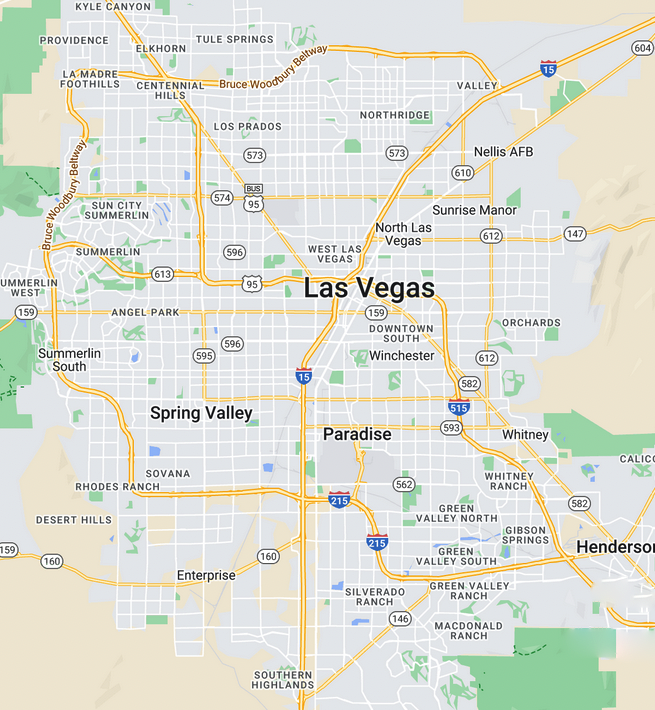
- January 2024: $236/SF
- January 2014: $106/SF
- Growth over the last ten years: ($236-$106)/$106 = 122.64%
Summary
The results surprised me. For our target property segment, Silverado area had the fastest growth, not Summerlin or Green Valley as I expected. Of course, past performance does not guarantee future performance, but this is still very interesting to note.
Related insights
The Affordability Fix Nobody Wants to Talk About — and Why It Won’t Reach Our Target Market
Building more homes is the most effective way to improve housing affordability. But in the Las Vegas segment we target, scarce land and high…
Is Las Vegas Running Out of Water? Why Its Water Supply Remains Secure
Is Las Vegas running out of water? Despite falling Lake Mead levels, Southern Nevada has spent decades preparing for drought. Deep-water intakes, major pumping…

Should You Hold Your Nevada Rental Property in an LLC? What to Check Before You Transfer Title
Thinking about moving a Nevada rental property into an LLC? Before you transfer the deed, understand the potential effects on your mortgage, title insurance,…
Thinking about a Las Vegas rental?
A 30-minute conversation about your goals: whether Las Vegas fits your strategy, what a first property costs, and what the process looks like.
- We learn your goals and make sure we’re the right fit
- You get a clear picture of cash requirements and realistic returns
- You leave with next steps, whether or not you work with us