

In This Report
- My Appreciation Prediction for the Next 5 to 7 Years
- Potential Investment Properties
- Market Trend
- About the Fernwood Real Estate Investment Group
My Appreciation Prediction for the Next 5 to 7 Years
Recently, several clients asked about my opinion on the Las Vegas appreciation rate for the next 5-7 years. I thought it would be a perfect topic for the last 2023 monthly market update. It also helps me research and prepare for our annual investor outlook, which will come out in January.
Looking Back
Although past performances don’t guarantee future occurrences, they are our best indicators when conditions are comparable.
Below is a historical chart from MLS showing the median $/SF trend for single-family homes that roughly match our target property profile. However, the data encompasses the entire metro area, whereas our target is limited to specific zip codes. Therefore, the depicted $/SqFt is lower than that of our target property profile, but it is sufficient for our purposes.
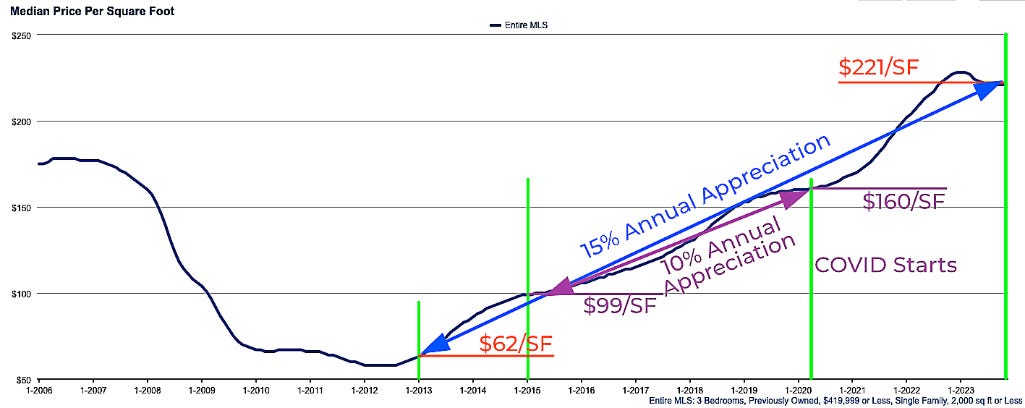
As you can see, the median $/SF for January 2013 was $62 and $221 for November 2023. This means the average annual appreciation for the last ten years was 15% YoY! This has been an amazing run.
However, this period included COVID, and subsequent unprecedented rate hikes by the Fed. These events significantly distorted the housing market, which I do not expect to occur again in the next 5-7 years. Therefore, to get a plausible outlook of the growth rate for the next 5-7 years, it makes more sense to look at the appreciation rate for the 5-year period before COVID. The period from 2015 to March 2020 most closely resembles our condition as we enter 2024. They are not identical, but they are the most comparable.
The median $/SF for January 2015 was $99 and $160 for March 2020. This means the average annual appreciation for the five years before COVID was 10% YoY. Still a very respectable performance for a quiet and “boring” period.
However, the market conditions today are different from 2015. These differences include:
- The inventory (for all home types and prices) was five months in January 2015 and today it is 2.9 months for all property types and price ranges.
- There is a lot less raw land available for development in the Las Vegas Valley.
- A much stronger economy now compared to Jan 2015, as shown by the U.S. Bureau of Labor Statistics data: significant labor force and jobs growth, yet a 30% decrease in the unemployment rate! More detail on this will be in next month’s investor outlook.
- More people are moving to Las Vegas. Redfin data found Las Vegas to be the number one destination for home buyers.
Due to these differences and others, I anticipate a higher appreciation rate over the next five years than the five years before COVID.
What about rent growth? Analyzing rent growth will require software development as the MLS does not publish any rental statistics. I will present my rent growth projection in our annual outlook in January.
Speaking of 2024, we will move our newsletter from Substack to ConvertKit starting in January. So do not be surprised that my next letter comes from the “via n.convertkit.com” domain. You may have to check your spam folder.
I wish everybody a happy and healthy holiday season and a prosperous New Year! See you in 2024.
As always, I welcome your comments.
…Eric
Eric@Fernwood.Team
702-358-8884
We’ve helped more than 180 clients on their path to financial freedom. Many have already made it. If you would like to discuss what we can do for you, please schedule a Zoom chat. I promise not to try to sell you anything.
Potential Investment Properties
Below is a link to this month’s list of candidate investment properties. Our proprietary data mining software selected these candidate properties from thousands of available properties, and this is just the first step in our multi-step validation process, as shown below.

Market Trend
Below are charts from our latest trailing 13-month market report, which includes October data. Remember that this data is only for our target property profile, not the entire metro area. To see all the charts, please click here.
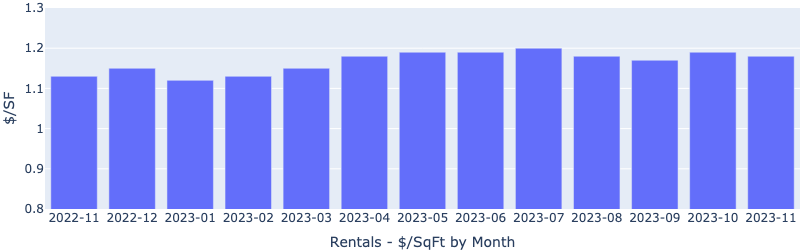
Rentals – Median $/SF by Month
Rents declined slightly MoM, in line with the seasonal trend, but remained strong for November. YoY is up 5.4%.
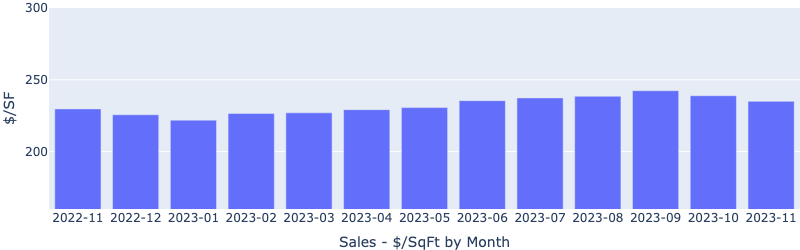
Sales – Median $/SF by Month
Despite increasing interest rates, $/SF climbed up in 2023. YoY is up 2.2%. YTD is up 5.9%. Prices dipped slightly in October and November, reflecting a back to pre-Covid seasonal trend.
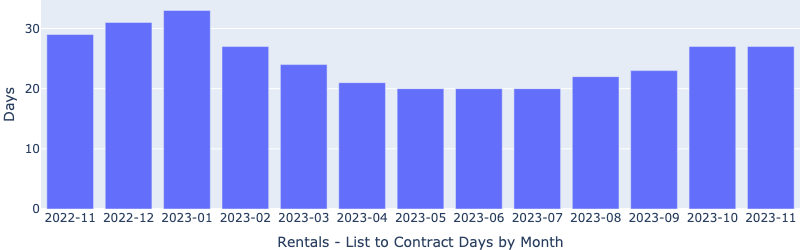
Rentals – List to Contract Days by Month
Median time to rent was unchanged from October, showing a holiday season pattern. YoY is down 10%.
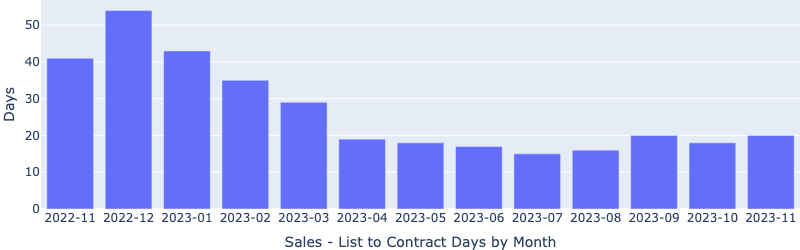
Sales – List to Contract Days by Month
Median days on the market remained under 20 days for November, indicating strong demand even for the season.
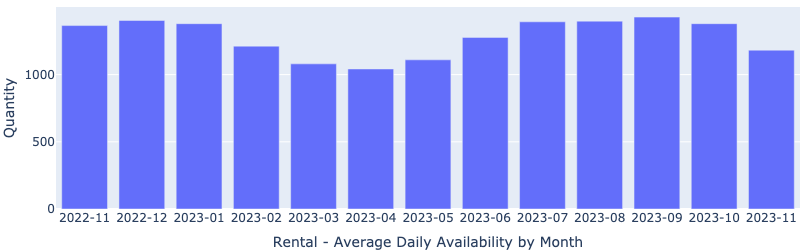
Rentals – Availability by Month
The number of homes for rent continued the downward trend. YoY is down more than 11.5%.
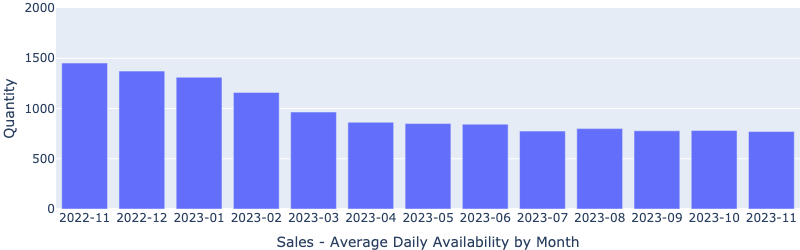
Sales – Availability by Month
This chart shows the average daily number of properties that were for sale in a particular month. It has been declining for the last 13 months.
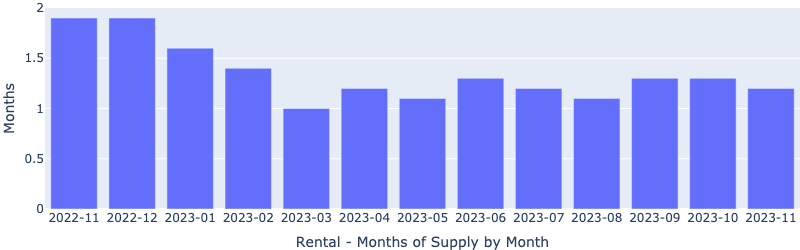
Rentals – Months of Supply
There is only about 1.2 months of supply for our target rental property profile. Demand is greater than supply.
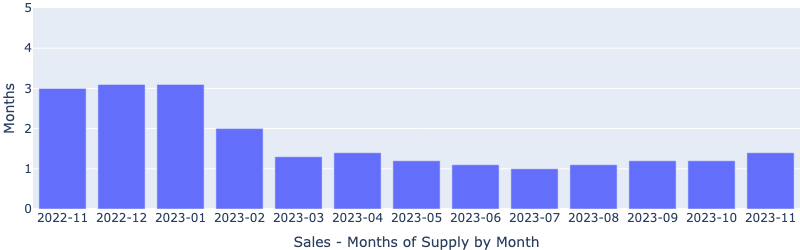
Sales – Months of Supply
Inventory is now at only 1.2 months. A 6 months supply is considered a balanced market. This will continue to drive up the prices.
About the Fernwood Real Estate Investment Group
We Help Clients Acquire Highly Reliable Passive Income Streams
For the last 16+ years, we’ve helped clients build highly reliable, passive income streams through real estate that they will not outlive. Several are now retired and living entirely on their rental income. Most never invested in real estate before they started working with us, and most live in other states or countries. Below is a two-minute video of the services we provide.

Want to know what we can do for you?
© 2005-2023 Cleo Li and Eric Fernwood, all rights reserved.
