
- 2023 Las Vegas Investor Outlook
- Potential Investment Properties
- Market Trend
- About the Fernwood Real Estate Investment Group
- Schedule a discovery call with Eric Fernwood
Every January, we release our outlook on what we believe is likely to happen in the coming year. This year is difficult because so many things are happening simultaneously worldwide.
I started this outlook in our December newsletter, which included a SWOT analysis of the major events. My thanks to all of the people who responded with their views.
My approach: I have always been frustrated by “experts” that are purposely ambiguous so that they are “right” no matter what happens. Our approach is to tell you what we think as specifically as we can, provide the data upon which we base our conclusions, and discuss any contraindicating data that we perceive as major threats to our assumptions.
Las Vegas Investment Situation
I decided to start with the most frequent questions I get concerning the current state of the market.
Foreclosures, REO, and Short Sales
Are there a lot of distressed properties in Las Vegas? No. Below are the number of distressed properties as of 01/10/2023.
-
Bank Owned: 16 or 0.3% of total properties for sale.
-
Short Sale: 3 or 0.06% of total properties for sale.
-
Foreclosure started: 4 or 0.08% of total properties for sale.
The number of distressed properties is insignificant. I do not expect a significant increase due to the equally insignificant number of NODs (Notice of Default) and NOS (Notice of Trustee’s Sale) each month. Few properties are underwater, so if someone can’t pay their mortgage, they will sell the property in a few weeks, pocket the profit, and rent.
Are Prices Decreasing?
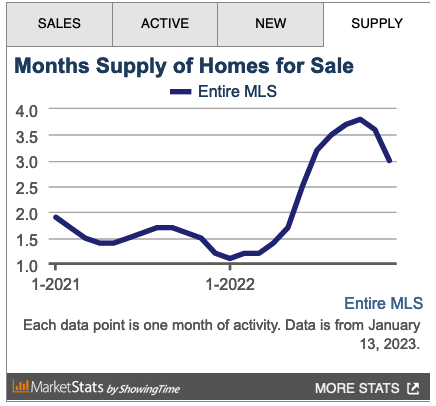
Yes, but prices are not crashing. Also, I do not know if the decreases will continue. It depends on what happens with the interest rates. The chart below is from the MLS (01/13/2023) and includes all single-family homes in all price ranges, not just our target segment. Inventory is currently at about three months and falling. A balanced market in Las Vegas is six months of inventory. With a dwindling inventory, I do not expect any significant price decreases in the foreseeable future.
Are Las Vegas Prices Over-Heated?
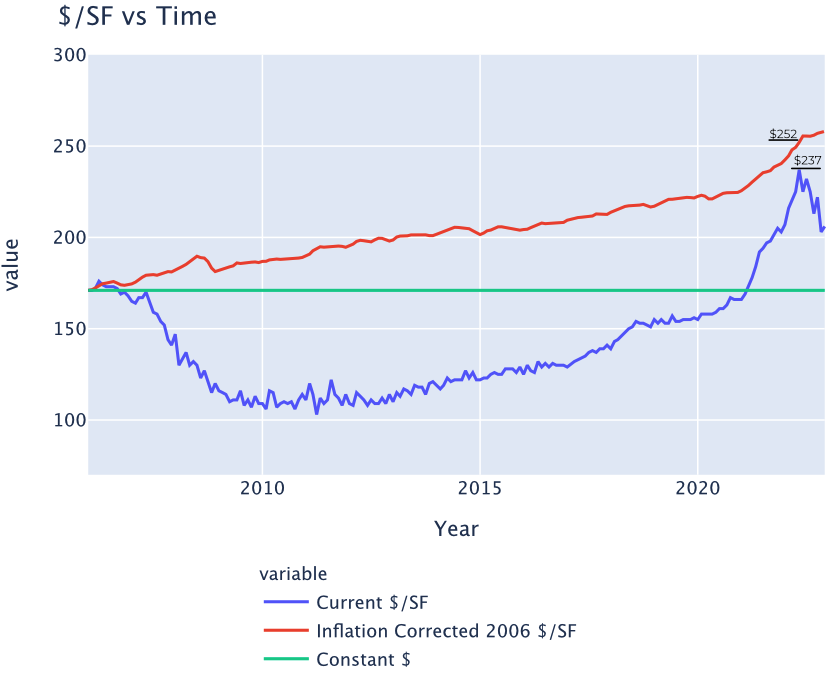
No. See the chart below. The blue line shows the median $/SF without correcting for inflation. The green line is the 2006/2007 peak price uncorrected $/SF. The red line is the inflation-adjusted 2006/2007 peak price. As you can see, the current $/SF is still below the inflation-corrected peak prices of 2006 and 2007.
How Does the Current Market Compare to 2008?
The market conditions of 2008 are in no way comparable to the current market. See the table below for some specifics.
| 2008 | Today | |
|---|---|---|
| Percentage of homes underwater | >90% | ~.7% |
| Months of inventory | >90 months | ~3 months and falling. |
| Jobs | Huge layoffs and few replacement jobs available. | According to Class Door and Monster, there are between 26,000 and 31,000 open jobs. |
What Is Happening With Tourism?
A significant part of the Las Vegas economy is based on tourism. Fortunately, tourism is at or near 2019 (pre-COVID) levels. Conventions are back, and gaming is doing well. See the articles below for specifics.
-
Business travel back – “Convention attendance near pre-COVID levels”
-
Airport to mark records aplenty – Las Vegas is considering building a reliever airport south of Las Vegas to handle increased travel.
I believe tourism will increase in 2023. For example, before the COVID lockdown, Chinese nationals were a significant component of total visitors. Due to Chinese COVID policies, the number of Chinese nationals visiting Las Vegas drastically decreased. It appears that quarantine policies have been relaxed or eliminated. Once the COVID situation in China stabilizes, I expect many Chinese will come to Las Vegas, increasing tourism revenues and creating demand for more workers. Another example is the increasing number of major sports events that will attract more visitors to Las Vegas.
Will A Recession Affect Rental Income?
I expect the potential coming recession will have little or no impact on our clients’ rental income. Why?
In 2005, I did extensive research to find a reliable tenant pool segment. I selected a narrow segment based on multiple characteristics. One is that they are largely direct income producers for their employers. Because they are direct income producers, companies rarely lay them off unless the business shuts down operations.
Over the last +15 years, rental income from our target segment has been very consistent. While history is not a reliable predictor of the future, it is our best indicator. Below is what happened during two major traumatic economic events and the eviction moratorium.
-
During the 2008 crash, rents did not decline, and there were no vacancies. Although property prices plunged by more than 50%, rental income remained unchanged.
-
COVID – Almost no impact.
-
Eviction moratorium – Almost no impact.
However, owners of C and B-class properties are likely to be seriously impacted if there is a significant recession. The tenant segment that occupies C and B-class properties is largely low-paid, low-skilled workers who are easily replaced. They are the first to be laid off and the last to be rehired during economic stress. During the 2008 crash, many C and B-class properties were vacant.
Should I Buy Real Estate in 2023?
When I talk to people, I ask how they did in 2022. Depending on who I talk to, the answer ranges from “lost a lot” to “millions.” Many had most of their capital in the stock market, and some had fixed-rate instruments. Many also had significant money in crypto.
-
Stock market – The S&P 500 closed out 2022, its worst calendar year performance since 2008, on a low note. The benchmark index fell more than 5% in December, finishing 2022 down almost 20%. And analysts aren’t sure if the worst is over yet.
-
Crypto – Bitcoin prices dropped nearly 65% in 2022, its worst annual performance since its 73% decline in 2018. Ethereum prices dropped 67.7% in 2022. There are no signs that the crypto winter will turn around in 2023.
-
Fixed-rate instruments – CDs and similar instruments are not keeping pace with inflation. CDs currently pay between 4% and 4.6% on a 12-month term. The current “official” inflation rate is 6.5%, so you are guaranteed to lose 2% or more each year. Plus, you pay taxes on any gains, further reducing your rate of return.
In my opinion, if you keep your money in the stock market, CDs or crypto, you can expect more losses in 2023. More on this later.
Our Client’s Property Performance in 2022
Rents increased 4.5% YoY, but prices were almost flat. See the charts later in this report. From 2013 through 2021, average annual appreciation was over 15%, and annual rent growth was over 8%. So, while 2022 was not a great year for appreciation, clients had no break or decrease in rental income.
Las Vegas Fundamentals
Why do I believe Las Vegas will do well in the medium and long term?
There are multiple reasons, including the following.
- Land shortage – Las Vegas is an island of privately owned land surrounded by an ocean of federal land. At the end of 2019, the amount of vacant buildable land in the Las Vegas Valley was less than 28,000 acres, of which 5,000 to 7,000 acres is not viable for residential development. (87.5% of Clark County is federally owned. 85% of the entire state is federally owned.) The consumption rate is about 5,000 acres/Yr. See the animated GIF below. The areas in brown are federal land. The time-lapse only goes through 2020, and there was a large amount of development in 2021 and 2022. The shortage of land combined with the increasing population almost guarantees property prices and rents will continue to increase.

-
Pro-business government – With a low-regulation environment, streamlined licensing and approval processes, and favorable tax policies, Nevada is a very business-friendly state.
-
Jobs – According to Glass Door and Monster, today, Las Vegas has between 26,000 and 31,000 open jobs. Jobs bring people, which will increase the demand for housing.
-
Low property taxes and insurance – The average property tax rate in Nevada is 0.55%. According to MortgageCalculator.org, Nevada has the 8th lowest property tax rate in the nation. And Nevada has the 10th lowest average insurance cost in the nation. See the table below comparing three popular no-income tax states. Property taxes and insurance are a direct hit on the bottom line.
| State | Average Property Tax % | Average Insurance Cost | State Income Tax |
|---|---|---|---|
| Texas | 1.66% | $2,554 | 0% |
| Florida | 0.91% | $1,977 | 0% |
| Nevada | 0.60% | $1,094 | 0% |
-
Dependable passive income properties are affordable – The current sweet spot for single-family and townhouse investment properties is between $320,000 and $475,000.
-
Low maintenance cost – Las Vegas properties have low maintenance costs due to the construction materials required by the Mojave Desert’s climate. Due to the lack of moisture, our selection criteria, and construction materials, our average annual maintenance is about $350.
-
Growing – There is over $22B under construction and more announced, which will create thousands of new well-paying jobs. All these new jobs will bring thousands to Las Vegas and continue to drive up prices and rents.
-
Low commercial energy cost – California: $0.2278/KwH, Nevada: $0.1015/KwH. Also, Las Vegas is one of the few cities in the US with dual electric power sources, critical for servers and electricity-dependent industries like data centers and Internet switching.
-
Internet backbone – The fiber optic bundle connecting Southern California to the East Coast runs under Las Vegas Boulevard. This is why Google is building a $1.2B data center here.
-
Population growth – The population continues to grow at a sustainable rate of between 2.5% to 3%.
-
Landlord friendly – The time and cost to evict a non-performing tenant are about 30 days (depending on whether the tenant retains an attorney and court backlog) and $500. Also, the laws allow lease agreements to place much of the cost for damages on the tenant. Plus, the ability to deduct any damage beyond reasonable wear and tear from the tenant’s security deposit. The lease agreement terms are the major reason our target properties’ average tenant turn cost is under $500.
-
Proximity to California – California seems to be doing all it can to drive people and companies out of the state. The proximity to California, especially LA, ensures that Las Vegas will continue to gain population and businesses.
Threats to Las Vegas Investments
Below is a list of threats that could adversely impact Las Vegas as an investment location.
Water Shortage
Here is an article on the Las Vegas water supply. The short answer, Las Vegas is unlikely to have a water shortage. However, electric rates could increase if more power is purchased from California. Because tenants pay for all utilities, higher rates will have little impact on owners.
Significant Price Decrease
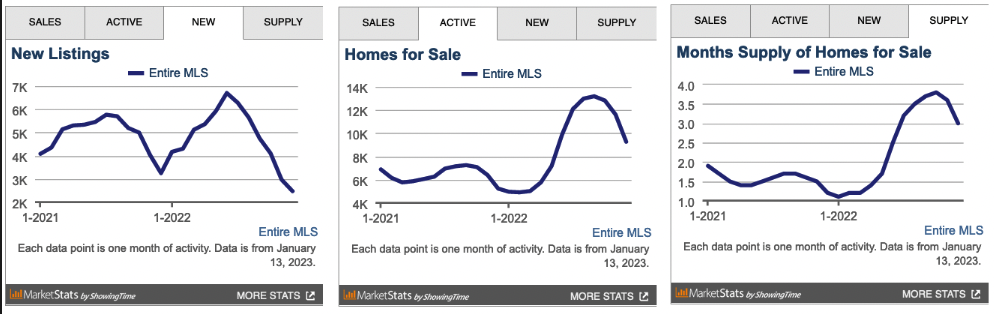
The charts below are from the MLS (01/13/2023). The supply of properties is falling. With falling inventories, I do not see prices decreasing significantly.
Significant Interest Rate Increases
Significant interest rate increases will put downward pressure on prices. However, as the Fed is expected to slow its rate hikes amid cooling inflation and the economy, the mortgage interest rates are expected to drop in 2023.
Severe Recession
Many economists are predicting that the US will likely tip into a mild recession in 2023. Some even argue that a “soft landing” is possible, meaning no recession at all. Though not completely off the table, a severe recession is unlikely.
Based on the strong job data, stable weekly unemployment claims, and high household cash balances, there are no signs of a recession at this time.
In the (unlikely) event of a severe recession, the Fed will cut rates, which helps to boost home prices.
Severe Unknown Unknowns
No one predicted the impact of COVID until it was upon us. There will be additional events that will impact the economy, but none that I have read seem credible: war with China, war with Russia, another COVID, etc.
My Predictions
In the near term, interest rates will be the key factor.
-
If interest rates rise significantly, buyers will be choked off, and prices will fall slightly.
-
If interest rates remain relatively stable, I believe prices will remain relatively static.
-
If interest rates fall even slightly, the demand for homes will surge, and prices and rents will rise.
Mid-term (1-2 years), I believe interest rates will fall to 4% or 5%, and prices and rents will resume significant increases.
Many individuals and institutions who did poorly in 2022 are seeking more secure investments, such as residential real estate. This will add upward pressure to housing prices and rents.
In summary, in the short term, it all depends on what happens with interest rates. Longer term, the shortage of homes and increasing population will drive up prices and rents at a rapid rate.
It’s 2023. What are you going to do?
2022 was brutal for anyone with money in stocks, bonds, or crypto. Depending on your investment mix, you probably lost 20% of your total capital or more. It’s now 2023. Is your plan to continue holding the same investments that lost so much money in 2022, even though expectations are further losses?
“Insanity is doing the same thing, over and over again, but expecting different results.” – Albert Einstein.
I believe every portfolio should have a significant portion allocated to real estate. Of course, we want you to invest in real estate with us.
A regular question I receive concerns the difference between stocks (mutual funds, etc.) and real estate. I will briefly answer that question.
Stocks, Bonds, Etc.
Stocks and similar instruments are tools for accumulating capital. Once you accumulate enough capital, you then draw down during retirement, as shown below.
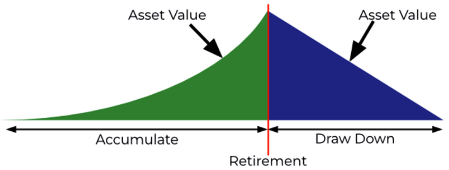
There are fundamental problems with the accumulate and draw down approach, including the following.
-
You must know how much initial capital is necessary before you start drawing down to deal with inflation, recessions, market crashes, etc. Even if you knew, could you accumulate enough post-tax capital?
-
You must know how long you will draw down the funds. What happens if you or your spouse live longer than expected?
-
You must be able to consistently pick stocks that outperform index funds to handle recessions, market crashes, and inflation during the entire draw-down period. If you could do this, you would already be a billionaire, so you can’t.
-
You will likely leave little to your children to help them get a start on life.
Real estate is a combination of income stream and capital accumulation.
-
You buy enough rental properties that the combined rental income matches your income needs.
-
No need to worry about inflation. If you buy in the right location, rents will rise faster than inflation.
-
No need to worry about outliving your accumulated capital. Rental income streams will last longer than you and probably longer than your children.
-
You create dynastic wealth. There are families in Europe and Asia that are living off investment property ancestors purchased several generations ago. You can give your children a leg up on life.
-
You can use cash-out refi to grow your real estate portfolio with limited additional capital investment.
-
30-year fixed rate financing. No other investment even comes close to the leverage available for residential investments.
-
Tax advantages – Depreciation and other tax advantages have no equal.
More of the same or is it time for diversification?

FAQ
Q: How much do dependable passive income properties cost?
A: Properties that attract our target tenant pool range between $320,000 and $475,000.
Q: How much cash will I need?
A: On a $400,000 property, assuming 25% down, 2% closing costs, and a $20,000 renovation, the total cash out would be approximately $128,000.
Q: What can I expect for first-year returns?
A: It depends on how much you put down and the specific property. Below are typical:
-
25% down – break even, without including tax advantages, which can increase effective return by 3-6%.
-
Cash – 5% to 6%, without including tax advantages.
Q: How do I find out more?
A: Book a discovery call with me. If we, or Las Vegas, do not make sense for your situation, I will tell you. You have nothing to lose and financial security to gain.
Ask Me Anything
As always, I value your feedback. This year I am taking a step further. I am holding an “ask me anything” session online on Saturday, January 28th, at 11 am PT / 1 pm CT / 2 pm ET. Please use the following link to register so I can send you the zoom link.
Register for “Ask Me Anything” on Saturday, January 28th, 11 am PT / 1 pm CT / 2 pm ET
I look forward to talking with you then.
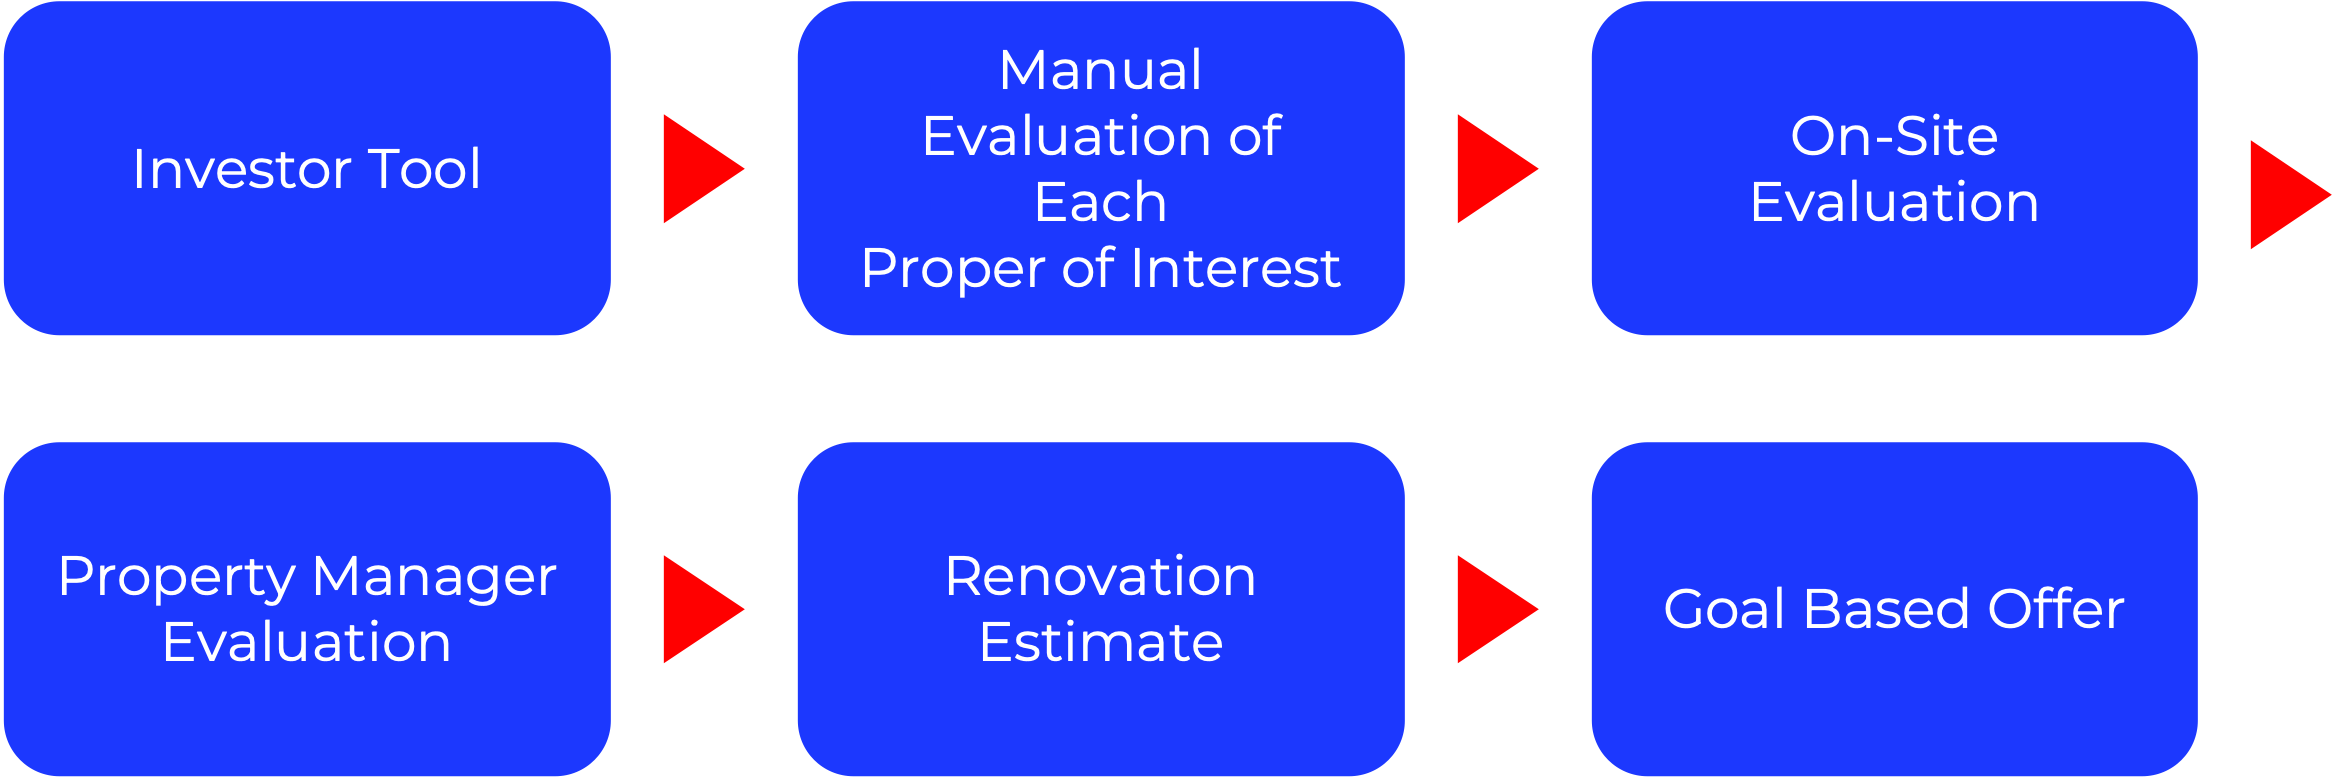
Below is a link to this month’s list of candidate investment properties. Our proprietary data mining software selected these candidate properties from thousands of available properties, and this is just the first step in our multi-step validation process, as shown below.
Below are charts from our latest trailing 13-month market report, which includes December data. Remember that this data is only for our target property profile, not the entire metro area. To see all the charts, please click here.
|
Rental Statistics
|
Sales Statistics
|
|
Rentals – Median $/SF by Month
Interestingly, December rents were up from November. We will see if this continues as a trend. YoY rents are up 4.5%.
|
Sales – Median $/SF by Month
Prices saw another slight drop from November, though the decrease is flattening. YoY were flat.
|
|
Rentals – List to Contract Days by Month
Median time to rent is just over 30 days for December, indicating that rental activities were slow.
|
Sales – List to Contract Days by Month
Median days on market increased significantly in December. Aside from seasonality, this indicates that sellers and buyers were in a standoff. We noticed that properties started selling quicker in January. Should be interesting to see the price trend in January.
|
|
Rentals – Availability by Month
This chart shows the average daily number of properties that were for rent in a particular month. Rental inventory continued to drop MoM. I suspect the rents will have another increase in January.
|
Sales – Availability by Month
This chart shows the average daily number of properties that were for sale in a particular month. The number of homes on the market has been decreasing since October.
|
|
Rentals – Months of Supply
Still just a little over one month of supply for our target rental property profile. Demand is still greater than supply. This will push up the rent.
|
Sales – Months of Supply
Inventory is at 3 months for December. 6 months supply is considered a balanced market.
|


For the last 15+ years, we’ve helped clients build highly reliable, passive income streams through real estate that they will not outlive. Several are now retired and living entirely on their rental income. Most never invested in real estate before they started working with us, and the vast majority live in other states or countries. Below is a two-minute video of the services we provide.


© 2005-2022 Cleo Li and Eric Fernwood, all rights reserved.

