
- A SWOT Analysis of Las Vegas Investment
- Potential Investment Properties
- Market Trend
- About the Fernwood Real Estate Investment Group
- Schedule a discovery call with Eric Fernwood
In January, we will publish our 2023 investor outlook. This year it will be particularly challenging because there are so many variables. The economy, interest rates, inflation, the housing market, Ukraine, etc. I use SWOT analysis when I need to organize and consolidate subjective information. If you are not familiar with SWOT, here is a reference. Simplistically, SWOT is a method of categorizing information into four categories.

A SWOT (strengths, weaknesses, opportunities, and threats) analysis looks at internal and external factors that can affect (in our case) real estate investments in Las Vegas. I’ve used SWOT analysis over the years to consolidate and organize subjective information.
I will base our 2023 Investor Outlook on the SWOT. I would appreciate your opinion of what I’ve included. What am I missing? What should I eliminate or change? General comments?
I hope you find the SWOT information useful and I look forward to your feedback.
Strengths
- Land shortage. At the current consumption rate (~5000 acres a year), Las Vegas will run out of developable land in about 6 years. The only growth path would be tearing down and redeveloping, resulting in high new home prices. This will push up the existing home prices as well.
- The population is growing and is projected to grow by 2% to 3% annually (Source 1, Source 2).
- Enough jobs to support the growing population. Depending on the job site, there are between 26,000 and 31,000 open jobs in Las Vegas.
- Massive construction projects (>$22B) will create thousands more jobs. Many new jobs match our target tenant segment, increasing demand for residences and driving up rents and prices.
- Pro-business government, no state income tax, low property taxes, and low energy prices continue to attract business to Las Vegas.
- Very few properties are underwater. Very few distressed sales. There will be no repeat of the 2008 crash.
- Decreasing inventory. See the charts below. This shows that instead of mass panic selling, more would-be sellers simply stay on the sideline and wait for more favorable conditions. Few people are forced to sell. Decreasing inventory will stabilize prices, and prices will increase if the inventory falls enough.

Weaknesses
- Dependance on tourism. People have to have a place to live, but they do not have to vacation. If the economy goes into a steep recession, fewer people will vacation. That may cut down tourism jobs. However, the tenant pool we target is not tourism-dependent. Plus, tourism is up in Las Vegas. “An estimated 3.6 million people visited Southern Nevada in October, 7.3 percent ahead of last year and just 0.8 percent off October 2019.” RJ
- See any other weaknesses I should include?
Opportunities
- Fewer buyers. Less competition. The few people anxious to sell are willing to contribute to the buyer’s closing costs (buy down the interest rate) and reduce prices, making first-year break-even or even cash flow positive. While there are a few good deals, there are still no steals.
- This is likely the “bottom” of the current market correction barring any major threats listed below materializing.
- Prices and rents go up for the foreseeable future due to the strength listed above.
Threats
- The perception of a water shortage – I wrote an article on the Las Vegas water supply. The short answer, Las Vegas is unlikely to run out of water. However, electricity rates could increase if more power is purchased from California. But because tenants pay for all utilities, higher rates will have little impact on owners.
- The federal government decides to release vast amounts of federal land. This has not happened. Because it would require a congressional vote and the
clownspoliticians do not seem able to work together, this is unlikely. - Inflation remains high or even increases. This will cause the Fed to continue hiking interest rates aggressively, pressuring down home prices. Currently, the consensus is that inflation and interest rate hikes are expected to come down in 2023. “Federal Reserve Chairman Jerome Powell confirmed Wednesday that smaller interest rate increases are likely ahead and could start in December.” CNBC
- The economy slips into a recession. The Fed is expected to reverse course and cut interest rates if that happens. Lower interest rates increase demand for homes and will increase prices, especially when supply is already low.
- The war in Ukraine expands unpredictably.
- Rapid and significant inventory increases. However, I can not think of a likely source of inventory increase. With significant equity in the homes, few are forced to sell. With few distressed properties, there will not be a massive wave of foreclosures that hit the market at the same time. Home builders have no reason to suddenly release a large amount of inventory. Can you think of a scenario that may cause a rapid and significant inventory build-up?
That’s it for my current SWOT elements.
What did I miss? Please reply to this email and let me know. I look forward to your feedback.
Below is a link to this month’s list of candidate investment properties. Our proprietary data mining software selected these candidate properties from thousands of available properties, and this is just the first step in our multi-step validation process, as shown below.

Note: Due to the rapid increase in interest rates, first-year returns are low. However, the return increases significantly even with a conservative 8% annual rent increase. The typical rent increase range is 8% to 12%. Contact me if you’d like detailed analysis for this subject.
The following is a property from the list that caught our eye. It looks to be a good investment property. Contact me if you are interested.
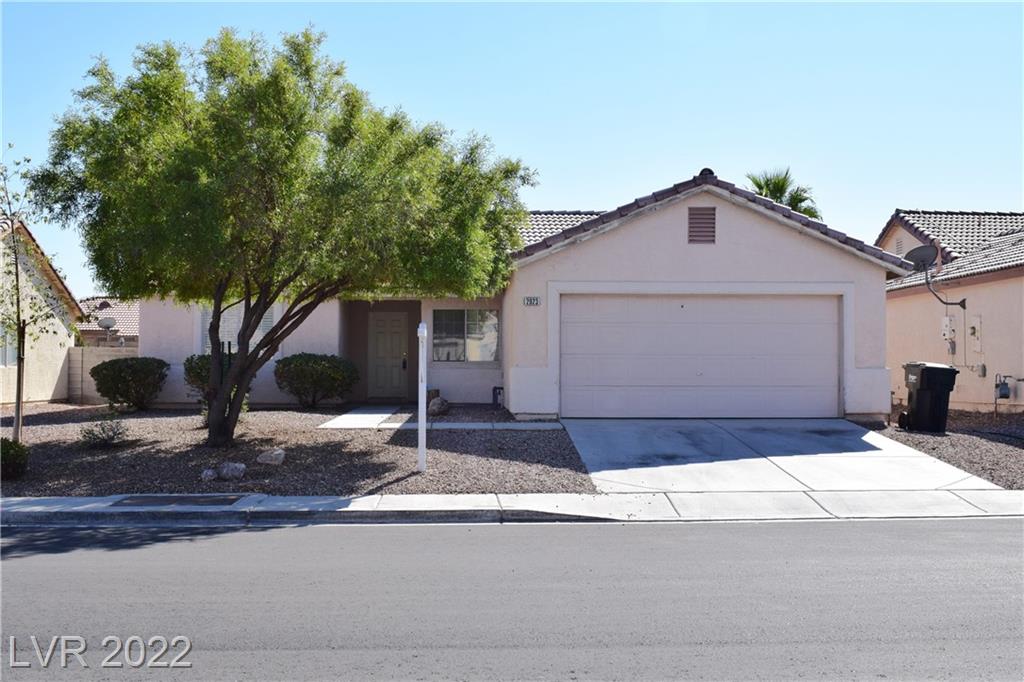
Property Summary
- SqFt: 1374
- Lot SqFt: 6098
- Beds: 4
- Baths: 2
- Stories: 1
- Garage: 2
- Year Built: 2001
- Private Pool: No
Analysis
The projection shown below is what we expect over the coming 5 years. Projections are a guess. However, we believe the projected rent and price increases are realistic based on population growth and declining land supply.
| Purchase Price | 320000 | |||||
| Rent (Mo) | 2095 | |||||
| Rent Growth Rate (%) | 8% | |||||
| Appreciation Rate (%) | 10% | |||||
| Fees (Mo) | 23 | |||||
| Insurance (Yr) | 450 | |||||
| Property Tax (Yr) | 1368 | |||||
| Management (%) | 8% | |||||
| Closing Cost Financed (%) | 2% | |||||
| Additional Closing Cost | 0 | |||||
| Closing Cost Cash | 2000 | |||||
| Loan Rate (%) | 5.75% | |||||
| Loan Term (Yrs) | 30 | |||||
| Down (%) | 25% | |||||
| Debt Service | 1307 | |||||
| Year | 0 | 1 | 2 | 3 | 4 | 5 |
| Rent (Mo) | ||||||
| Rent | 2095 | 2263 | 2444 | 2640 | 2851 | 3079 |
| Return (Financed) | ||||||
| Cash Flow Financed (Mo) | 445 | 600 | 766 | 947 | 1141 | 1351 |
| ROI Financed | 4.91% | 6.62% | 8.45% | 10.44% | 12.58% | 14.9% |
| Return (Cash) | ||||||
| Cash Flow Cash (Mo) | 1752 | 1907 | 2073 | 2254 | 2448 | 2658 |
| ROI Cash | 6.53% | 7.11% | 7.73% | 8.4% | 9.12% | 9.91% |
| Appreciation at 10% | ||||||
| Year | 1 | 2 | 3 | 4 | 5 | |
| Market Value | 320000 | 352000 | 387200 | 425920 | 468512 | 515363 |
| Equity | 96000 | 128000 | 163200 | 201920 | 244512 | 291363 |
License and Disclaimer: By choosing to use this tool and or information, you are agreeing to the terms on the license page.
Below are charts from our latest trailing 13 month market report, which includes November data. Remember that this data is only for our target property profile, not the entire metro area. To see all the charts, please click here.
|
Rental Statistics
|
Sales Statistics
|
|
Rentals – Median $/SF by Month
November rents were down from October. This is expected as we are in the slowest rental season of the year. YoY rents are up 3%.
|
Sales – Median $/SF by Month
Prices saw another slight drop from October. YoY just a tad higher.
|
|
Rentals – List to Contract Days by Month
Median time to rent is about 28 days for November, still below pre-COVID days especially considering the season.
|
Sales – List to Contract Days by Month
Median days on market increased in November. Though seasonally this is expected, we will see what the trend is after the New Year.
|
|
Rentals – Availability by Month
This chart shows the average daily number of properties that were for rent in a particular month. Interestingly November had a 10% inventory drop MoM. If this trend continues I expect the rents to start increasing after the New Year.
|
Sales – Availability by Month
This chart shows the average daily number of properties that were for sale in a particular month. We are approaching the pre-pandemic level.
|
|
Rentals – Months of Supply
Still just a little over one month of supply for our target rental property profile. Demand is still greater than supply. This will push up the rent.
|
Sales – Months of Supply
Inventory is a little over 3 months for November. 6 months supply is considered a balanced market.
|


For the last 15+ years, we’ve helped clients build highly reliable, passive income streams through real estate that they will not outlive. Several are now retired and living entirely on their rental income. Most never invested in real estate before they started working with us, and the vast majority live in other states or countries. Below is a two-minute video of the services we provide.


© 2005-2022 Cleo Li and Eric Fernwood, all rights reserved.

