

- Invest Now or Wait?
- Potential Investment Properties
- Market Trend
- About the Fernwood Real Estate Investment Group
- Schedule a discovery call with Eric Fernwood
Waiting only makes sense if property prices and or interest rates fall enough that your acquisition cost and debt service decrease significantly. Unlike the stock market and other financial instruments, rents and prices are driven by metro area supply and demand. In this article, I will show what is happening in Las Vegas and whether waiting makes sense.
Supply
Las Vegas is unique in that it is a tiny island of privately owned land in an ocean of federal land. See the 2020 aerial view below.

There is very little undeveloped private land available, and what is available in desirable areas costs more than $1 million per acre. Consequently, new homes in these areas start at $550,000.
Properties that attract our target tenant segment are priced between $320,000 and $475,000. So, no matter how many new homes are built, the housing stock we target remains almost constant. This differs from most metro areas, with virtually unlimited room for expansion. In these metros, the land is inexpensive, so new construction competes with existing properties, limiting existing properties’ rent growth and appreciation.
In summary, the property segment we are targeting has a relatively fixed supply of properties.
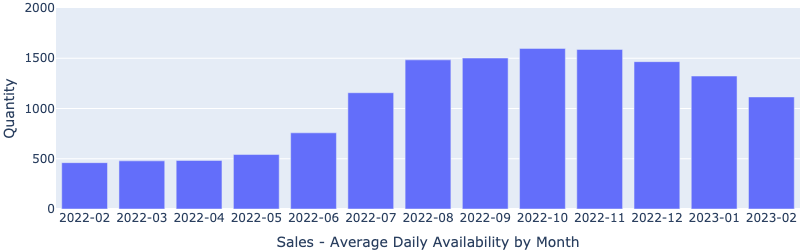
Sales – Average Daily Availability by Month
The number of homes for sale has been decreasing since October. I believe this shows sellers are holding off until more favorable market conditions, thus reducing inventory.
Will there be a flood of foreclosures coming on the market?
No.
This is not 2008.
Back then, there were 90 months of inventory, over 90% of homes were underwater, and the number of jobs plummeted, resulting in tens of thousands of unemployed people and distressed homes. Below is the number of distressed single-family homes in the metro area today (03/22/2023):
- Bank owned (REO): 29
- Short sale: 9
- Foreclosure started: 20
Also, the number of Notices of Defaults recorded each month are equally insignificant.
There will be no flood of distressed properties coming on the market.
Demand
Demand for the property segment we target remains strong. I believe prices and rents are about to increase, as evidenced by the statistics below.
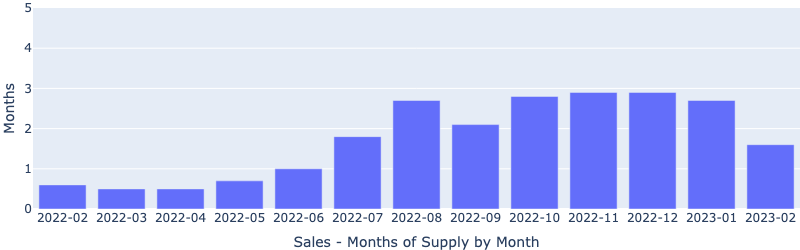
Sales – Months of Supply by Month
The inventory for the segment we target is about 1.5 months. Six months of inventory is considered a balanced market. 1.5 months of inventory is a seller’s market.
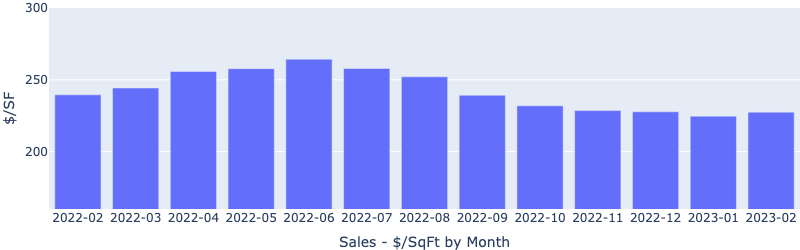
Sales – $/SqFt by Month
Below is $/SF by month, which shows prices are starting to rise. I believe this is due to the combination of limited inventory and increasing demand.
The same is true for rentals.
Rental – Average Daily Availability by Month
We have not entered the prime rental season yet (which is from the end of April through the end of July,) and inventories are already falling (rapidly).
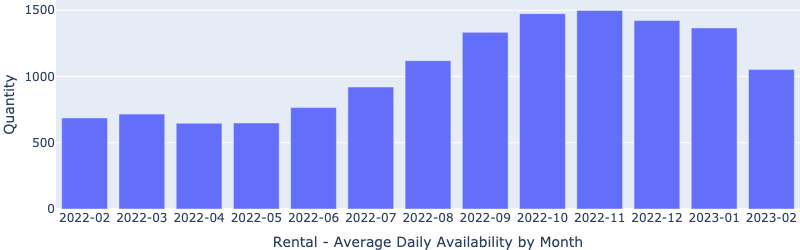
At the same time, the number of homes rented is increasing, indicating increasing rental demand.
Rental – Closing by Month
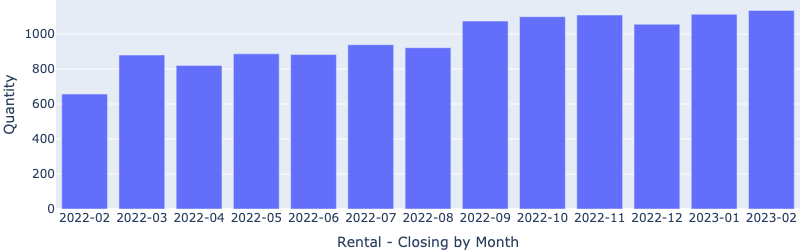
Based on what I see above I believe prices and rents are on the increase. This is further substantiated by a report in the local newspaper, stating that home sales are heating up.
Long-Term Demand
Las Vegas’ average annual population growth is between 2% and 3%. Thus, demand for housing will continue to increase, driving up prices and rents in our target segment. These are fundamentals that are unlikely to change in the foreseeable future. What is bringing so many people to Las Vegas?
Jobs.
What is the current job situation in Las Vegas?
In a study I did in January, I looked at two major job sites (Monster and Glass Door) for the number of open jobs in Las Vegas. According to these sites, there were between 26,000 and 31,000 open jobs in Las Vegas. But, it is not just about today’s jobs.
Companies are like people in that they start, mature, and then die. On average, a company only lasts about 10 years. Even S&P 500 companies only have an average life of 18 years. Therefore, almost every job people have today will disappear in the next 10 to 20 years. Unless new jobs are being created that require similar skills and pay similar wages, people will have to accept low-paying service sector jobs or move to areas where higher-paying jobs are available.
What is the future outlook for jobs in Las Vegas?
As you drive around Las Vegas, you see new construction everywhere. Depending on which study you read, there is between $18B and $26B of new construction under development. As these come online, they will create even more jobs attracting more people to Las Vegas.
Impact of Rising Prices
Because supply is fixed and demand is increasing, prices and rents will rise. This is already happening, as you saw in the statistics I showed earlier.
The table below shows how appreciation rates affect acquisition cost and debt service, assuming a 6.5% interest rate. Note that between 2013 and the start of the rapid increase in interest rates in 2022, the average annual appreciation was over 15%.
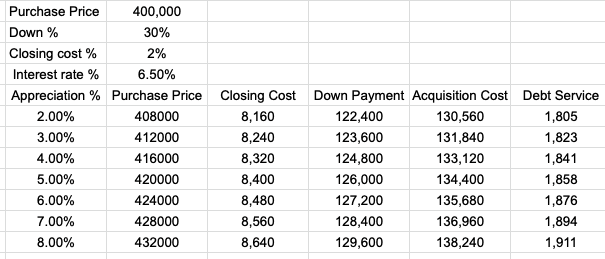
If prices increase even slightly, at today’s interest rate level, waiting will cost you more than buying today.
Impact of Rising Interest Rates
Raising interest rates increase debt service, which decreases initial return. The Fed stated it will continue increasing interest rates until inflation falls. So, I expect interest rate hikes to continue for the foreseeable future. Below is a table showing debt service for a $400,000 property at different interest rates.
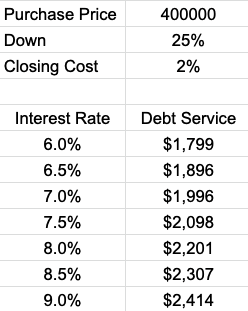
If interest rates continue to increase, waiting will cost you more than buying today.
Normalize Interest Rate
Some clients are buying down the interest rate to increase initial return. So you have some idea about the costs, below is the cost to buy down the rate as of 03/24/2023. However, the cost seems to change almost daily and differs for every lender/borrower. Use the following as an example.
- 6.500% – with 1.5 pts
- 5.99% – with 2.5 pts
For example, suppose there is a $400,000 property and the interest rate is 7.25%. With 25% down, the monthly debt service would be about $2,050/Mo. The cost to buy down the interest rate:
- To 6.5%: 1.5% x $300,000 (loan amount) = $4,500
- To 5.99%: 2.5% x $300,000 = $7,500
This money could come from seller concession, the buyer, or a combination.
Another consideration is how long it will be before interest rates decrease significantly. Suppose this occurs in two years. Is it worth spending the money upfront to buy down the loan rate?
2 Year cost at 7.25% compared to 6.5%
- 7.25%: 24 Mo x $2,050 = $49,200
- 6.5%: 24 Mo x $1,900 = $45,600
- The difference over 24 months: $3,600
A refinance typically costs about $2k-$3k. So in this particular case, you would benefit from buying down the rate upfront.
Because we don’t know what’s going to happen in the future, it is best to base your investment decision on what we do know today. And that is that you can buy down the interest rate and increase your initial return for a reasonable amount.
Waiting Will Cost More
Based on what I see today, I do not expect the price or the interest rates to fall meaningfully in the foreseeable future. On the contrary, I see factors that will push up the prices and interest rates.
My conclusion: waiting will likely cost you more than purchasing today.
Our clients plan to hold onto their real estate for the rest of their lives, so what happens in any given month or year is not that relevant. As one client put it, “Higher interest rates are reducing my cash flow by about $300 per month. I believe interest rates will be significantly lower in one or two years. Assuming two years, that means I will actually pay $3600 ($300 per month times 2 years) more for the property. On a $400,000 property, $3600 is not significant. What is significant is locking in the price and then refinancing when rates are lower in the future.”
Want to find out more? Schedule a free call with me using the link below.
• Schedule a Zoom meeting with Eric Fernwood
I promise not to try to sell you anything. If we, or Las Vegas are not a good fit for you, I will let you know. You have nothing to lose and a lot to gain.
Thanks for your time,
…Eric
As always, I welcome your comments.
Below is a link to this month’s list of candidate investment properties. Our proprietary data mining software selected these candidate properties from thousands of available properties, and this is just the first step in our multi-step validation process, as shown below.

Below are charts from our latest trailing 13-month market report, which includes February data. Remember that this data is only for our target property profile, not the entire metro area. To see all the charts, please click here.
|
Rental Statistics
|
Sales Statistics
|
|
Rentals – Median $/SF by Month
Interestingly, the rents dropped slightly amid the decreasing inventory and increasing demand. I believe this will be reversed due to the low inventory.
|
Sales – Median $/SF by Month
Prices stopped declining and started to rise in February. YoY were down 4%.
|
|
Rentals – List to Contract Days by Month
Median time to rent dropped significantly from January, indicating increasing demand.
|
Sales – List to Contract Days by Month
Median days on market continued to decrease rapidly in February, indicating buyers are back in the market.
|
|
Rentals – Availability by Month
This chart shows the average daily number of properties that were for rent in a particular month. There was a drastic drop in February, indicating falling inventory. I suspect the rents will start to increase.
|
Sales – Availability by Month
This chart shows the average daily number of properties that were for sale in a particular month. The number of homes on the market continues to drop rapidly.
|
|
Rentals – Months of Supply
There is less than one month of supply for our target rental property profile. Demand is greater than supply. This will push up the rent.
|
Sales – Months of Supply
Inventory fell sharply in Feburary to about 1.5 months. 6 months supply is considered a balanced market. This indicates a seller’s market.
|


For the last 15+ years, we’ve helped clients build highly reliable, passive income streams through real estate that they will not outlive. Several are now retired and living entirely on their rental income. Most never invested in real estate before they started working with us, and the vast majority live in other states or countries. Below is a two-minute video of the services we provide.

Want to know what we can do for you?

© 2005-2022 Cleo Li and Eric Fernwood, all rights reserved.

