
- Impending 2008 Type Market Crash!
- Potential Investment Properties
- Market Trend
- About the Fernwood Real Estate Investment Group
- Schedule a discovery call with Eric Fernwood
Impending 2008 Type Market Crash!
At least, that is what some “experts” are saying:
“The housing market resembles 2007” Fortune.com May 17, 2022
“Housing Bubble Getting Ready to Pop“, Wolf Street, May 18, 2022
“Moore: Warning signs flash on housing bubble’s impending burst“, Boston Herald, May 13, 2022
There will be significant price declines in locations where speculation and COVID, not demand, drove price and rent increases. I call such markets “declining markets” because passive income from these locations will not keep pace with inflation; you will not have the additional dollars you need to buy the same goods and services over time. If you own properties in areas that did not have at least 8% rent growth before COVID, you should consider a 1031 exchange.
What about Las Vegas?
Markets are in a bubble situation where prices are driven by speculation and not by demand. For example, in 2008, Las Vegas inventory steadily rose while prices also rose. At one point, there were 90 months of inventory. 2006 through 2008 was pure speculation and not demand-driven. This is not the situation today in Las Vegas. The increase in prices and rents in Las Vegas are due to demand, not speculation. Below are some of the reasons:
- Inventories remain very low, despite rapidly rising interest rates and prices.
- Las Vegas continues to be the destination for many people and companies fleeing the blue states.
- New home prices are well above the property segment we target. New homes in the areas we target start at $550,000. The price range we target is between $360,000 and $500,000. So, there is no dilution of the segment we target by new home construction.
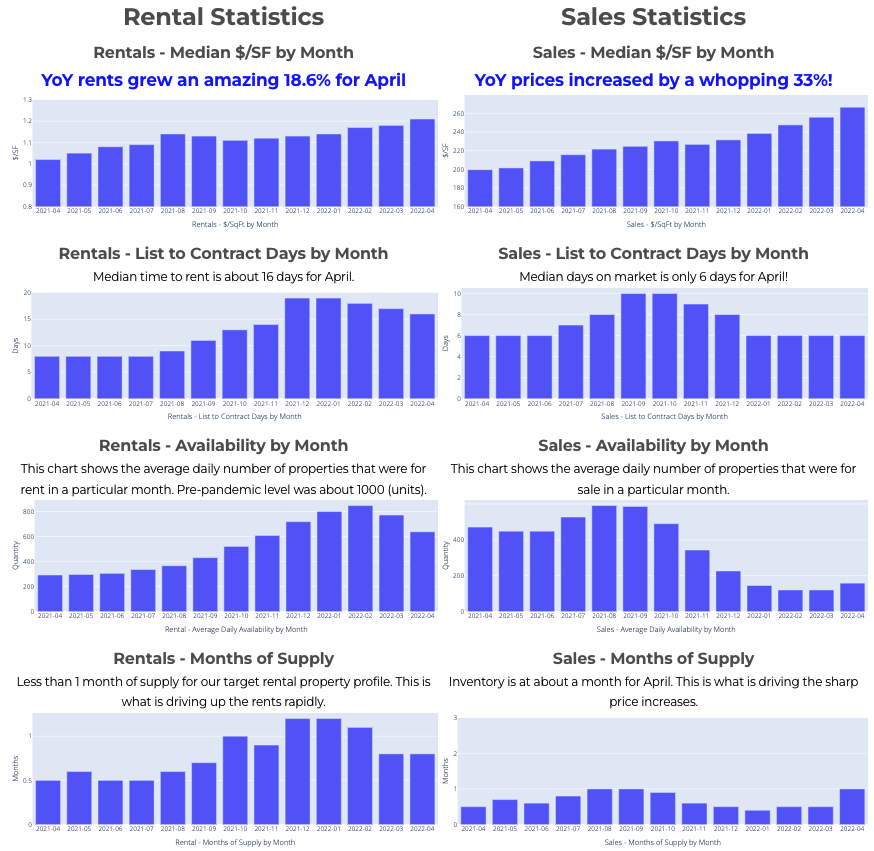
- The shortage of labor in Las Vegas is driving up wages. The availability of good-paying jobs is attracting people from other states. Below is a chart showing Clark County (Las Vegas metro area) median household income from the St. Louis Federal Reserve.

- There is currently approximately $22 billion of new construction, which will create thousands of additional jobs. Many more major projects have also been announced. So, I see no shortage of jobs in the future for all the people moving to the Las Vegas metro area. Plus, all the new jobs will attract more people to Las Vegas.
The Data
While statements are good, I prefer actual data, which you will find below.
Below is a screenshot from the MLS showing months of inventory for all property types, including condos, high-rises, single-family, townhouses, etc. (05/26/2022)

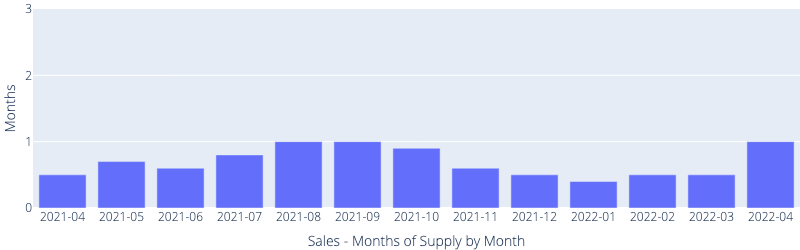
Below is a trailing 13-month chart showing months of supply by month for the segment we target. We are at 1 month of supply for April when 6 months is considered a balanced market.
Below is a chart showing the average number of properties available by day. Before the pandemic, the average daily availability was over 2,000.

The chart below shows $/SF for the past 13 months. Prices increased 33% YoY!

Below is average number of conforming rental properties by day. Before the pandemic the number was over 2000.

Below is $/SF for rental properties in the segment we target. Rents rose 18.6% YoY!

While I see some seasonal variation in the above charts, I see no significant sales or rental inventory increases.
Another “expert ” predicted a large number of foreclosures. Below is the actual single-family data on 05/26/2022. This includes all single-family properties, not just the segment we target. Unlike 2008, almost no properties in Las Vegas are underwater. So, what will probably happen, is that most will simply sell their home, bank the profit, and rent. There will be little need to go into foreclosure.
- Short sale: 14
- Bank owned properties (REO): 16
- Pre-foreclosure: 8
Another datapoint – Most properties we bid on have 5 -10 or more offers. This number is fairly consistent over the last few months. With each property getting multiple offers, we see no meaningful impact to demand due to rising interest rates; there are still a lot of well qualified buyers.
Below is a time lapse showing land consumption between 1984 through 2020. As you can see, there is not a lot of vacant land left in the Las Vegas Valley. I have never heard of a situation where there was an ever-increasing demand chasing an ever-decreasing supply, where prices did not increase.

In summary, while some locations in the country are already seeing price decreases due to their growth being COVID driven; not demand driven, due to the unique situation of the Las Vegas market, I see no indicators that the price and rent increases will stop and certainly no indicator that the prices or rents will decrease in the foreseeable future. Below are additional reference points for the dependability of our target tenant pool.
- 2008 crash – Zero decline in rent and zero vacancies.
- COVID – Almost no impact
- Eviction moratorium – No impact
- Total evictions in the last 15 year: 5
From all the data I see, Las Vegas remains an excellent investment location for dependable passive income streams and equity accumulation.
Is it still a good time to buy in Las Vegas?
I get asked this at least once a week. If you are looking for a dependable passive income stream that:
- You will not out live
- Rises faster than inflation
- Enables rapid portfolio growth through appreciation
Then select properties in Las Vegas are excellent investments. Don’t take our word for it, look at the numbers of over 400 properties that we helped our clients and ourselves to acquire. If you would like to learn more about dependable passive income streams and what we can do for you, below is a scheduling link. This is a no obligation opportunity to talk to me about your situation and goals. I promise you that if we or Las Vegas does not make sense, I will tell you. It makes no sense for either of us to invest time and effort if there is not a good match.
Thank you for your time,
…Eric
Below is a link to this month’s list of candidate investment properties. Our proprietary data mining software selected these candidate properties from thousands of available properties, and this is just the first step in our multi-step validation process, as shown below.

Note: Due to the rapid increase in interest rates, first-year returns are low. However, the return increases significantly even at an 8% rent increase after the first year. See the table below. The example is a property with a $2,100/Mo first-year rent and a -.07% return. As you can see, return increases rapidly even with an 8% annual rent increase. The typical rent increase range is 8% to 12%.
| Purchase Year | 1 | 2 | 3 | 4 | 5 |
|---|---|---|---|---|---|
| Rent Growth at 8% | 2100 | 2268 | 2449 | 2645 | 2857 |
| Cash Flow (Mo) | -68 | 100 | 281 | 477 | 689 |
| ROI | -0.7% | 1.0% | 2.8% | 4.7% | 6.8% |
Below are charts from our latest trailing 13 month market report, which includes April data. Remember that this data is only for the property profile that we target, not for the entire metro area. To see all the charts please click here.
For the last 15+ years, we’ve helped clients build highly reliable, passive income streams through real estate that they will not outlive. Several are now retired and living entirely on their rental income. Most never invested in real estate before they started working with us, and the vast majority live in other states or countries. Below is a two-minute video of the services we provide.


© Cleo Li and Eric Fernwood, all rights reserved.

