

- How to Thrive in These Uncertain Times
- Potential Investment Properties
- Market Trend
- About the Fernwood Real Estate Investment Group
- Schedule a discovery Zoom meeting with Eric Fernwood
How to Thrive in These Uncertain Times
04/20/2022 by Eric Fernwood
There is an ancient Chinese curse, “May you live in interesting times.”
Mortgage rates are at 5%, inflation is at 8.5% and rising, CDs and fixed-rate instruments are paying below 2%, the stock market is turbulent, another wave of COVID is looming, and a potential war with Russia is on the horizon.
I think this meets the definition of “interesting times.”
How do you navigate such uncertain times? There is a historical safe haven for your money; real estate. However, not just any real estate will do. Only select real estate in high appreciation locations will enable you to maximize your investment in the current financial and economic situation.
Location Location Location
The most important investment decision you will make is the location, not the property. And by location I mean the real estate market, not that corner lot. The location determines:
- Whether your rental income will rise fast enough to offset inflation to maintain (or improve) your standard of living.
- If the passive income stream will last as long as you live.
- The total capital required to acquire multiple properties to reach your passive income goals.
Why Is Now a Golden Opportunity
Whether this is a golden opportunity depends on your goals. If your goals are:
- Rapidly growing your invested capital.
- A reliable passive income stream that increases faster than inflation, and you will not outlive.
- Growing your total passive income stream with the least capital investment.
If these are your goals, now is the time, and Las Vegas is the right place. I will show why.
Let’s first look at capital needed to achieve your goals.
For example, suppose you want a $10,000/Mo. (present value) income stream. And each property costs $500,000 and generates $500/Mo. with a 25% down payment. Also, your marginal tax rate is 40%. If this is the case, you will need to earn $210,000 pre-tax to have the down payment of $125,000. See the image below.

When you are ready to buy your second property, you will still need to use post-tax dollars plus accumulated cash flow (rent) for the downpayment. See the image below.

Total after tax cash required to purchase two properties: $250,000.
The point is that a lot of post-tax capital is required for the down payment. What if you invested in Las Vegas today and took advantage of the rapid appreciation? For your first property, the post-tax cash is the same.
What about your second property? Depending on the appreciation rate and how long you waited between cash-out refis, no additional capital may be needed.

And the 3rd and 4th property? Refinancing each property every few years to obtain cash to buy the next property has a snowball effect. I illustrated the snow ball effect below assuming that you could refinance every three years. Of course, this is over simplified but the concept of repurposing equity is valid.

How does this snowball effect work over time, assuming you refinance every three years? See the table below. Remember that cash-out refinancing is not taxed. Your properties work for you by generating tax-free capital through refinancing. The snow ball effect enables you to expand your portfolio with comparatively little additional capital. I did this last year doing a refi on a townhouse I purchased. Here is a case study on that property.

Obviously, all of the above only works if there is significant appreciation. What is the appreciation rate for Las Vegas? Below is a chart showing $/SF appreciation since 2013 for our property profile. In 2021, the appreciation was 32%!
Appreciation 2013 through 2021 – median $/SF

Can the appreciation continue? I believe so. I explained why in our March 2022 Market Report. For here, I would like to just point out the current inventory situation. Below is the 13-month chart showing inventory for our target market segment. As inventory levels fell, prices rose. A classic demand driven market.

What about the overall Las Vegas market? Total inventory is declining as well.
Inventories continue to fall, despite rising interest rates and prices! For every property we offer on, we compete with 10 or so strong offers. There are far more qualified buyers than properties available for sale. So, for the foreseeable future, I believe prices will continue to rise.
Initial Return and High Interest Rates
The impact of rapidly rising interest rates is a lower initial return. Below is the initial return we are seeing for a typical property assuming 5% interest rate and 25% down. Click here for the details on the example property.
Property Assumptions

Return with Various Down Payments

In this example, with 20% down, initial return is negative (-1.2%). At 25% down, initial return is 0.2%. What happens if you purchase a property with an initial negative return? The answer is rent growth.
Rent growth in 2021 was 18%. During the last 12 months the increase was 20%. However, it is not realistic to increase the rent on your tenant by 18% or 20% in a single year. However, 8% to 12% is very reasonable. Below is a table showing annual return vs. 8%, 10% and 12% annual rent increase.
Monthly Rent at Various Rent Growth Rates

As you can see, even at only 8% rent growth, the property is profitable after the first year. And, even at 8% rent growth, after 5 years return rises to 9%.
A question I occasionally received is what will happen to rents if there is a financial crash? The best indicator of income reliability is performance during past financial crisis. For our target tenant pool:
- 2008 crash – Zero decline in rent and zero vacancies.
- COVID – Almost no impact (10 or so tenants affected out of 300+ properties)
- Eviction moratorium – No impact
- Average tenant stay: 5 years
- Evictions: 5 over the last 15 years
So, while no one can predict the future, our tenant pool has proven to be highly reliable in good times and bad.
Summary
The high appreciation rate in Las Vegas market is a golden opportunity to acquire properties that will create a highly reliable passive income stream and enable you grow your portfolio with the least capital required.
Time is of the essence – The higher interest rates rise, the lower the initial return so the longer you wait, the lower the initial return. Also, with the rapid appreciation, prices are rising rapidly so it will cost more the longer you wait.
Below is a link to this month’s list of candidate investment properties. Our proprietary data mining software selected these candidate properties from thousands of available properties, and this is just the first step in our multi-step validation process, as shown below.

Note: Due to the rapid increase in interest rates, first-year returns are low. However, the return increases significantly even at an 8% rent increase after the first year. See the table below. The example is a property with a $2,100/Mo first-year rent and a -.07% return. As you can see, return increases rapidly even with an 8% annual rent increase. The typical rent increase range is 8% to 12%.
| Purchase Year | 1 | 2 | 3 | 4 | 5 |
|---|---|---|---|---|---|
| Rent Growth at 8% | 2100 | 2268 | 2449 | 2645 | 2857 |
| Cash Flow (Mo) | -68 | 100 | 281 | 477 | 689 |
| ROI | -0.7% | 1.0% | 2.8% | 4.7% | 6.8% |
Below are charts from our latest trailing 13 month market report, which includes March data. Remember that this data is only for the property profile that we target, not for the entire metro area. To see all the charts please click here.
|
Rental Statistics
|
Sales Statistics
|
|
Rentals – Median $/SF by Month
YoY rents grew an amazing 18.2% for March
|
Sales – Median $/SF by Month
YoY prices increased by a whopping 29.6%!
|
|
Rentals – List to Contract Days by Month
Median time to rent is about 18 days for March.
|
Sales – List to Contract Days by Month
Median days on market is only 5 days for March!
|
|
Rentals – Availability by Month
This chart shows the average daily number of properties that were for rent in a particular month. Pre-pandemic level was about 1000 (units).
|
Sales – Availability by Month
This chart shows the average daily number of properties that were for sale in a particular month.
|
|
Rentals – Months of Supply
Less than 1 month of supply for our target rental property profile. This is what is driving up the rents rapidly.
|
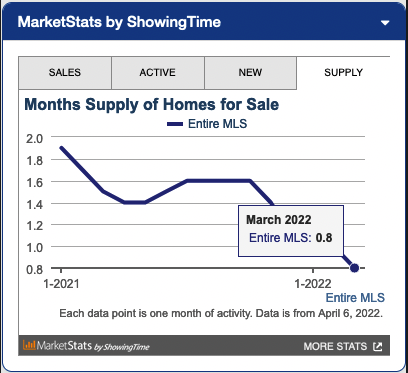
Sales – Months of Supply
Inventory stays at less than a month. This is what is driving the sharp price increases.
|


For the last 15+ years, we’ve helped clients build highly reliable, passive income streams through real estate that they will not outlive. Several are now retired and living entirely on their rental income. Most never invested in real estate before they started working with us, and the vast majority live in other states or countries. Below is a two-minute video of the services we provide.


© Cleo Li and Eric Fernwood, all rights reserved.

