In This Report
- My Favorite Tools for Analyzing Which Market to Invest In
- Potential Investment Properties
- Market Trends
- About the Fernwood Real Estate Investment Group
My Favorite Tools for Analyzing Which Market to Invest In
Choosing the right market to invest in is your most important investment decision. The location determines all long-term income characteristics essential for achieving and maintaining financial freedom. The characteristics defined by the location include:
- Total capital required: If you can grow your portfolio using accumulated equity by cash-out refinancing, which is only possible in areas with high appreciation, you’ll need considerably less capital from your savings.
- Inflation protection: Whether rents outpace inflation, enabling you to sustain your lifestyle indefinitely, only occurs in cities with significant and sustained population growth.
- Income persistence: How long your income will last. This is dependent on the city’s long-term economic growth.
- Natural disaster risk: Certain locations are more prone to natural disasters, such as hurricanes, tornadoes, earthquakes, fires, and floods. Although insurance may cover the rebuilding of your property, it could be vacant for months or years until the community recovers and people return.
- Operating costs: Every dollar lost to property taxes, and insurance is a dollar less for you to live on.
- Rent control: Government control of your rental property can transform a promising investment into a nightmare.
Fortunately, good location data is available, and the location selection process is straightforward.
Location Selection Process and Tools
There are two primary methods for choosing a good investment city. The first is to analyze all possible cities in the US and select the best. However, this approach could lead to evaluating thousands of cities, which is impractical due to the time required and insufficient data for smaller cities.
The second method is to eliminate all cities that are unlikely to be good investment locations, and the remaining few are worthy of further investigation. This method is straightforward and practical.
The process starts with an initial list of candidate cities. Start with cities with a metro population of >1M if you want long-term, reliable income. Smaller cities may rely too much on a single business or market segment. Source: Wikipedia
From this initial list, eliminate cities that do not meet the following additional requirements.
- Minimize total capital required (to achieve financial freedom): To replace your current income, you’ll need to buy multiple properties. The capital needed from your savings will depend on the location’s appreciation rate. In low appreciation areas, you’ll need to cover the cost of purchasing multiple properties entirely from your savings. However, in cities with higher appreciation rates, you can leverage the accumulated equity to buy additional properties via cash-out refinancing. Therefore, you’ll need less capital in rapidly appreciating cities than in lower-cost locations. Never buy in slow-appreciating cities. Source: FHFA House Price Index
- Inflation protection: The only way to maintain your purchasing power and living standard is if your rents increase faster than inflation. Prices drive rents. Where prices are higher, fewer people can buy, so they are forced to rent. This increases demand for rental properties, which drives up rent. Where prices are low, more people can afford to buy, so fewer people rent. Where prices are low, rents increase slowly, so you will not have the money to pay inflated prices. Only buy in cities with significant and sustained population growth. Never invest in any location with a static or declining population. Source: Wikipedia
- Income persistence: Financial freedom requires an income you will not outlive. Your income depends on your tenants staying employed throughout your lifetime at similar wages. However, all non-government jobs are short-lived. The average company lasts ten years, and even an S&P 500 company has an average lifespan of 18 years (and falling). So, every non-government job your tenants have will vanish in the foreseeable future. The only way your tenants can continue to pay the rent is if new jobs are created that pay similar wages and require similar skills. For replacement jobs to be created, companies must choose to set up new operations in the city. Companies have a lot of flexibility and are unlikely to create new operations in any city with high crime levels. Never invest in any city on this list: Mapped: The Most Dangerous Cities in the U.S.
- Low natural disaster risk: A natural disaster can be a financial disaster for you. The issue isn’t your property. Insurance will cover the cost of rebuilding. The problem is the community. Jobs, stores, roads, healthcare services, and gas stations can all be destroyed in a disaster, as is often shown in the news. With the community destroyed, your tenant has no choice but to move somewhere they can live and work today. It could take years to rebuild the community, and it may never recover in many instances. Meanwhile, debt service, taxes, insurance, maintenance, and other expenses continue without pause. The relative cost of homeowners insurance is the best indication of a high-risk location. Source: Insurance – ValuePenguin
- No rent control: Some states and metro areas have implemented various kinds of rent control. Rent control may prevent you from increasing the rent fast enough to keep pace with inflation, limit your ability to select a reliable tenant, and make evictions of non-performing tenants difficult or impossible. Never invest in any city with rent control. Source: Google search.
- Low operating costs: It’s not about how much you gross. It’s about how much you net. Every dollar lost to operating costs means one less dollar for you to live on. The two most significant operating costs for investors are property taxes and insurance. Operating costs vary significantly by state; only invest in states with low operating costs. Source: Insurance – ValuePenguin, State Property Tax Rates – Rocket Mortgage.
In summary, you began with cities with a metro population greater than one million and removed any that did not meet the additional criteria. The outcome is a short list of cities, all potentially good investment locations.
Select a city with an experienced investment team to narrow the list of cities further. Everything you learn from podcasts, books, seminars, and websites is general knowledge. But you will buy a specific property in a specific city, subject to local rules and regulations. The only source for the local knowledge you need is an investment team.
Summary
Choosing the right market is your most critical decision, not the property. You can only generate the income required for lifelong financial freedom by selecting a location that meets all the above requirements. If you invest in the wrong location(s), no matter how many properties you purchase, you won’t have lifelong financial freedom.
Potential Investment Properties
Below is a link to this month’s list of candidate investment properties. Our proprietary data mining software selected these candidate properties from thousands of available properties, and this is just the first step in our multi-step validation process, as shown below.

This Month’s List of Candidate Properties
Market Trend
Below are charts from our latest trailing 13-month market report, which includes April data. Remember that this data is only for our target property profile, not the entire metro area. To see all the charts, please click here.
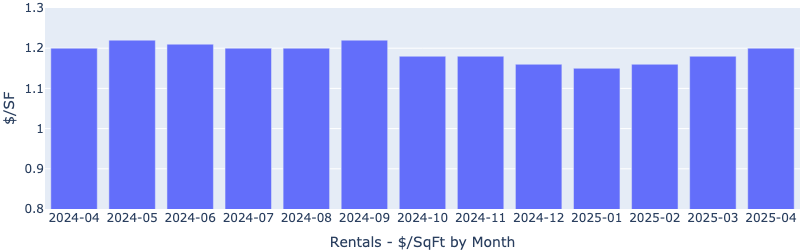
Rentals – Median $/SF by Month
$/SF remained unchanged from March, now at the highest level in the last 13 months. YoY is up 3.4%.
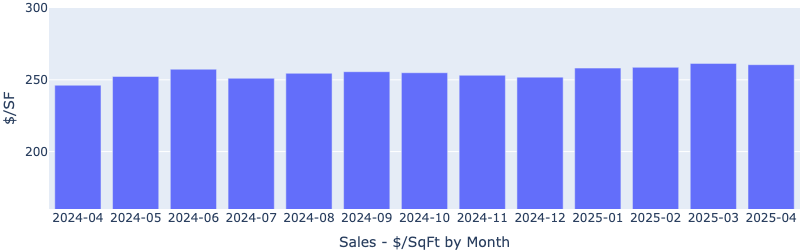
Sales – Median $/SF by Month
Despite persistently high interest rates, the $/SF continued to climb, up 7.8% Year over Year.
Rentals – Median Time to Rent by Month
Median time to rent continued to fall, now below 20 days, showing a heating up rental market. YoY is down 9.5%.
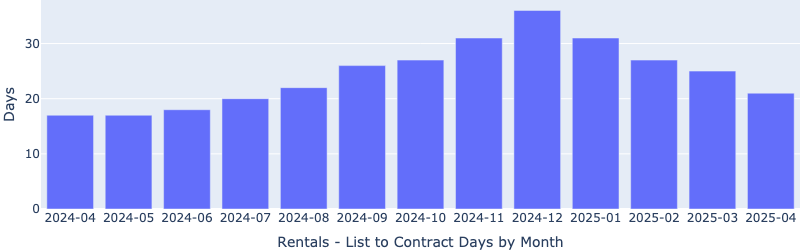
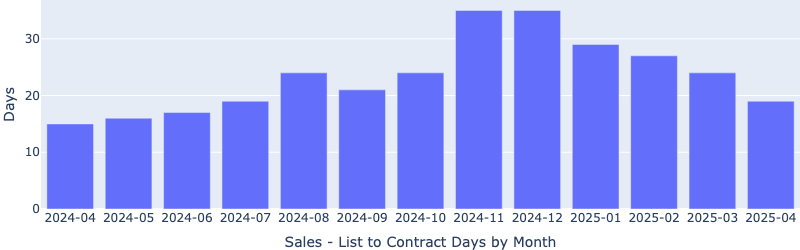
Sales – List to Contract Days by Month
Median days on the market continued to drop, showing a heating-up market. YoY is down more than 17.6%.
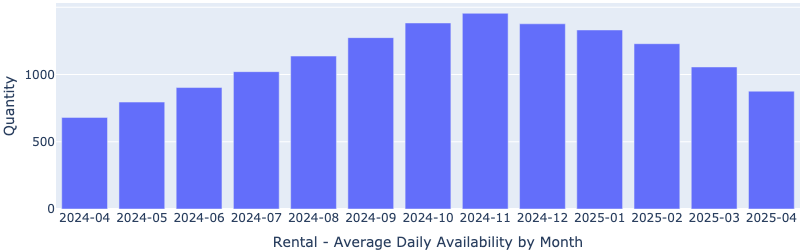
Rentals – Availability by Month
The number of homes for rent continued the downward trend. YoY is down 5.5%.
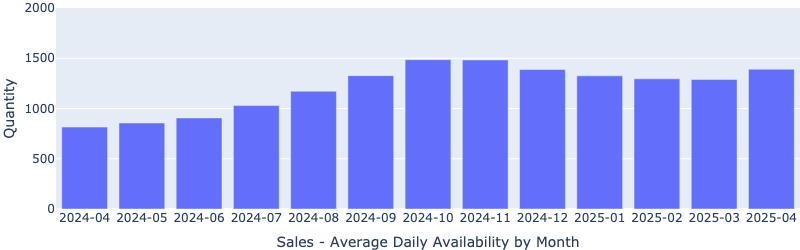
Sales – Availability by Month
This chart shows the average daily number of properties for sale in a particular month. YoY is down 35%!
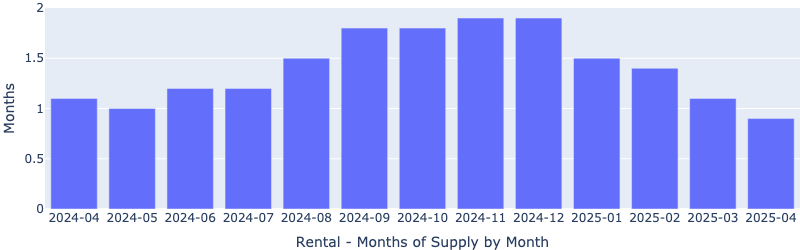
Rentals – Months of Supply
Only about 0.8 months of supply for our target rental property profile. YoY is down 33%! Demand is greater than supply. This will pressure up the rents.
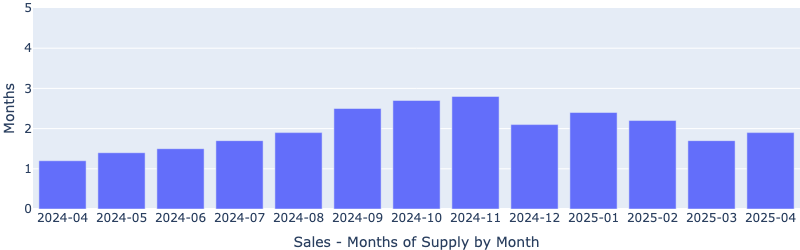
Sales – Months of Supply
There are just 0.5 months of supply for our target property profile. YoY is down 58.3%! A 6 months supply is considered a balanced market. This will continue to drive up the prices.
About the Fernwood Real Estate Investment Group
We Help Clients Acquire Highly Reliable Passive Income Streams
Here is what some of our clients have to say about us:
For the last 16+ years, we’ve helped clients build highly reliable, passive income streams through real estate that they will not outlive. Several are now retired and living entirely on their rental income. Most never invested in real estate before they started working with us, and most live in other states or countries. Below is a two-minute video of the services we provide.

Want to know what we can do for you?
© 2005-2024 Cleo Li and Eric Fernwood, all rights reserved.