- Market Update + Water Supply
- Potential Investment Properties
- Market Trend
- About the Fernwood Real Estate Investment Group
- Schedule a discovery call with Eric Fernwood
Market Update + Water Supply
In this month’s article, I will talk about the two most frequent questions I receive lately: the current investment market condition and Las Vegas’ water supply situation.
Investment Market Update
“Experts” frequently publish articles with clickbait titles like “Las Vegas Housing Just CRASHED.” Before I show you what is happening in the market, I want to show you an error I frequently see. The error consists of combining dissimilar property types and representing this average as meaningful. I will show you why this approach fails using the table below.

The price of all $300,000 properties increased by 5%, and the million-dollar property decreased by 10%. The error is combining the sales data for $300,000 and $1,000,000 properties and taking an average. The demographic of people who buy million-dollar homes differ from those who buy $300,000 homes. So, it is possible to have a high demand for $300,000 properties while having little demand for million-dollar homes. The above is an example showing the effect of a million-dollar home declining in price while three $300,000 homes increase in price. Do not mix apples and oranges.
Using the ever-popular (but invalid) method of averaging prices of all property types, we can see that property prices have fallen by about 3%. In reality, million-dollar home prices fell by 10%, and $300,000 home prices increased by 5%. This is an example of why statistics can be very misleading if you average apples and oranges. These types of statistical misrepresentations are how clickbait headlines are justified.
Current Market Update
As you may know, we’ve targeted the same tenant pool for the last 15 years. Over that time, the prices of properties that this tenant pool is willing and able to rent have increased. Today, most conforming properties cost between $350,000 and $500,000. What happens to high rises, million-dollar homes, multi-family, condos, and properties above or below what our tenant pool will rent is irrelevant to you or me. Because of our property focus, we’ve generated statistics for our target segment for many years. Below are some of the latest statistics. To see all the latest statistics, please see this page.
Rental Months of Supply
In July, there was a small increase in average daily availability (units). However, there was still only one month of supply. Demand is still greater than supply. Pre-Covid, it was 2-3 months. The increase is consistent with historical seasonal trends. School starts in mid-August, and few parents move right before school starts.

Rentals $/SqFt
There is virtually no change between June and July. I expect a small decrease in August due to fewer people moving.
Rentals List to Contract Days
As you can see, in July, the median days on the market increased from 15 to 17 days. Pre-Covid, our segment’s median time to rent was about 30 days. So you could say that the market has cooled some. But it’s like being in a room where it was 150°, and the temperature drops to 130°, it’s still hot. So, we do not see any change inconsistent with past seasonal trends.
Rentals Closings by Month
More homes were rented in July than in June. However, I expect the number of closings to drop in August due to school starting back up.
In summary, I see no changes in the rental market beyond normal seasonal changes. What about sales?
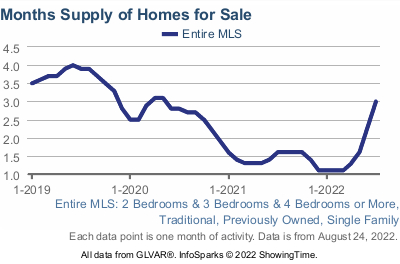
Sales Months of Supply
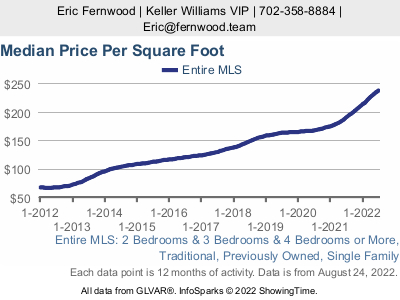
As you can see, the months of supply increased in May, June, and July. The increased inventory is primarily due to a shrinking pool of buyers, as evidenced in the Sales – Closings by Month chart, and an increased number of sellers, as evidenced in the Sales – Availability by Month chart. As a result, we are finding better deals and value for our clients. However, I believe this opportunity may be short-lived because I do not see any changes to the factors that drive the Las Vegas market. More on that is below. I expect that once the current inventory has been absorbed, the market will go back to the pre-Covid pattern, which will be 2-3 months of supply and an annual appreciation of 7-10% (the MLS chart below actually showed an average annual appreciation of 12.1% between Jan 2012 and Jan 2020).

What baffles me is that the MLS shows about three months of supply for single-family homes priced between $350,000 – $500,000 for the entire MLS (see the chart below). But our specific segment is showing six months. I could have some corrupted data sets, but my trouble-shooting effort did not point to any errors. So, for now, I will assume that our target property segment had a modest increase in inventory in July.

Sales – Availability by Month
The average daily available number of conforming properties increased from 338 to 799. I do not understand why these sellers did not put their homes on the market in March or April when there were only 0.5 months of supply, and they could sell their homes in days with multiple above-list offers. They chose to put their homes on the market in late July when there were signs of the market cooling and school starting. Perhaps they (or their realtors) listened to those “experts” who proclaimed “the market is crashing” and panicked. Mistake for them, but an excellent opportunity for investors;)
Sales – Median $/SF by Month
As the buyer pool shrank, the median $/SF decreased slightly month-over-month but still logged a 28% YoY growth!
Sales – List to Contract Days by Month
The median days on market increased to 16 days in July, not surprising due to the increased inventory. Yes, it has increased compared to the 6-7 days during the Covid housing frenzy. But 16 days is still very reasonable, indicating a more rational market. I expect to see some good deals. Not a lot, but some.
Sales – Closings by Month
We had a small increase in closings in July. I am surprised at the increase. I expect closings to decline in August.
So, is the Las Vegas market crashing? No. I am not seeing any concerning changes in our target property segment. I do not track million-dollar homes, high-rises, condos, multi-family, or other property types, so I have no comment on these segments. As a side note, I run the data mining software daily to look for properties. The initial hit count (before the data mining software filters the properties) has been remarkably constant over the past 3-4 weeks. It indicates a stabilizing inventory (number of units) for our segment.
Las Vegas Market Drivers
Below are factors that will continue to drive the Las Vegas market growth, including appreciation and rent growth.
-
Why businesses choose Las Vegas –
- Pro-business government – The regulatory environment is a big factor when companies and businesses are looking to set up new facilities. I believe this has a lot to do with the booming Las Vegas professional sports sector.
- Low operating cost – No state income taxes, a pro-business environment, low property taxes, and low energy costs will continue to attract companies to Las Vegas.
- Low commercial energy cost – California: $0.18/KwH, Nevada: $0.046/KwH. Also, Las Vegas is one of the few cities in the US with dual electric power sources, critical for servers and electricity-dependent industries like data centers and Internet switching.
- Data bandwidth – The fiber optic bundle connecting Southern California to the East Coast runs under Las Vegas Boulevard. This is another reason Google is building a $1.2B data center here. Also, Google announced that they would launch a “first-of-its-kind, next-generation” geothermal project in Las Vegas.
- Location – Las Vegas is within 16 hours driving time to 20% of the US population.
-
Job Growth – A rental property is no better than the jobs around it. Over $22B is currently under construction and more announced, which will create thousands of new well-paying jobs. I checked a few employment sites, and there are >26,000 job openings today. There is currently a labor shortage – thousands of job postings in the resort industry alone are waiting to be filled, let alone all the “Hiring” or “Help wanted” signs up at almost all small businesses. All these new jobs will bring thousands of people to Las Vegas and continue to drive up prices and rents.
-
Population growth – The population continues to grow at a sustainable rate of about 2.5% to 3% per year. Below is a study from UNLV’s Center for Business and Economic Research showing the projected population growth.

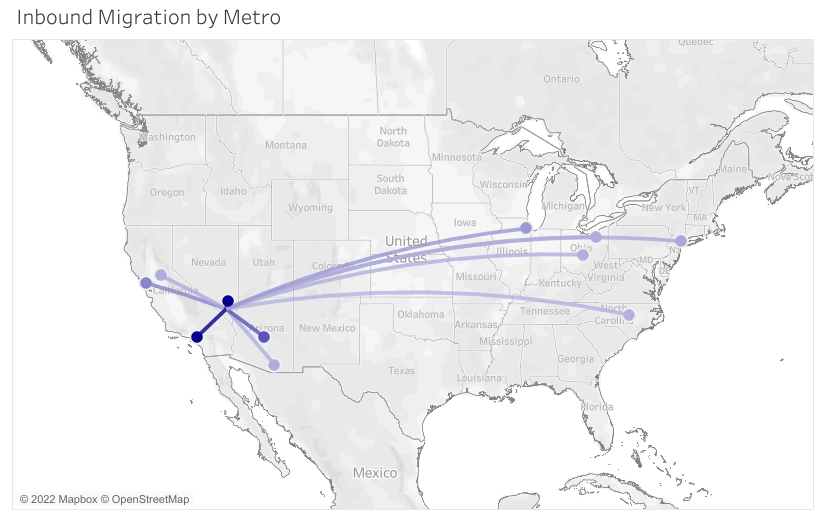
The map below shows where people are migrating from. (from Rent.com)

-
California exodus– California seems to be doing all it can to drive people and companies out of the state. The proximity to California, especially LA, ensures that Las Vegas will continue to gain population and businesses.
-
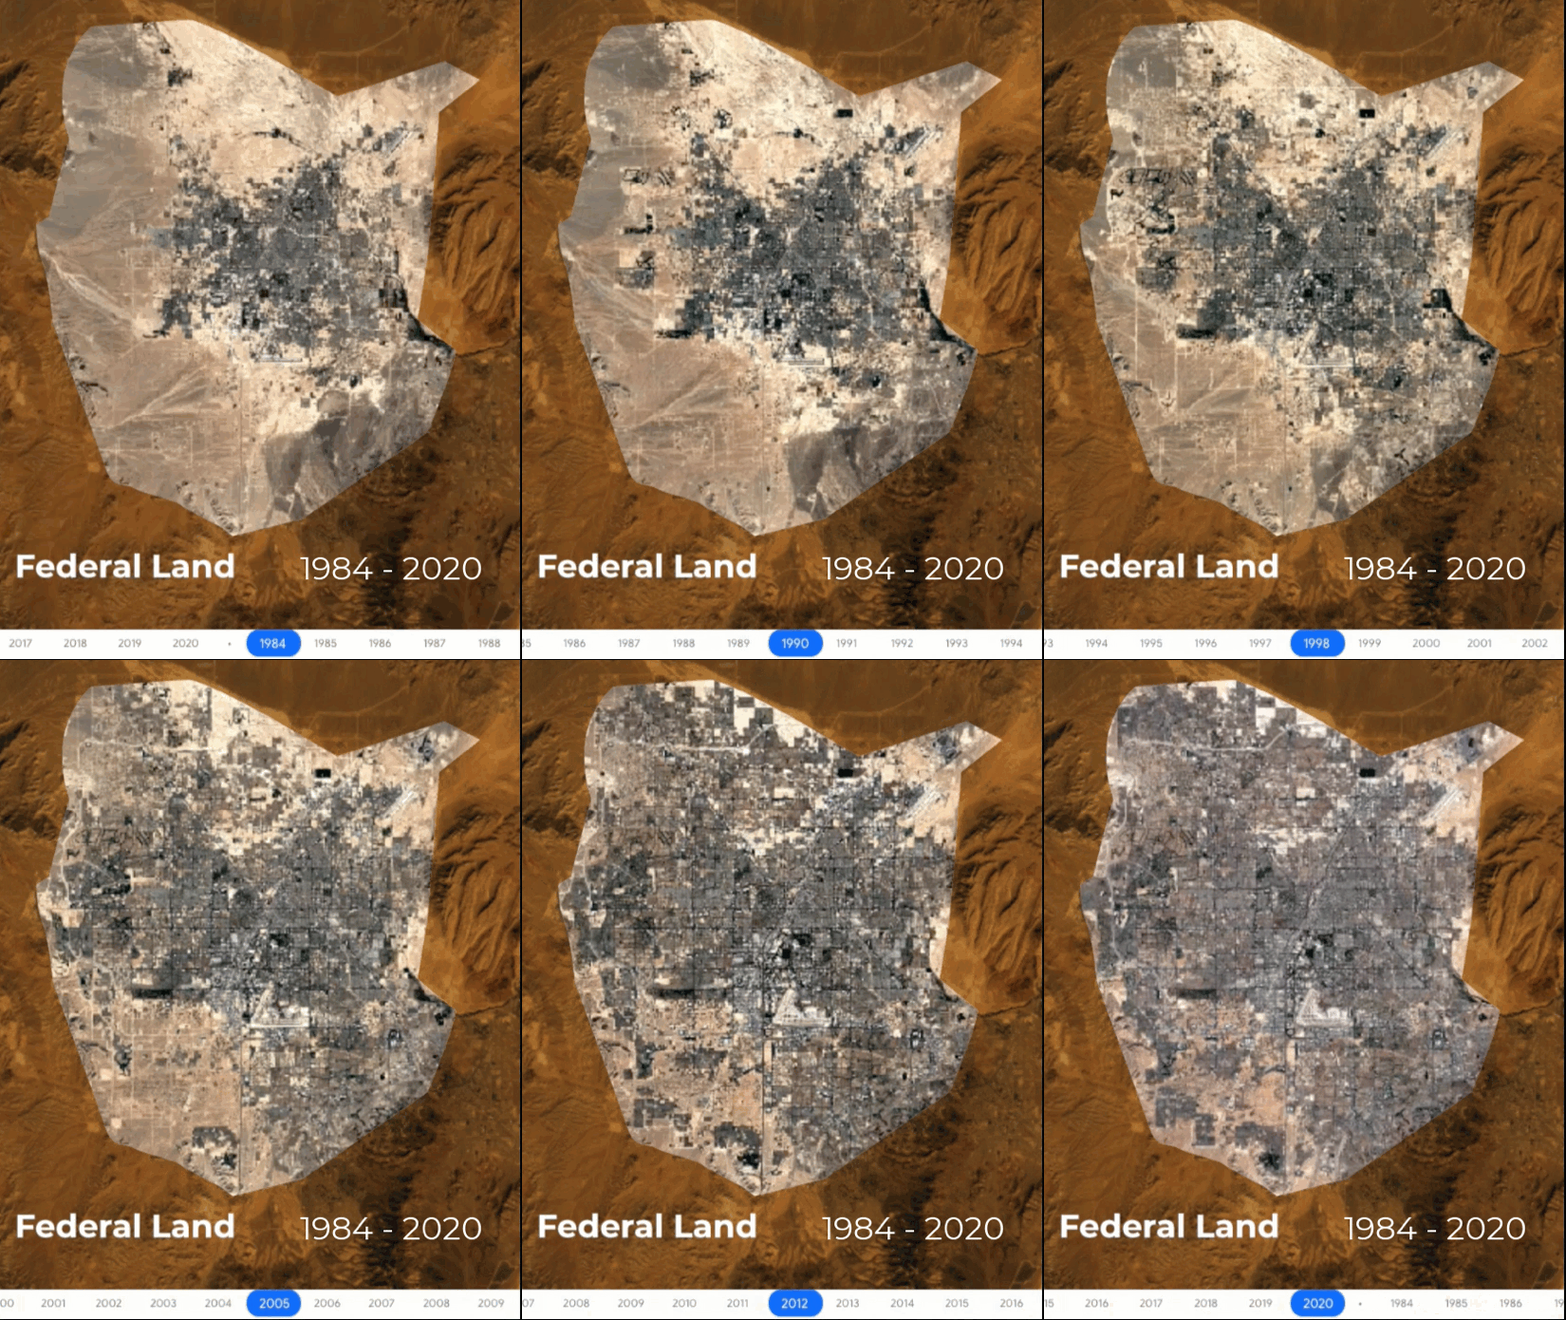
Land shortage – Las Vegas is an island surrounded by federal land. At the end of 2019, the amount of vacant buildable land in the Las Vegas Valley was less than 28,000 acres, of which 5,000 to 7,000 acres are not viable for residential development. (87.5% of Clark County is federally owned. 85% of the entire state is federally owned.) Consumption rate is about 5,000 acres/year. See the animated GIF below. The areas in brown are federal land. The time-lapse only goes through 2020, and there has been a large amount of development since then. The shortage of land combined with the increasing population almost guarantees property prices and rent will continue to increase.

In summary, I do not see any changes to the Las Vegas market drivers. This is why I expect the current increased level of (housing) inventory to be temporary and will go back down to the pre-Covid level. When I run the Investor Tool each morning for the last week, I already see fewer conforming properties than a few weeks ago. However, I will not know whether this is a blip or a trend for a few weeks.
Knock-On Effect
As prices and interest rates rise, fewer people can afford to purchase homes. Their only alternative is to rent. Historically, increasing prices and high-interest rates increased rents and rental demand. The Fed will continue increasing interest rates until inflation returns to target levels. Increasing interest rates reduces initial returns but will increase rents. Rents increase because fewer people qualify to purchase homes and are forced to rent. Also, the reduced number of closings will reduce the rental property inventory at a time when there will be more people looking to rent. None of this will happen overnight, but we will see the shift in the next few months.
Income Reliability
With the combination of land shortage and increasing population, I believe demand for housing will continue to rise. The result will be increasing rents and prices. What if there is a recession? While past performance is not a guarantee of future performance, it is our best indicator. See below for specifics on how our client’s properties performed in adverse economic times. (Note that most other property segments were hurt during these events.)
- 2008 crash – Zero decline in rent and zero vacancies.
- COVID – Almost no impact
- Eviction moratorium – No impact
While nothing is guaranteed; unless something unexpected happens that is much worse than the 2008 crash or COVID, Las Vegas investors will do very well for the foreseeable future.
Las Vegas Water Supply
I am regularly asked about whether Las Vegas is running out of water. Is Las Vegas’ water supply secure in the short term? Yes. Below is a quote from this article
But Las Vegas’ water won’t be affected. The water authority wisely built an intake valve into the bottom of the lake years ago. If you don’t believe my optimism, take it from John Entsminger, the SNWA’s [Southern Nevada Water Authority] general manager. He called Las Vegas “the most water-secure municipal area in the Colorado River Basin.”
However, if the water level falls significantly lower, the Hoover dam will not generate as much electricity as today. Fortunately, Las Vegas is one of the only major cities in the US with dual electric power sources: Hoover Dam and California. However, I suspect our utility bills may increase if we buy more power from California.
What is the long-term water situation? Below is an article I wrote on the water situation.
Around 1890, research showed that the water supply would limit the LA population to about 400,000. Everyone agreed; end of the story. Then William Mulholland, head of the LA water district, proposed building the Los Angeles Aqueduct. A 233-mile-long system to move water from Owens Valley to the San Fernando Valley. Today, the Los Angeles Aqueduct supplies a lot of LA’s water.
About 15 years ago, a study estimated the cost to build a pipe from Las Vegas to a location in Northern Nevada where there is sufficient water at about $2B. However, whether the cost is $2B, $4B, or $20B does not matter. The Resorts World Casino alone cost over $7B to build. No one will shut down a trillion-dollar business (Las Vegas) for a few billion dollars.
One of our clients works for the local water company. I asked him about water usage in the Las Vegas valley and learned that about 80% of the total water consumed is for irrigation in private homes, mostly watering grass. When the water situation gets sufficiently dire, the water company will increase prices, and the lawns will disappear. Grass in the Mojave Desert makes no sense.
What do others think? We have a lot of major projects under construction in Las Vegas; the total is over $22B. All these companies did their homework on the water supply and other potential issues before committing so much money. I trust their research.
In summary, Las Vegas’ water supply is secure for the foreseeable future. Long term, the water need will be met. How it will be met will be resolved in the future.
Summary
Water is still coming out of the faucets and will for the foreseeable future. The Las Vegas investment market is not crashing but is taking a short breather. We believe the breather will be short because the fundamentals driving the Las Vegas market (land shortage, plentiful jobs, population growth, etc.) have not changed. Now is a window of opportunity to take advantage of this breather before it ends. Also, on 08/26/2022, Federal Reserve Chair Jerome Powell announced that more steep interest rate hikes were coming. So, waiting will cost you.
If you want to learn more about our processes that have delivered consistent performances, check out our training videos.
Thank you for your time. And, as aways, I welcome your feedback.
…Eric
Eric Fernwood
Eric@Fernwood.Team
702-358-8884
www.Fernwood.Team
Below is a link to this month’s list of candidate investment properties. Our proprietary data mining software selected these candidate properties from thousands of available properties, and this is just the first step in our multi-step validation process, as shown below.
Note: Due to the rapid increase in interest rates, first-year returns are low. However, the return increases significantly even with a conservative 8% annual rent increase. The typical rent increase range is 8% to 12%. Contact me if you’d like detailed analysis for this subject.
Below are charts from our latest trailing 13 month market report, which includes July data. Remember that this data is only for the property profile that we target, not for the entire metro area. To see all the charts please click here.
|
Rental Statistics
|
Sales Statistics
|
|
Rentals – Median $/SF by Month
YoY rents grew an amazing 11% for July!
|
Sales – Median $/SF by Month
Though decreased slightly MoM, YoY prices increased by 28%!
|
|
Rentals – List to Contract Days by Month
Median time to rent is about 17 days for July.
|
Sales – List to Contract Days by Month
Median days on market is about 16 days for July. Still a hot market.
|
|
Rentals – Availability by Month
This chart shows the average daily number of properties that were for rent in a particular month. Pre-pandemic level was about 1000 (units).
|
Sales – Availability by Month
This chart shows the average daily number of properties that were for sale in a particular month.
|
|
Rentals – Months of Supply
Just 1 month of supply for our target rental property profile. Demand is still greather than supply.
|
Sales – Months of Supply
We had a modest increase of inventory for July that we discussed about.
|
For the last 15+ years, we’ve helped clients build highly reliable, passive income streams through real estate that they will not outlive. Several are now retired and living entirely on their rental income. Most never invested in real estate before they started working with us, and the vast majority live in other states or countries. Below is a two-minute video of the services we provide.
© Cleo Li and Eric Fernwood, all rights reserved.


