[Created with Gemini]
Last week we released our . (Please let me know if you find any errors, always happy to send a revised version out.) The outlook had many charts for the property segment we target. This week, we will provide more granular data on our research and look at the 10-year performance at the zip code level.
Considerations
-
Zip code performance changes over time. Additionally, individual properties within a zip code can perform better or worse than the zip code average.
-
The data are the actual MLS sales and rental history data, for . We are showing the actual averages so expect significant noise. We considered smoothing the data, but decided to show the actual result of the calculations.
-
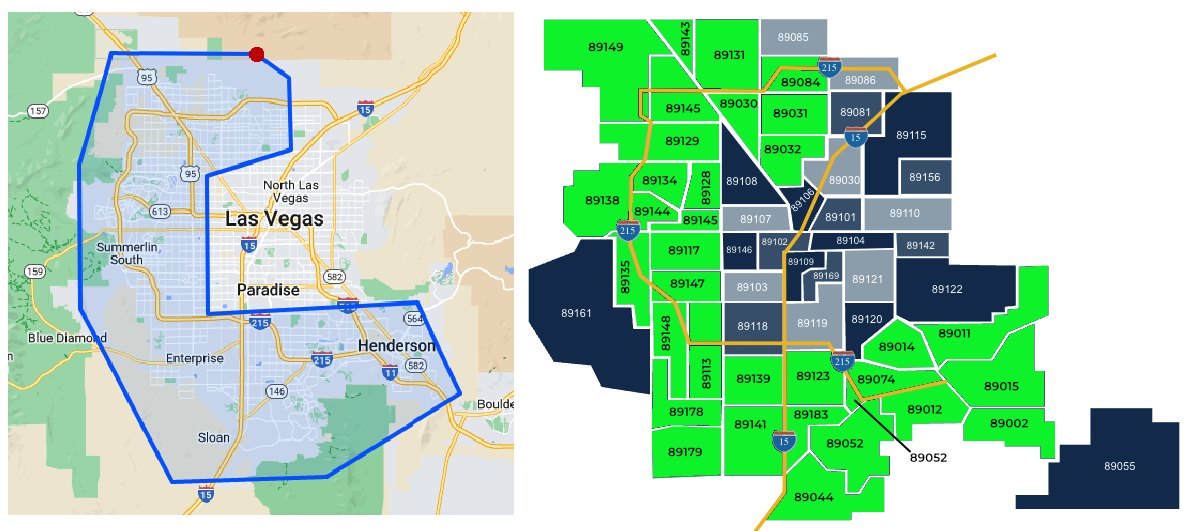
We are only providing zip code information in which we or clients have at least one property or more. These zip codes cover our target areas and include some areas that we do not target but are difficult to separate at the sub-zip code level. The zip codes include: 89011, 89014, 89015, 89031, 89032, 89044, 89052, 89074, 89084, 89085, 89117, 89123, 89129, 89130, 89131, 89134, 89135, 89138, 89139, 89141, 89143, 89145, 89147, 89148, 89149, 89166, 89178, 89183.
-
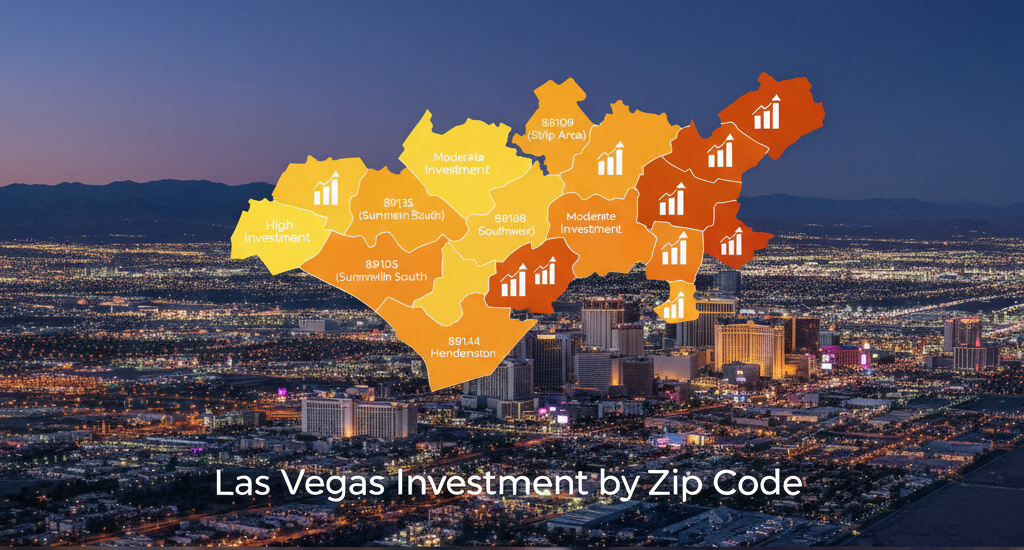
Below is a map showing these zip codes highlighted in green
Warning: there are many charts in this post!
Rent Growth Rates by Zip Code
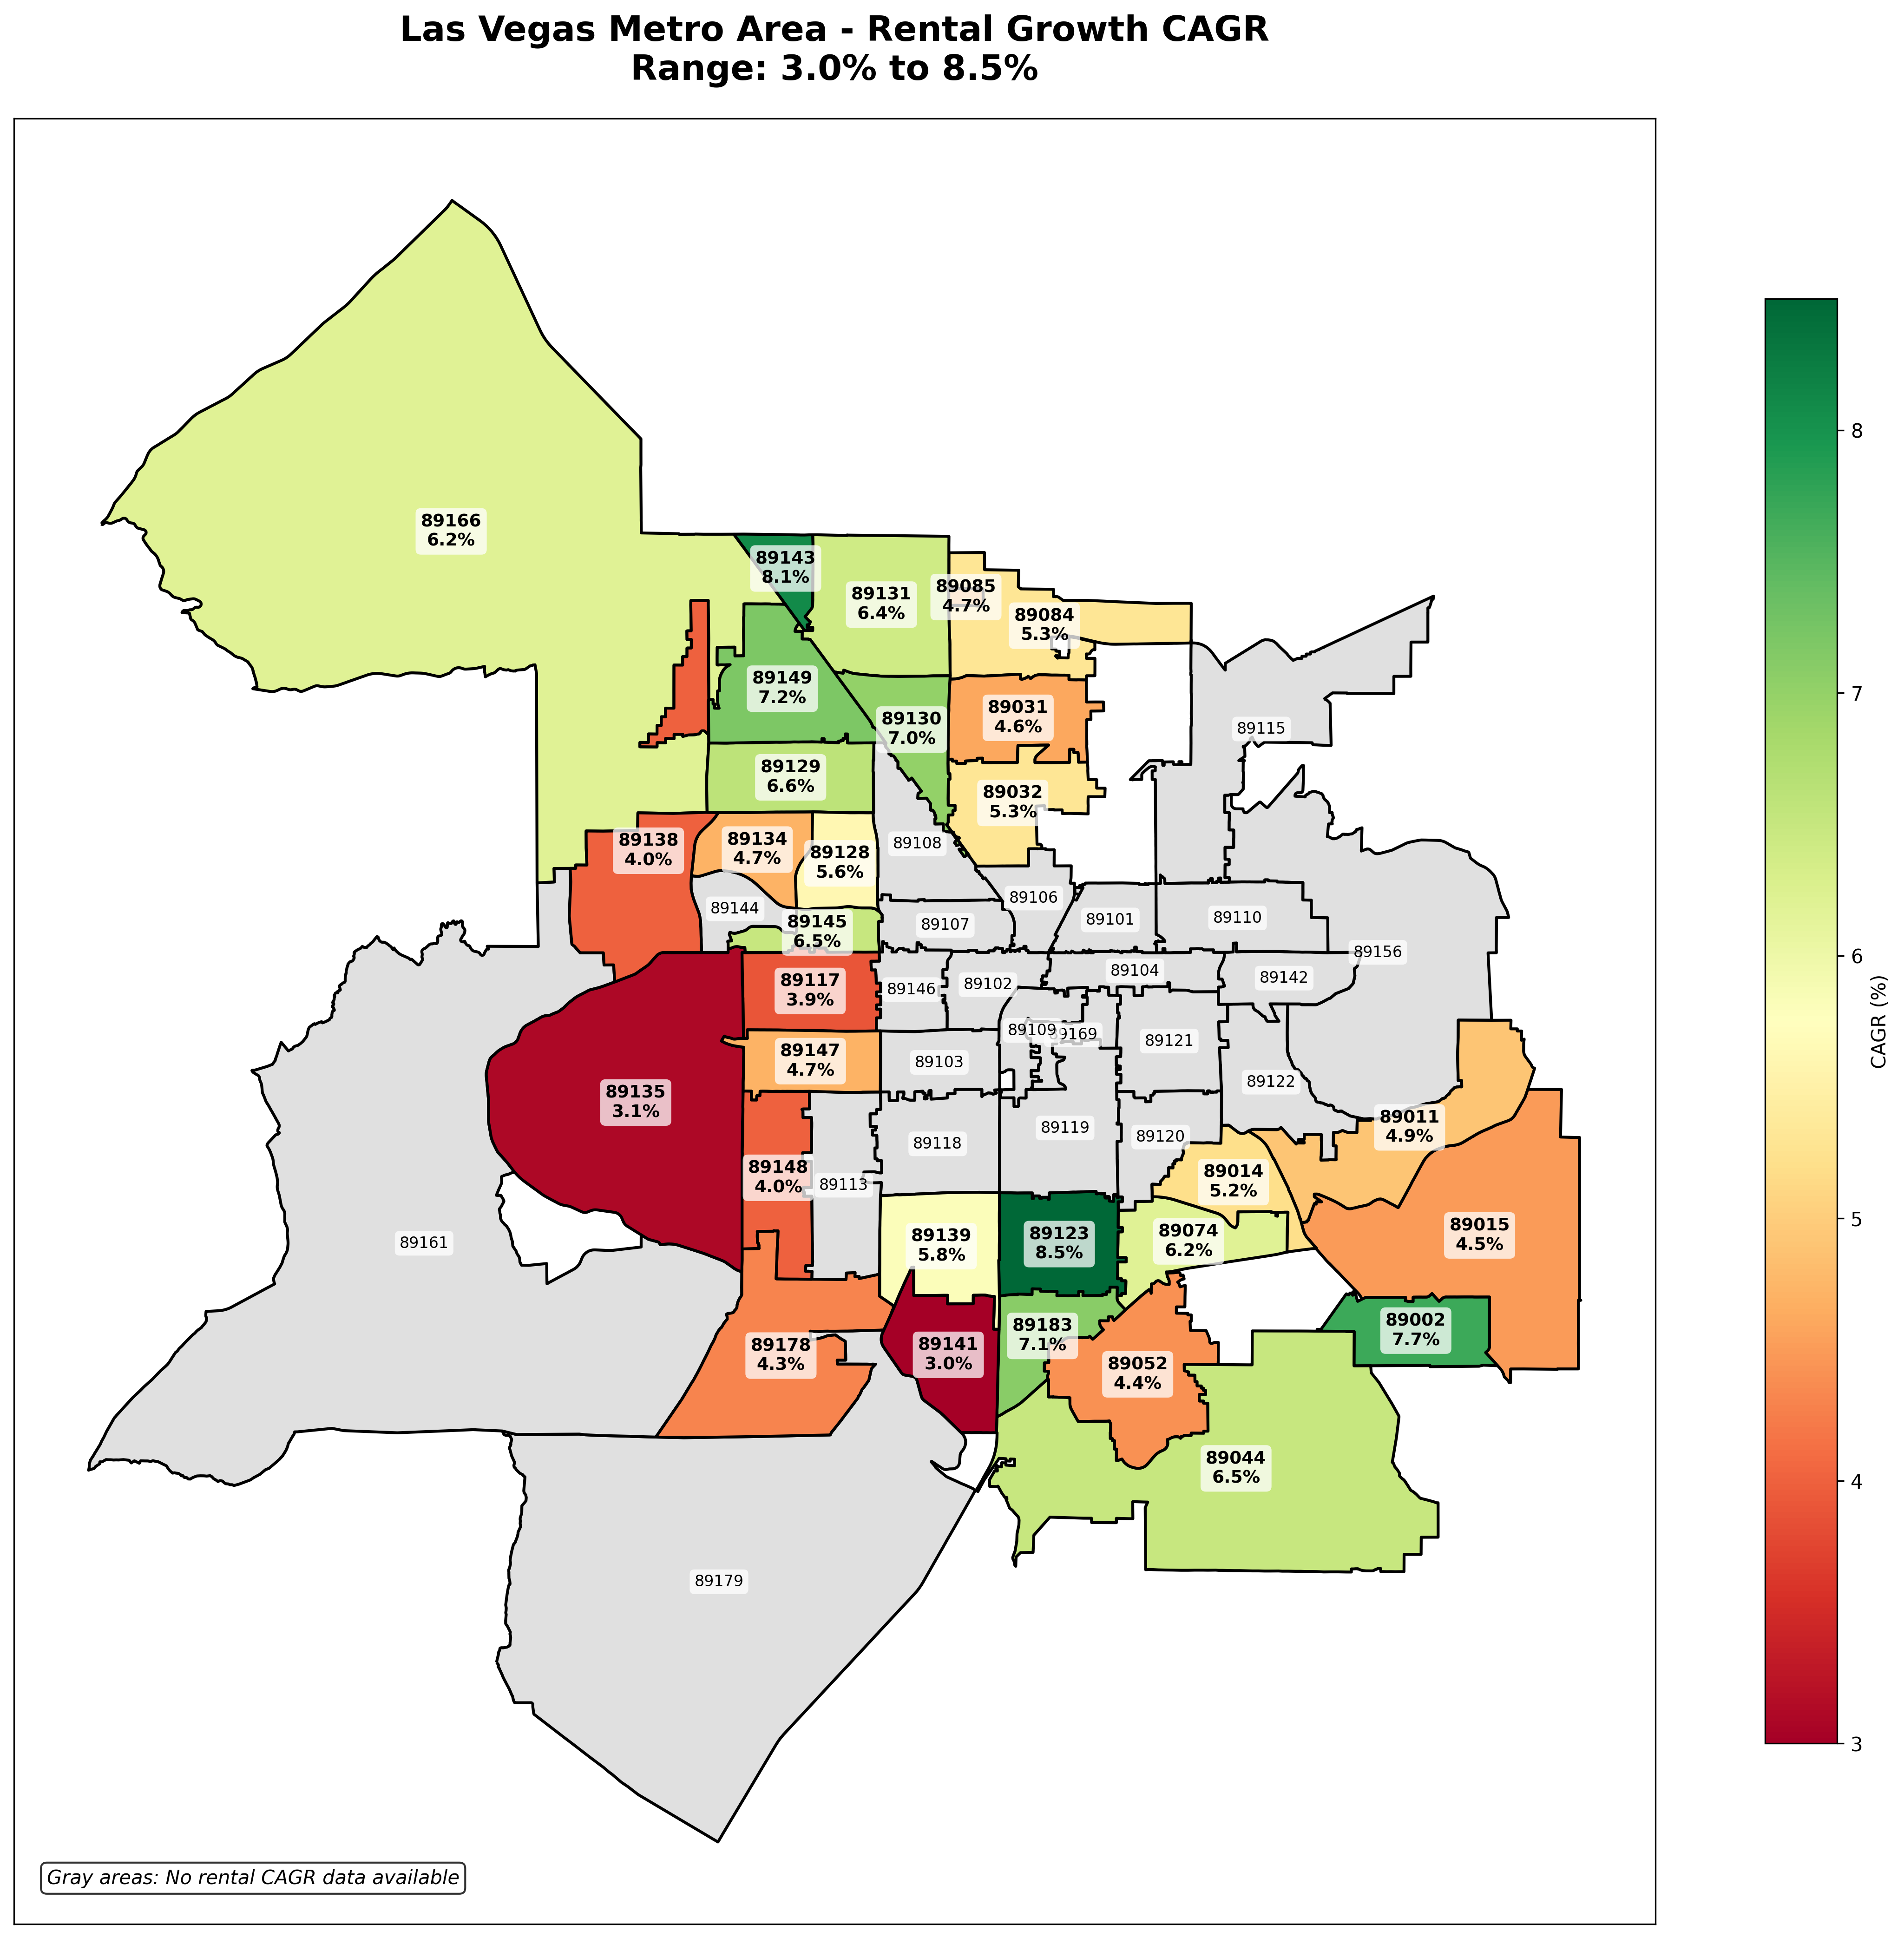
As an overview, below is a heat map of the 10-year rent growth rates for the listed zip codes.
Las Vegas Rental Market Heatmap – CAGR by Zip Code
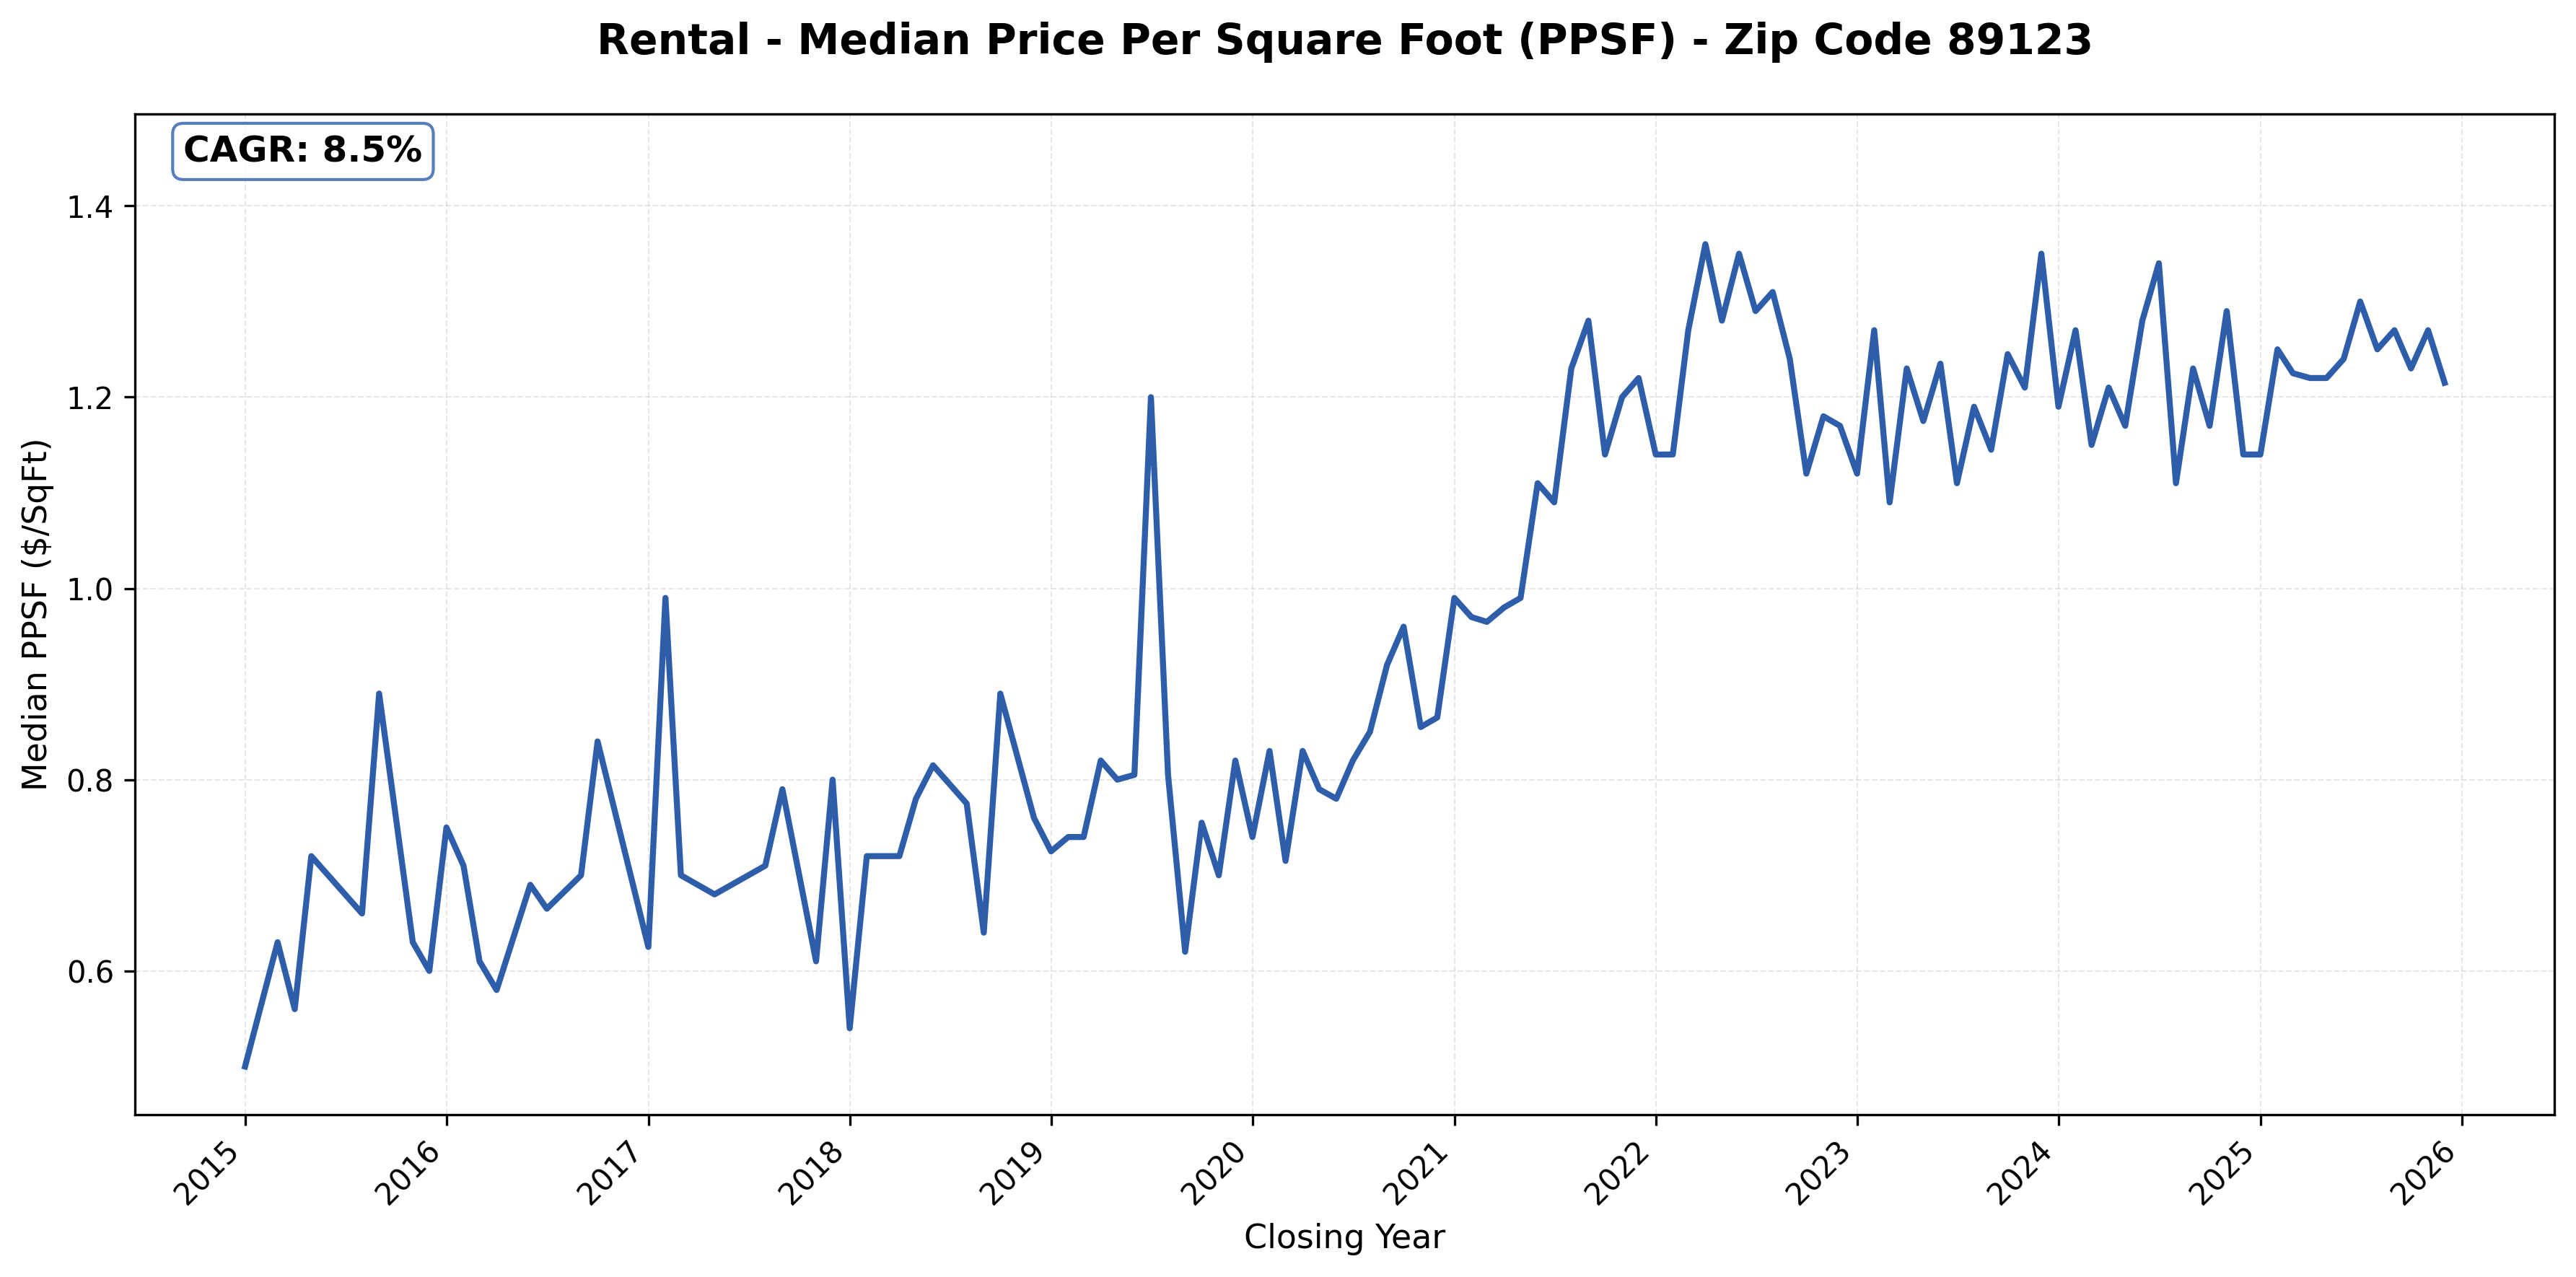
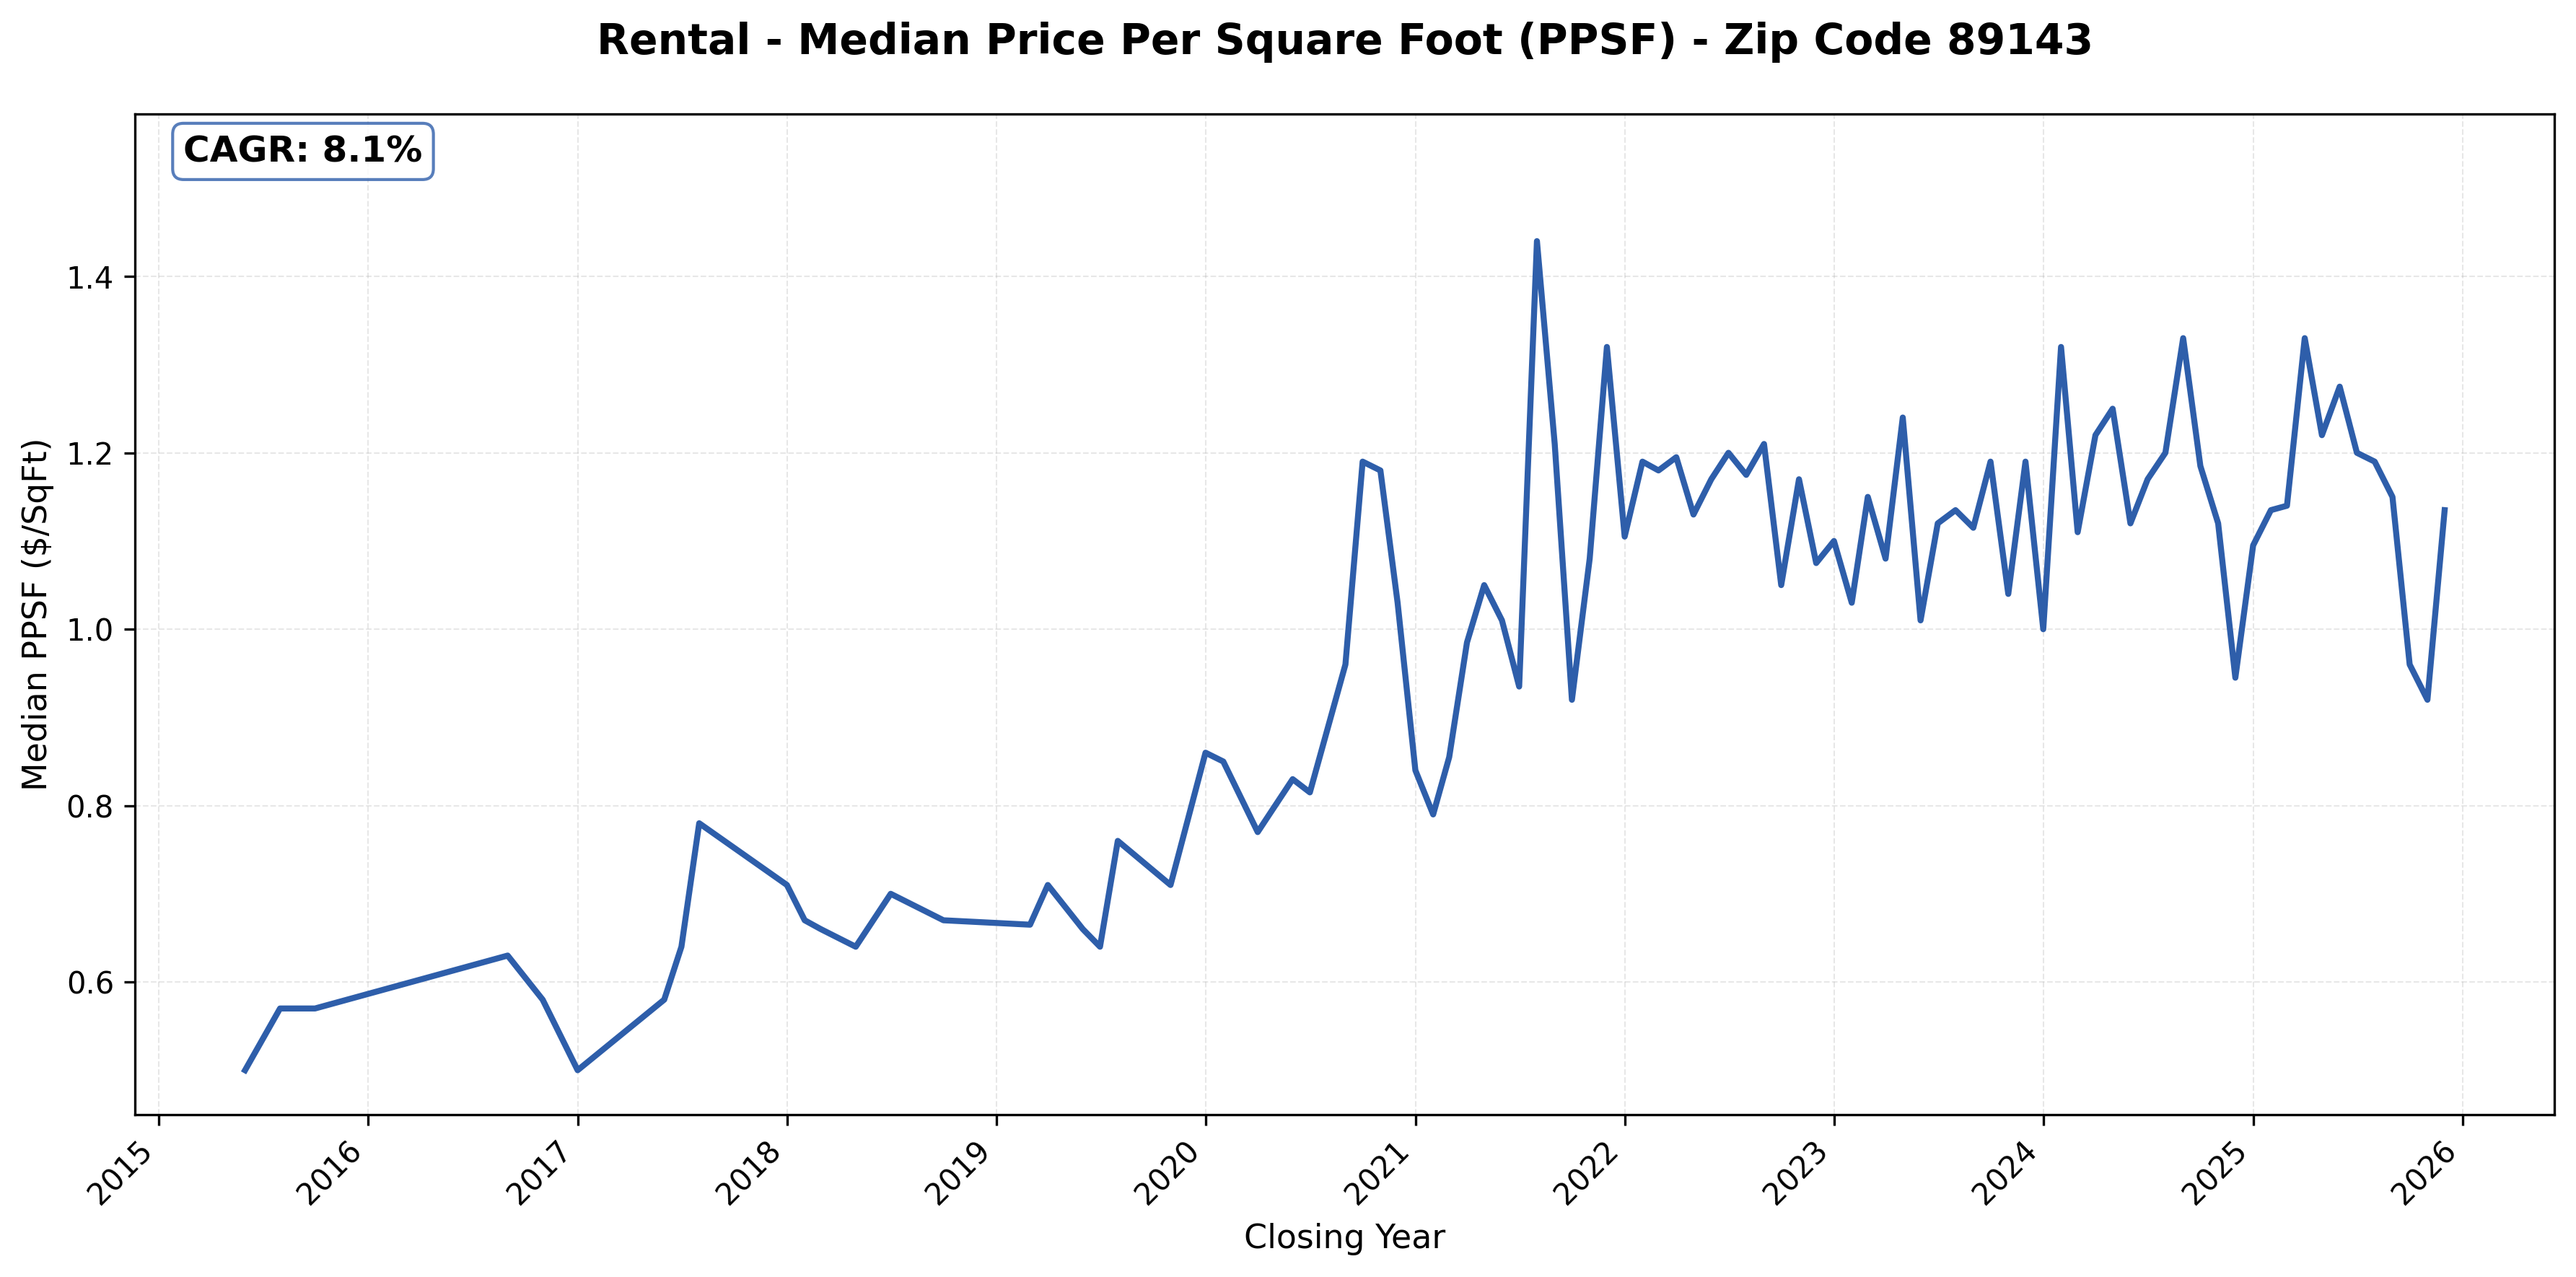
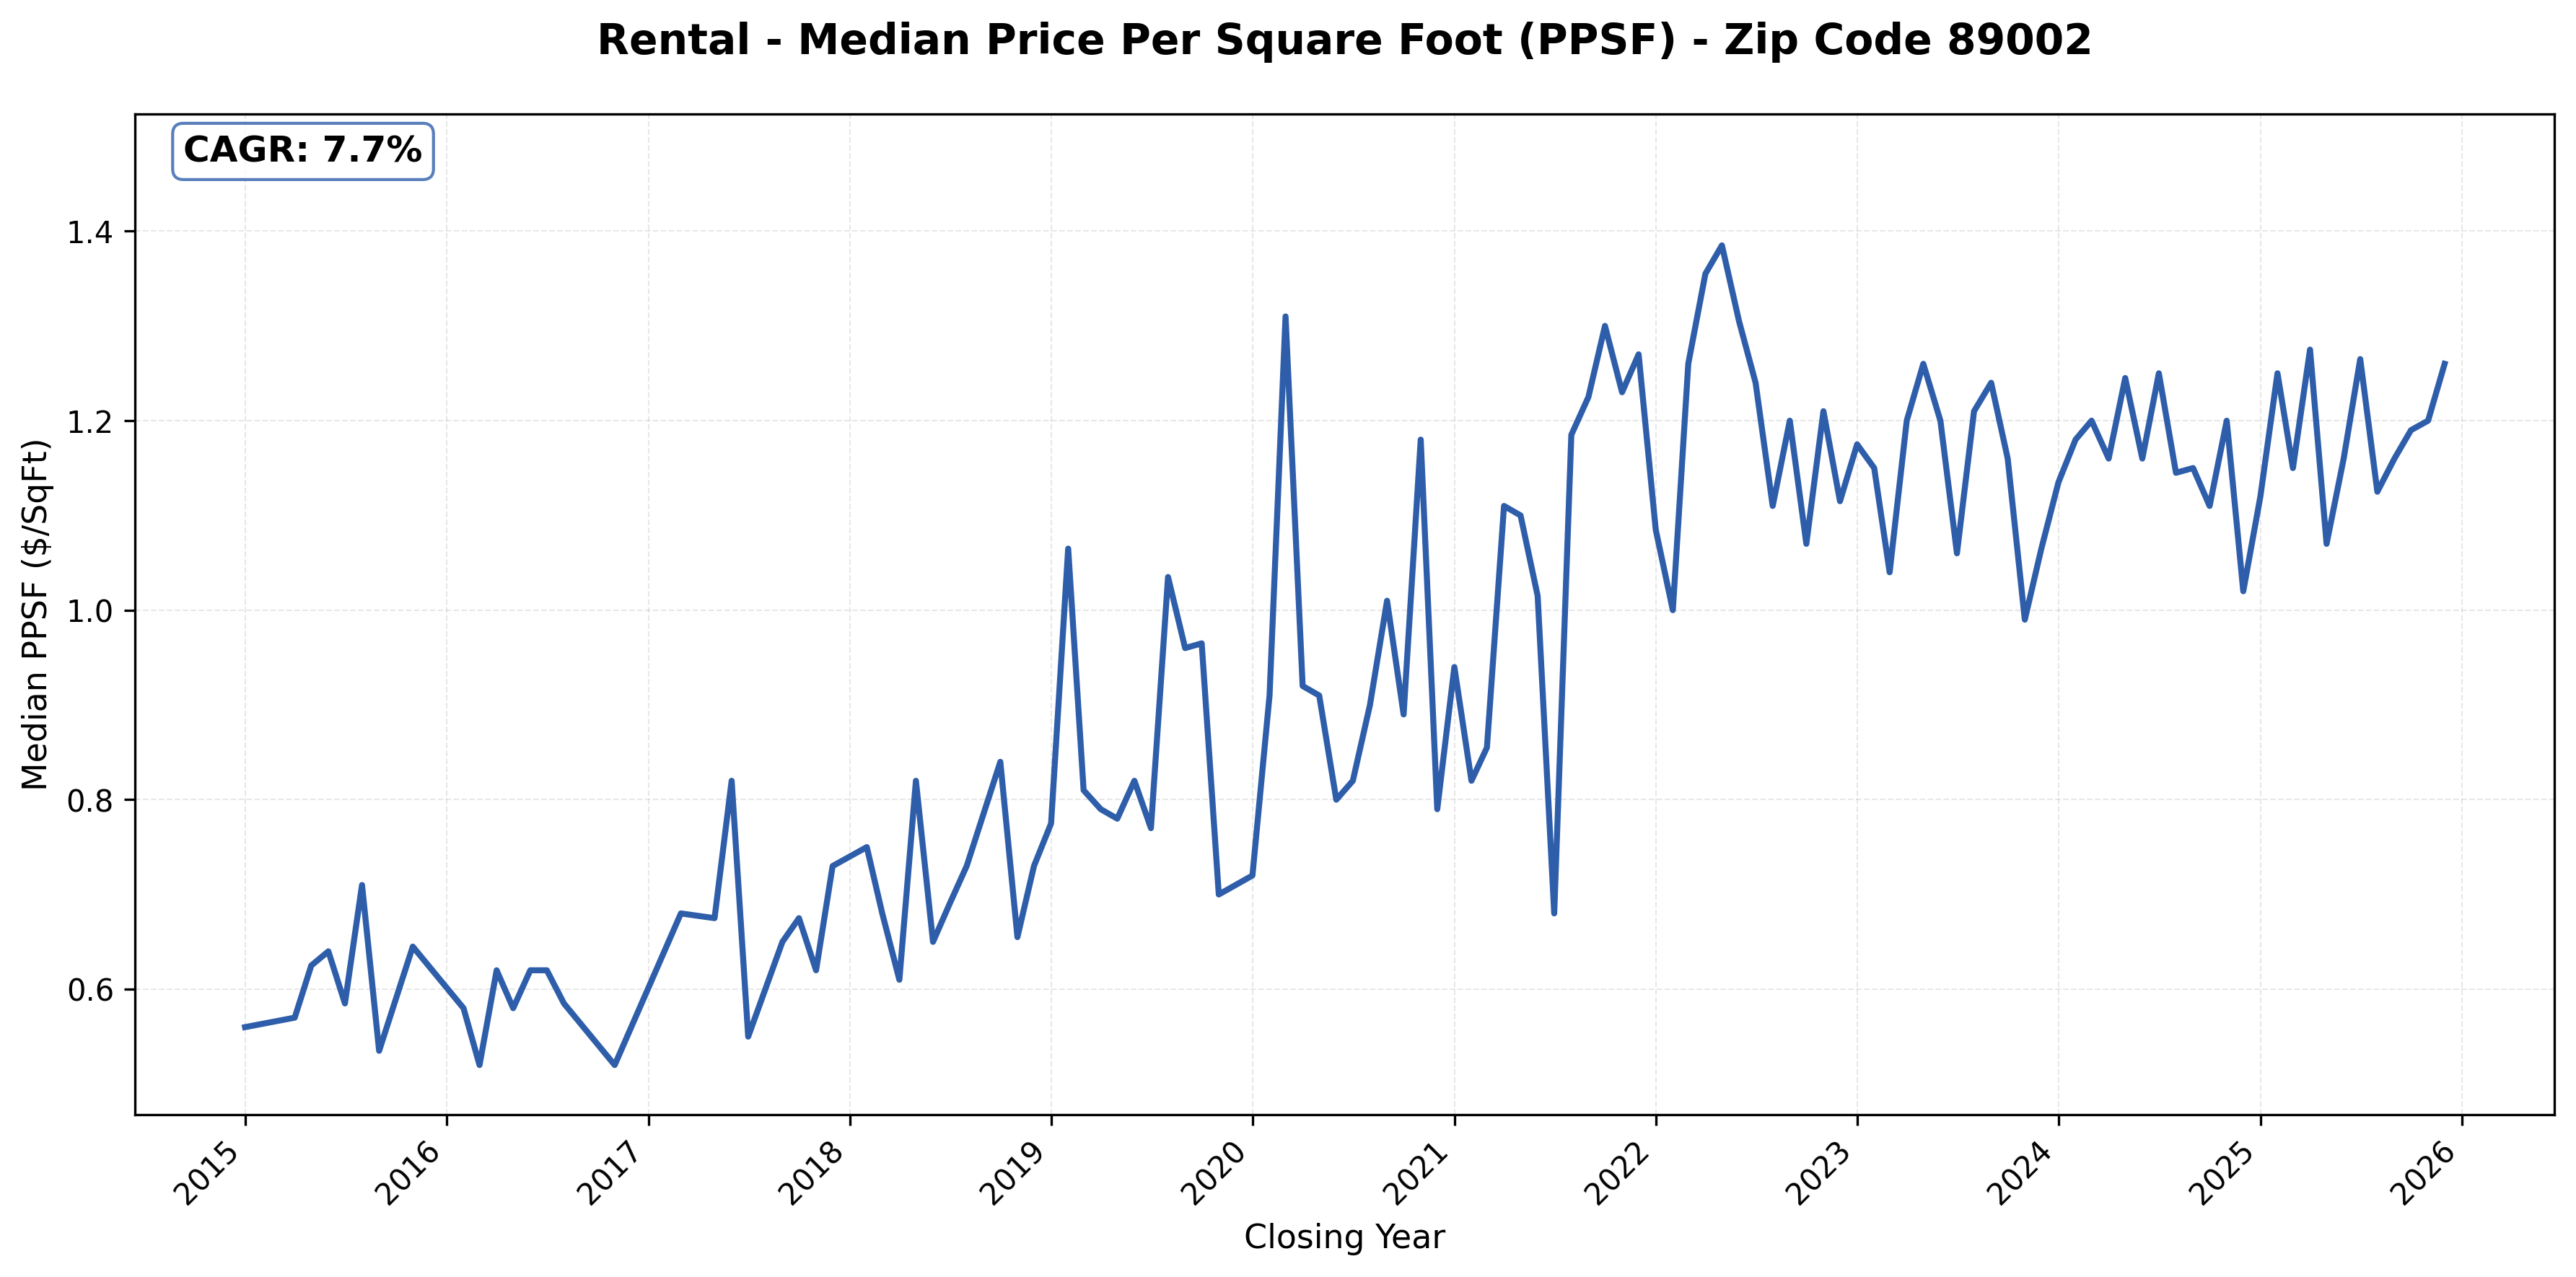
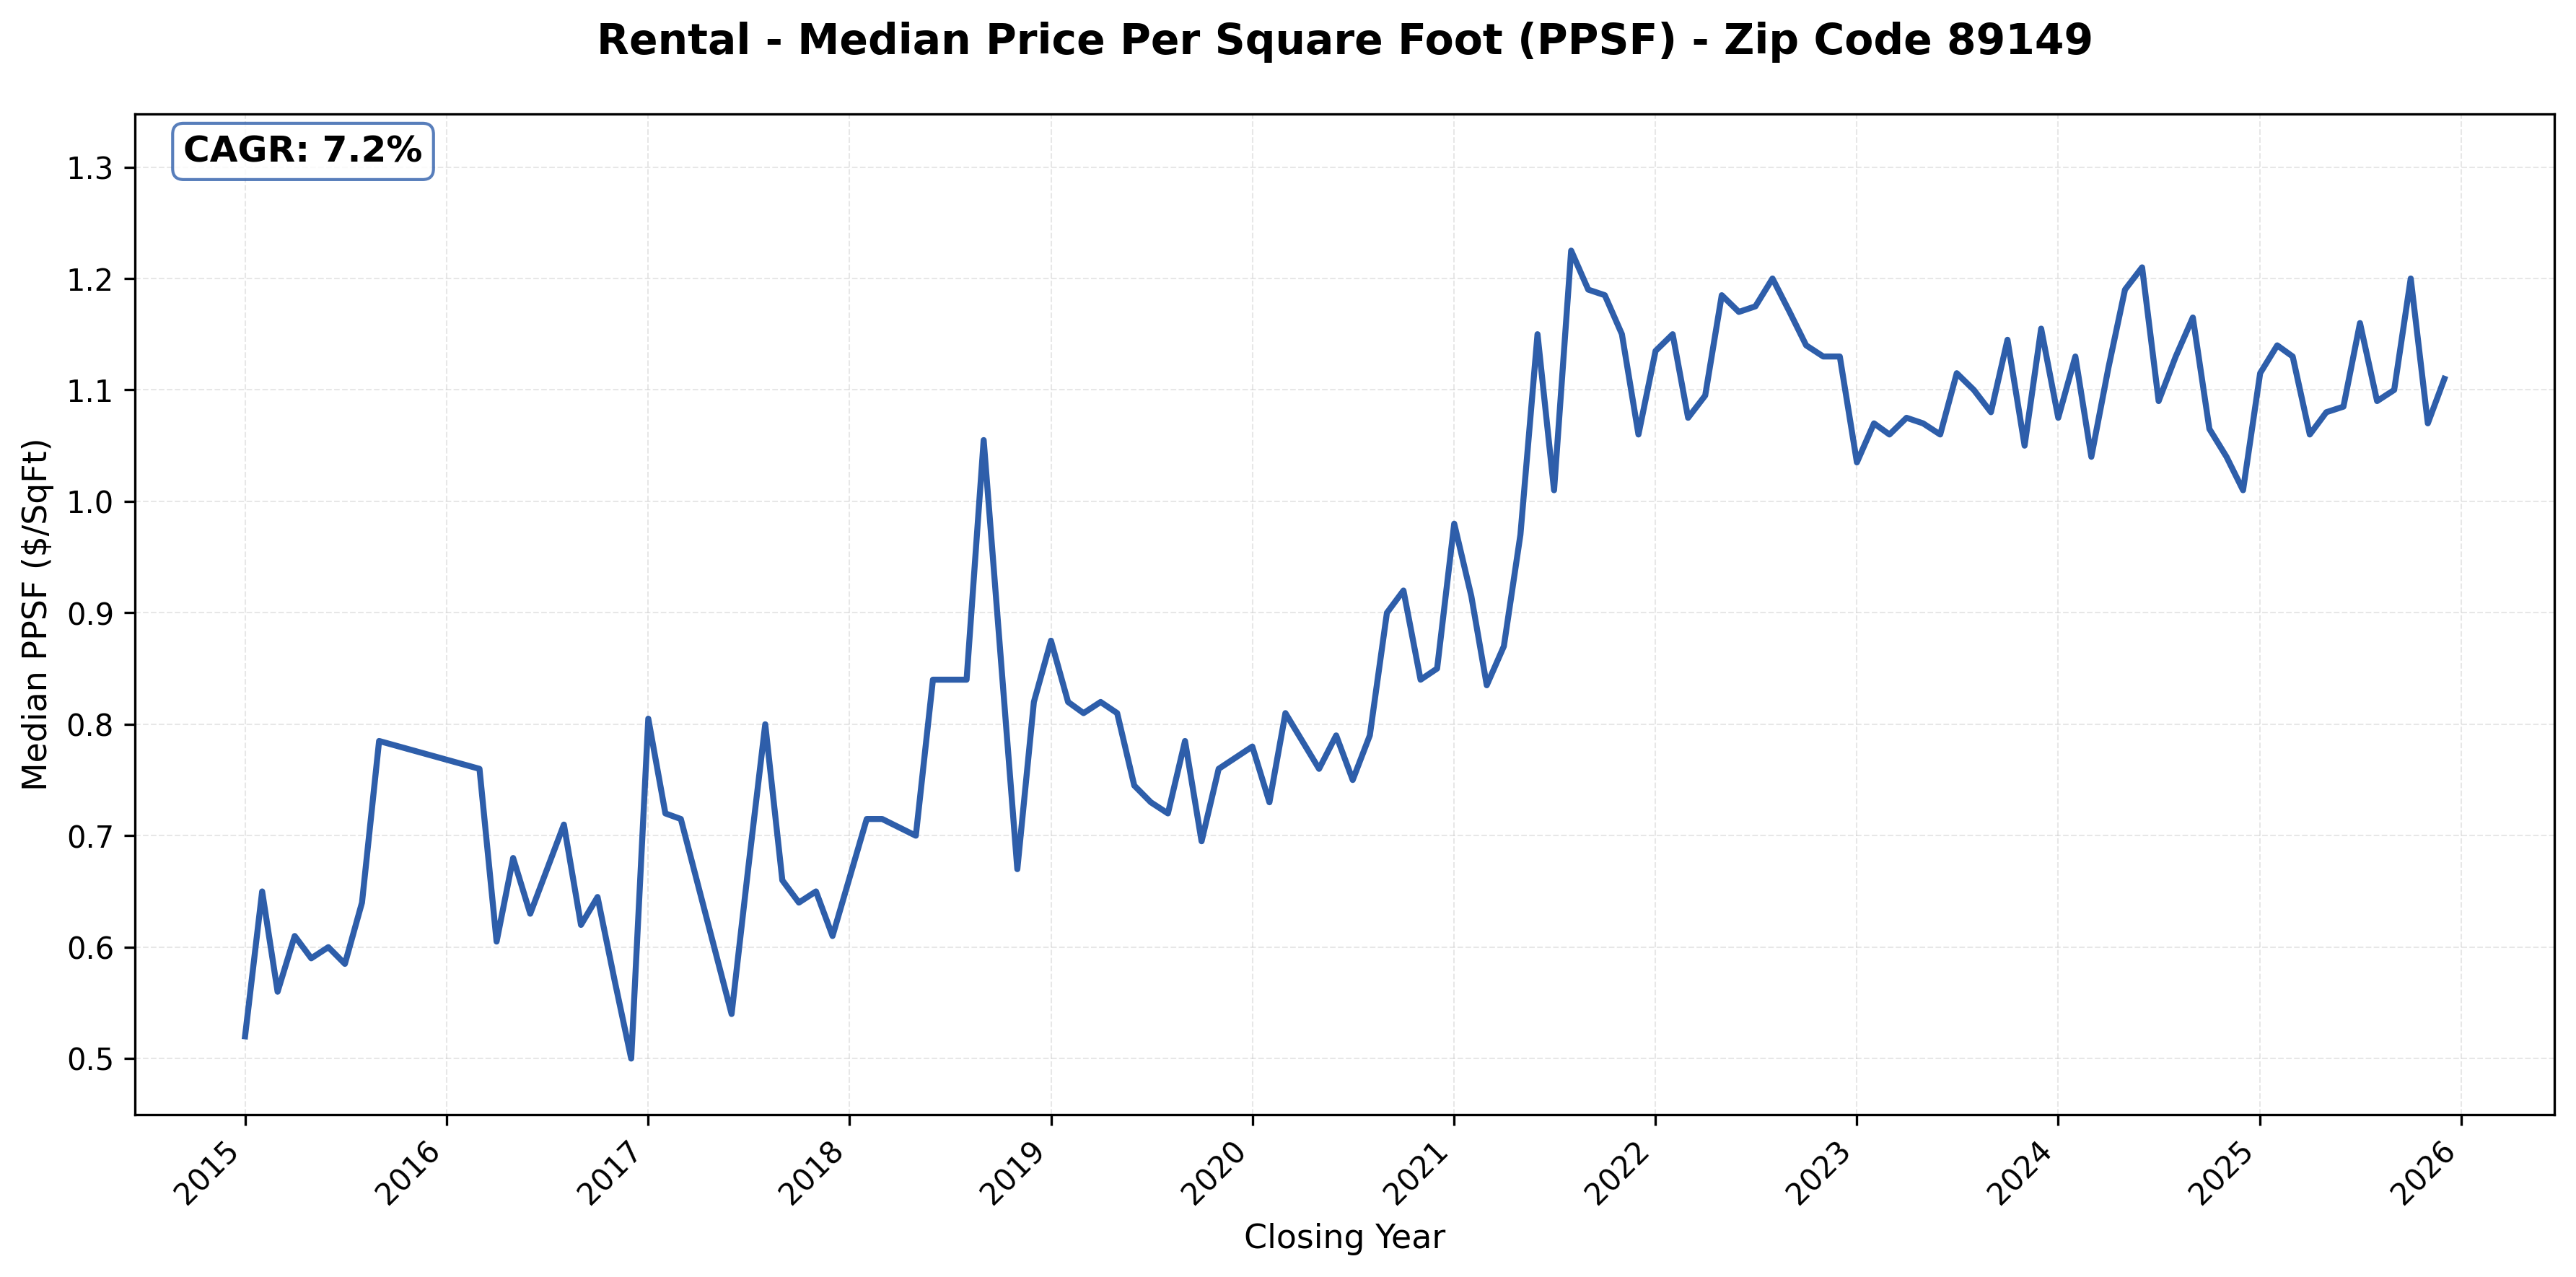
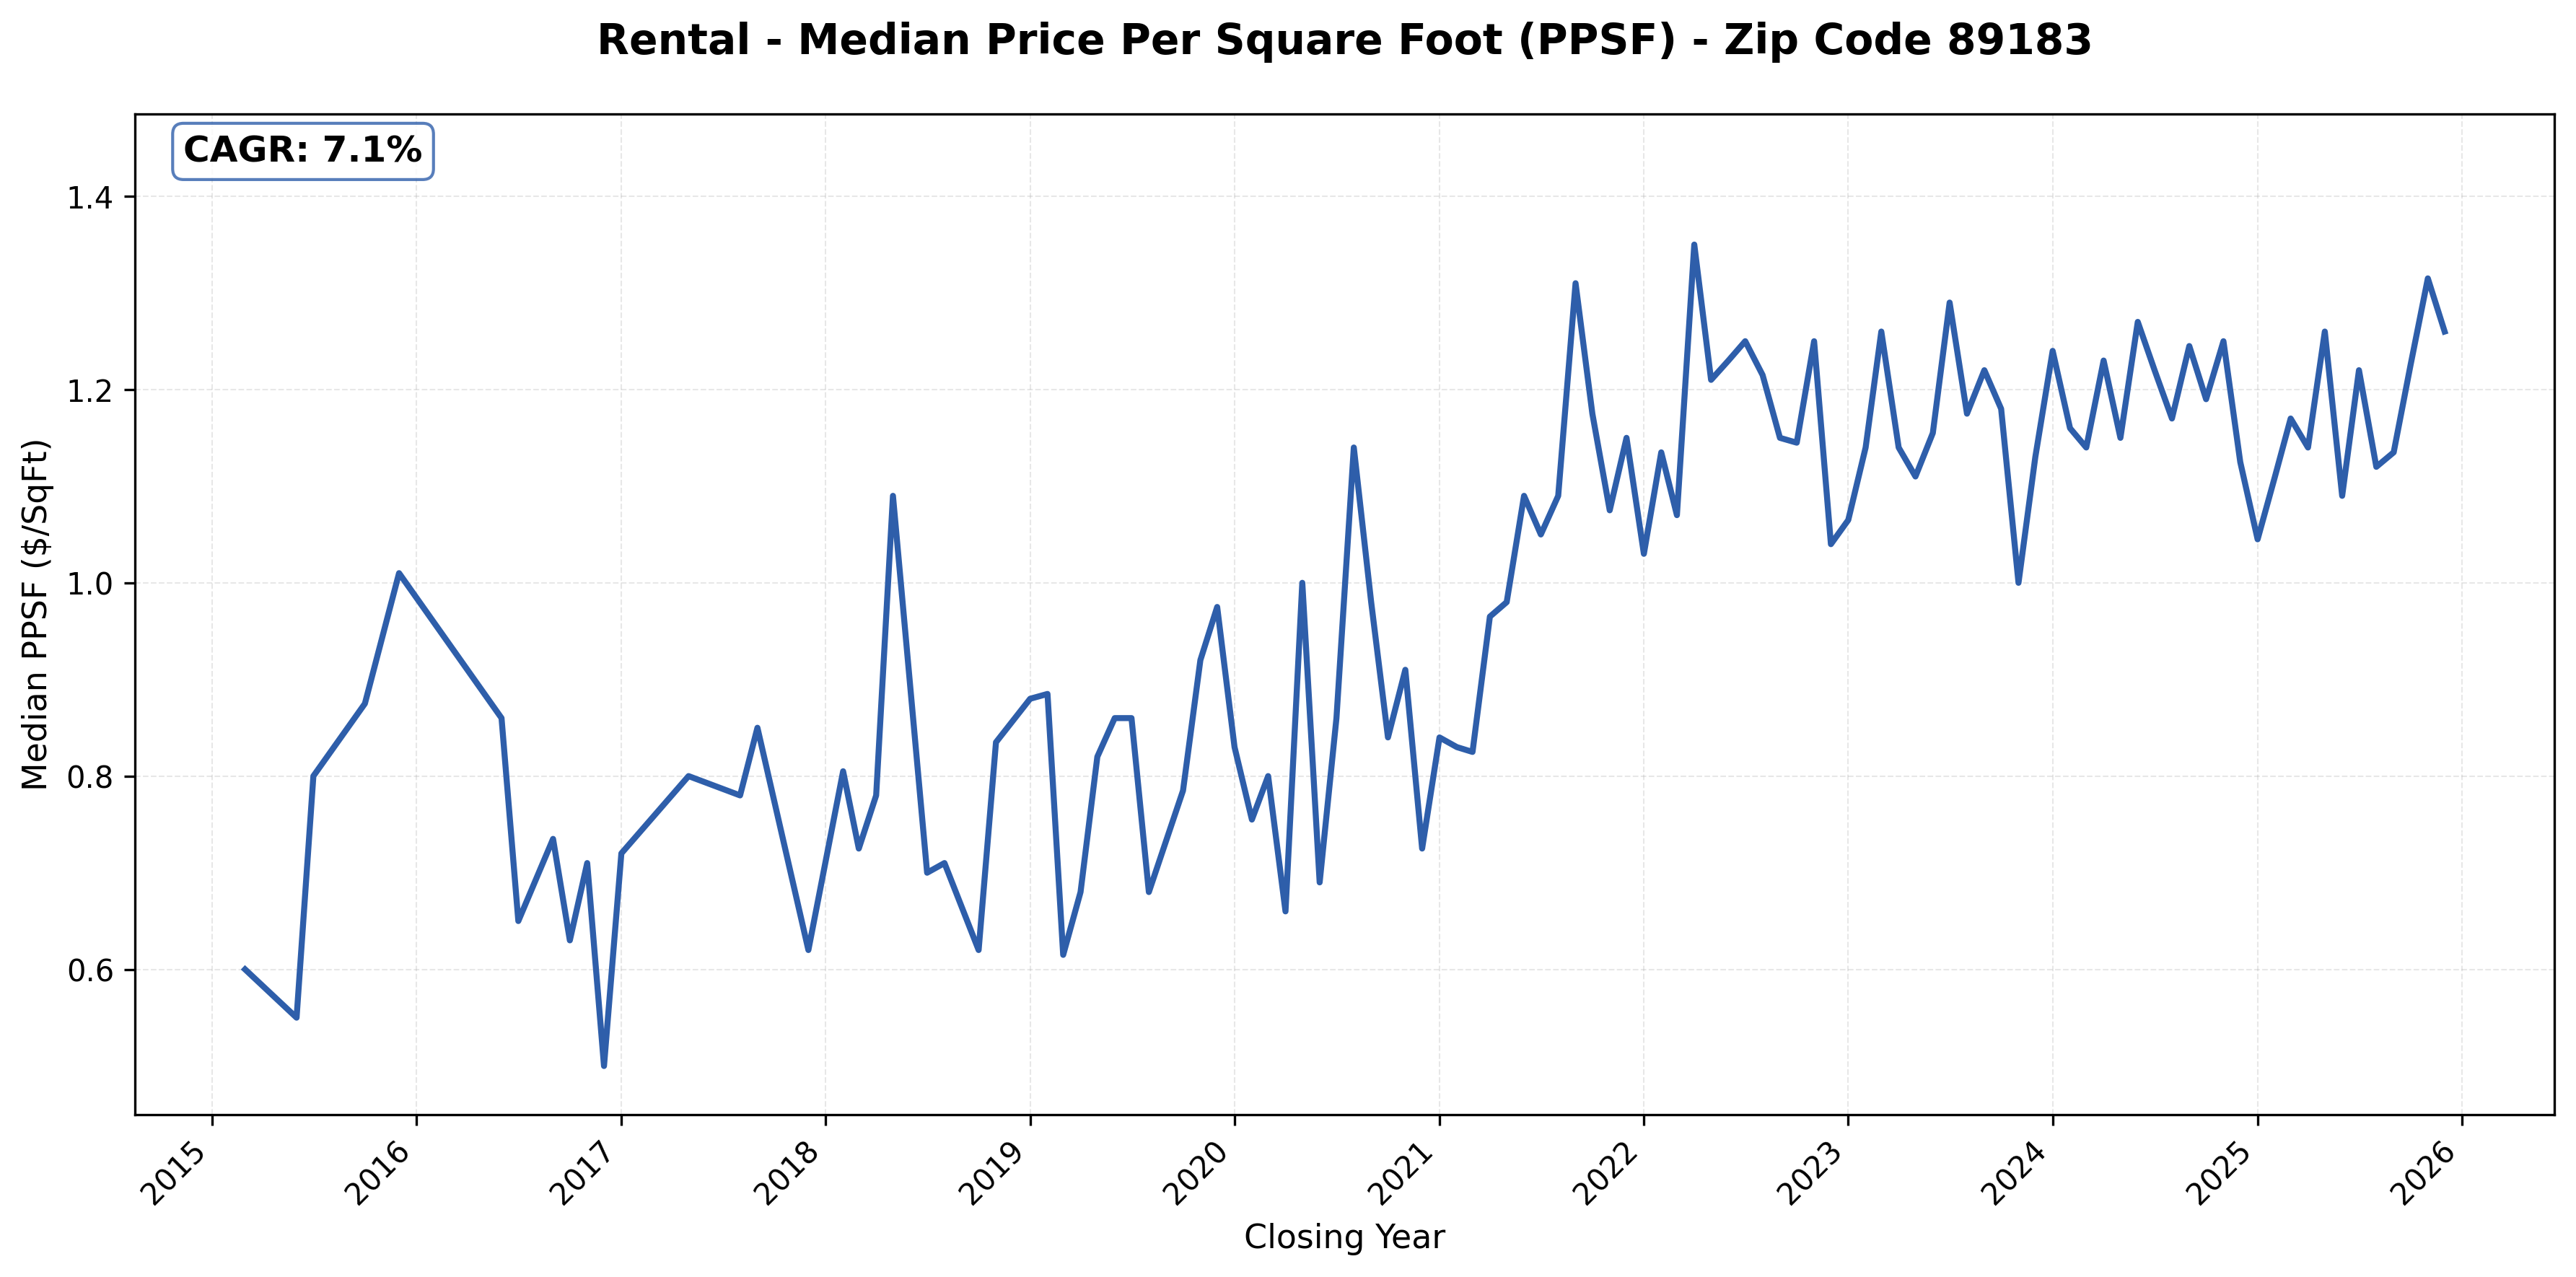
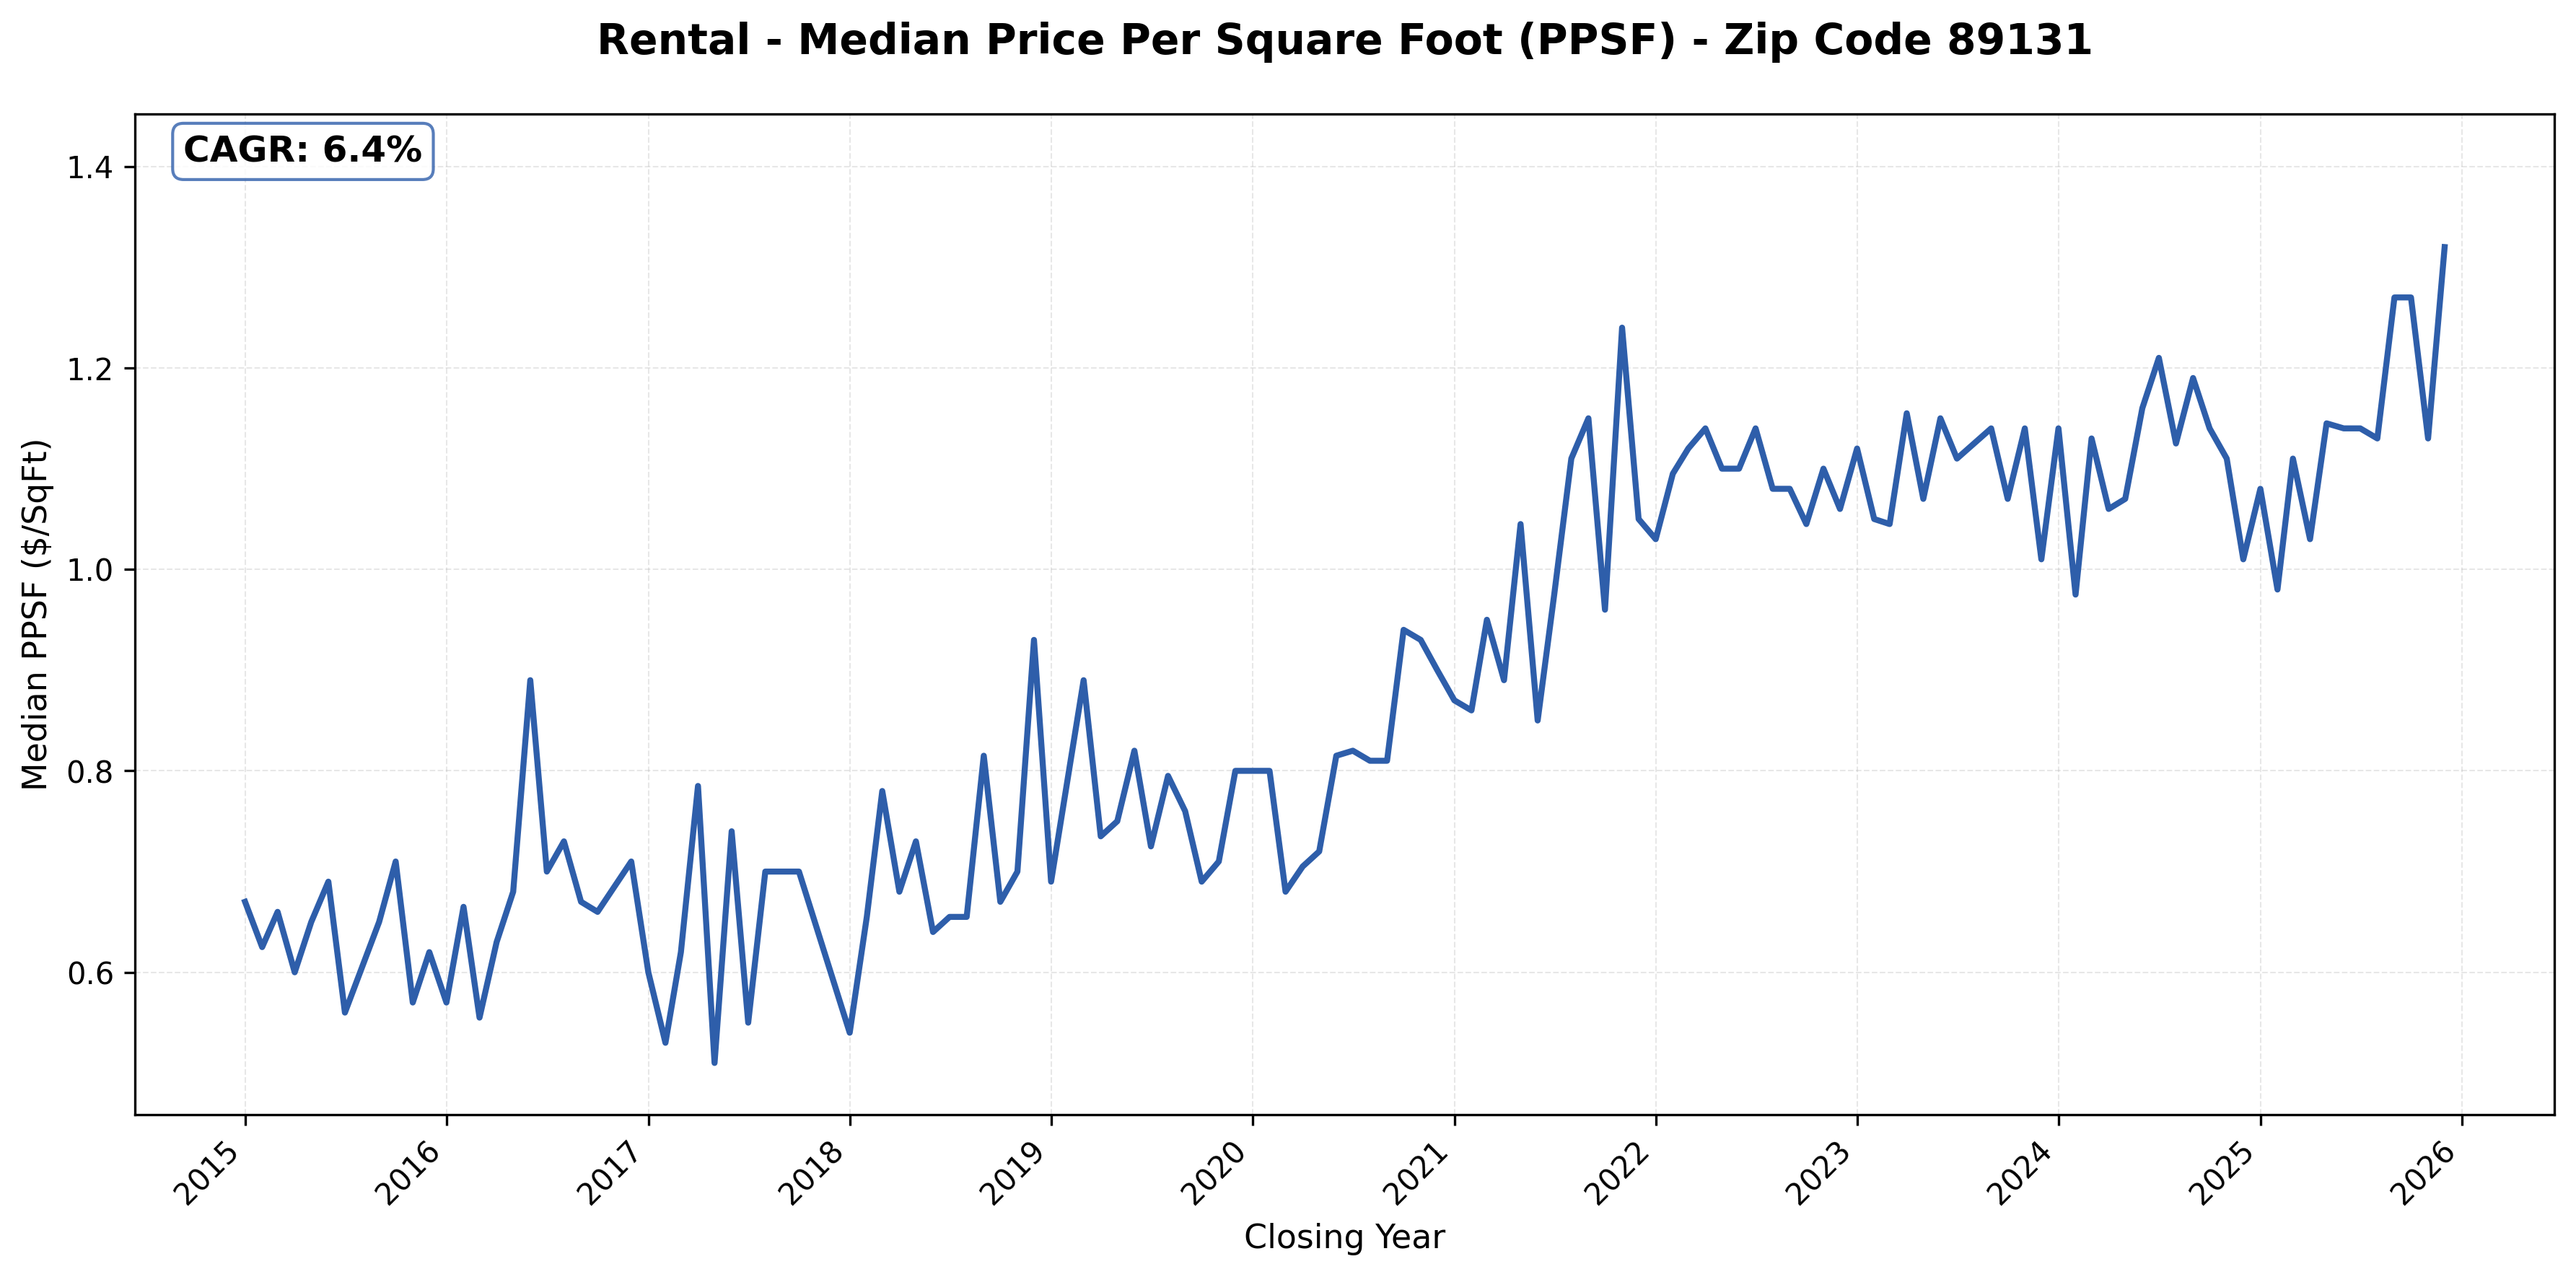
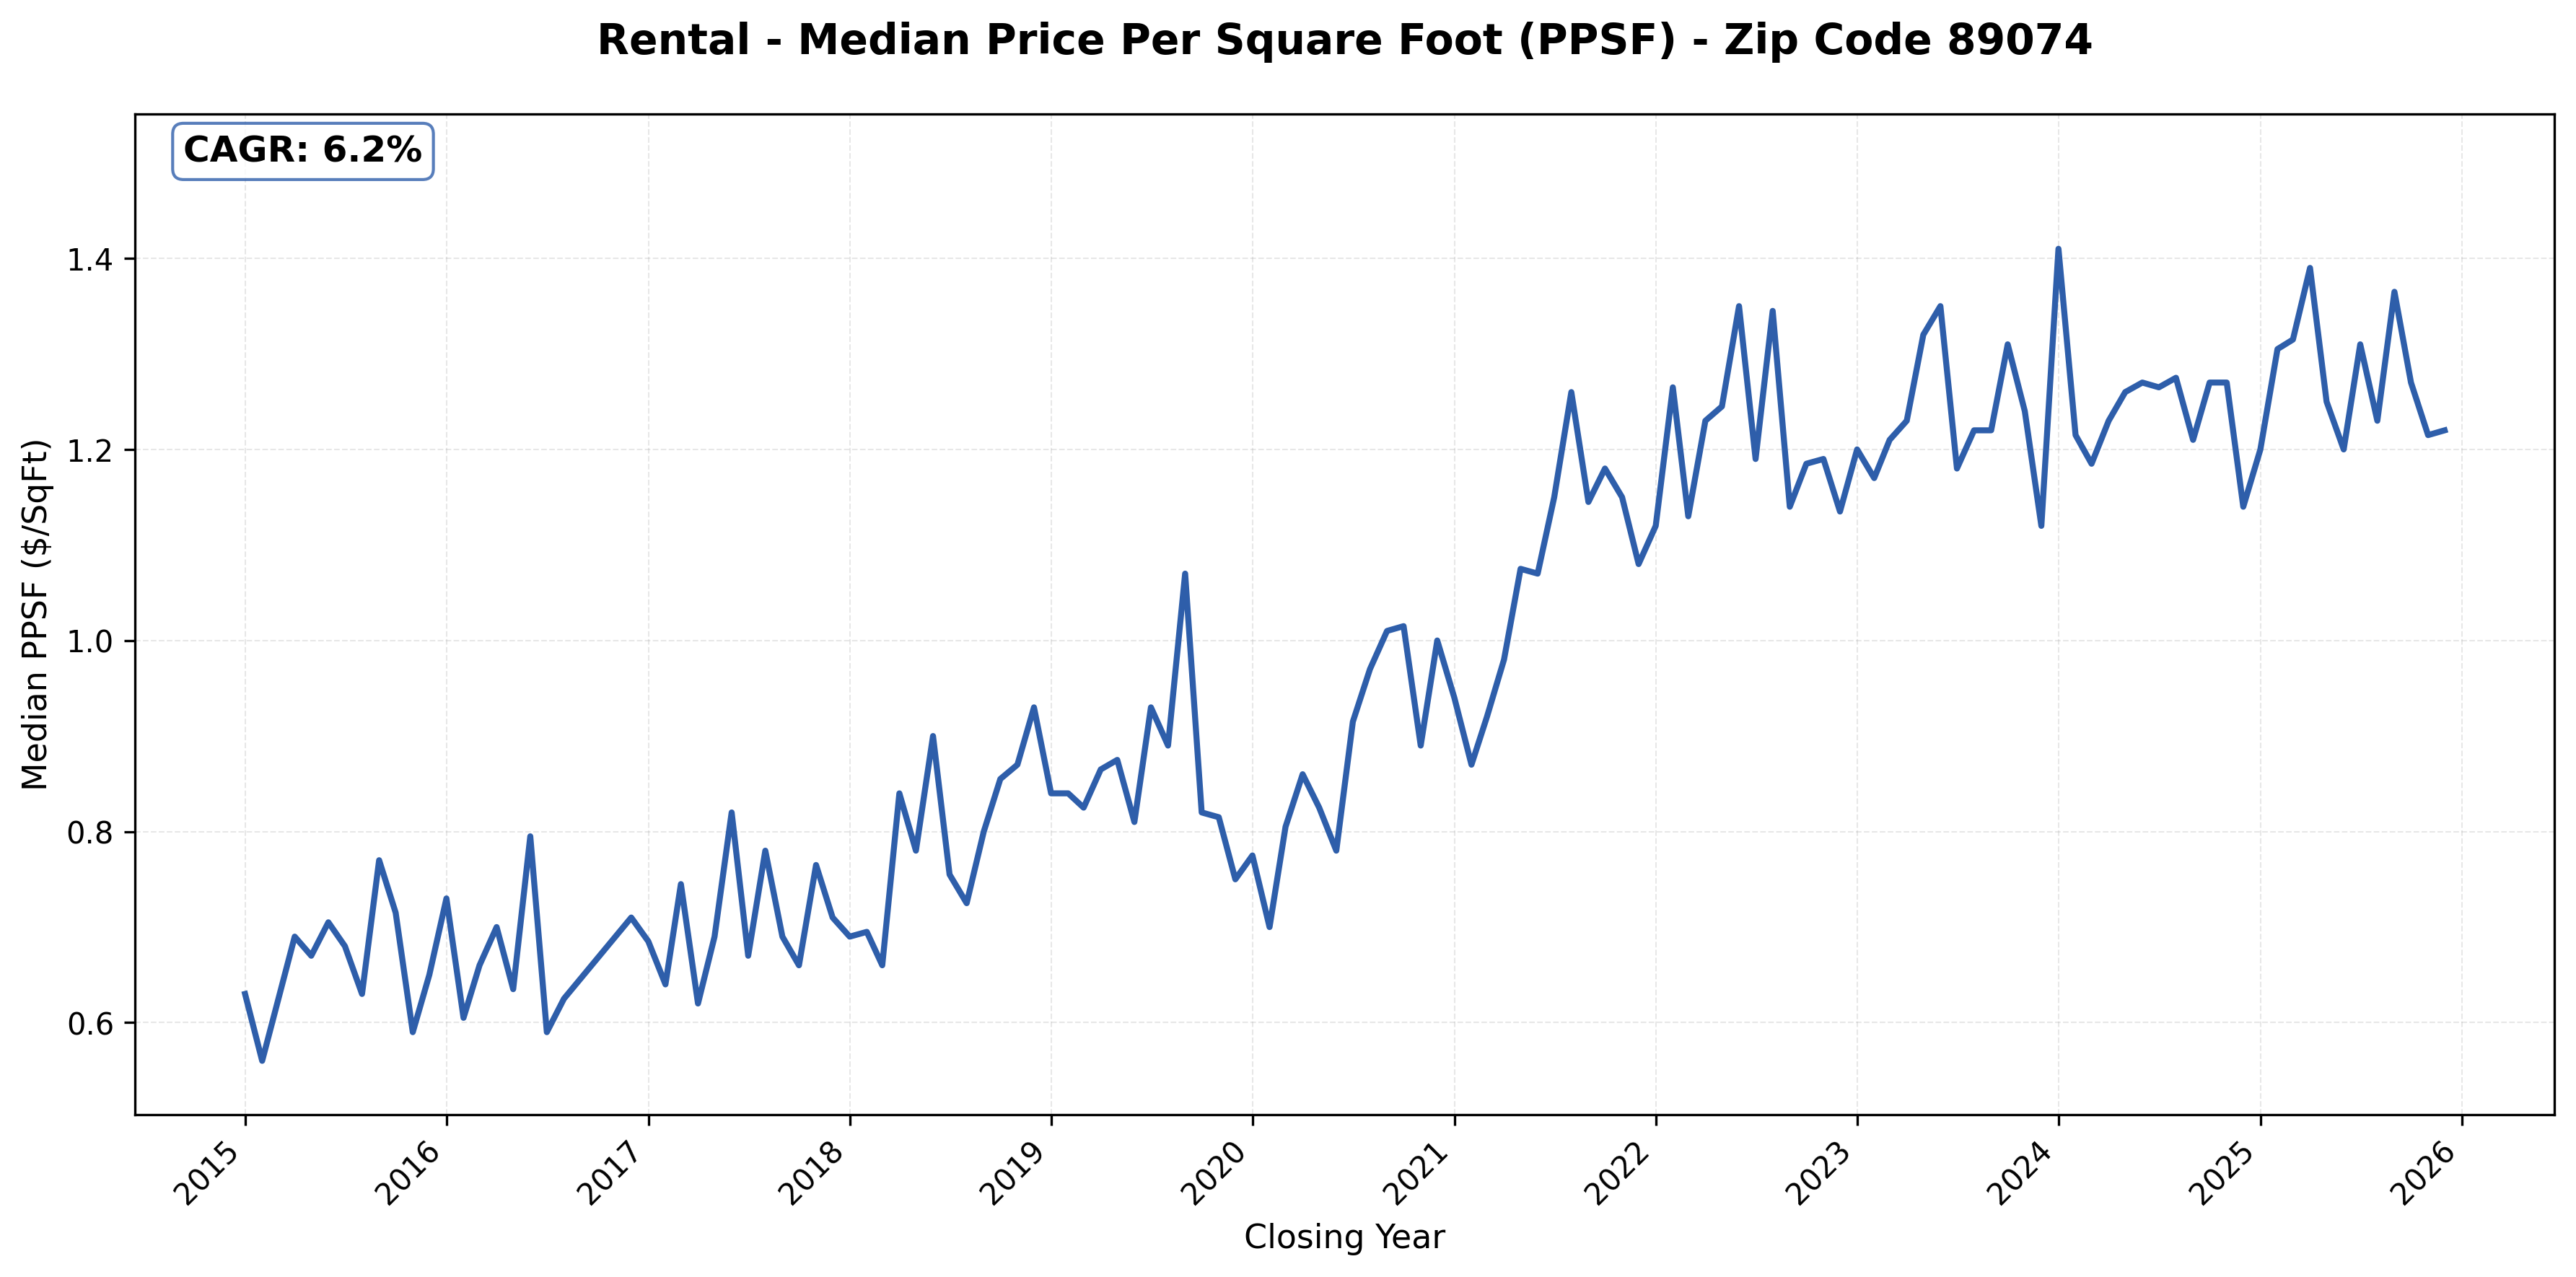
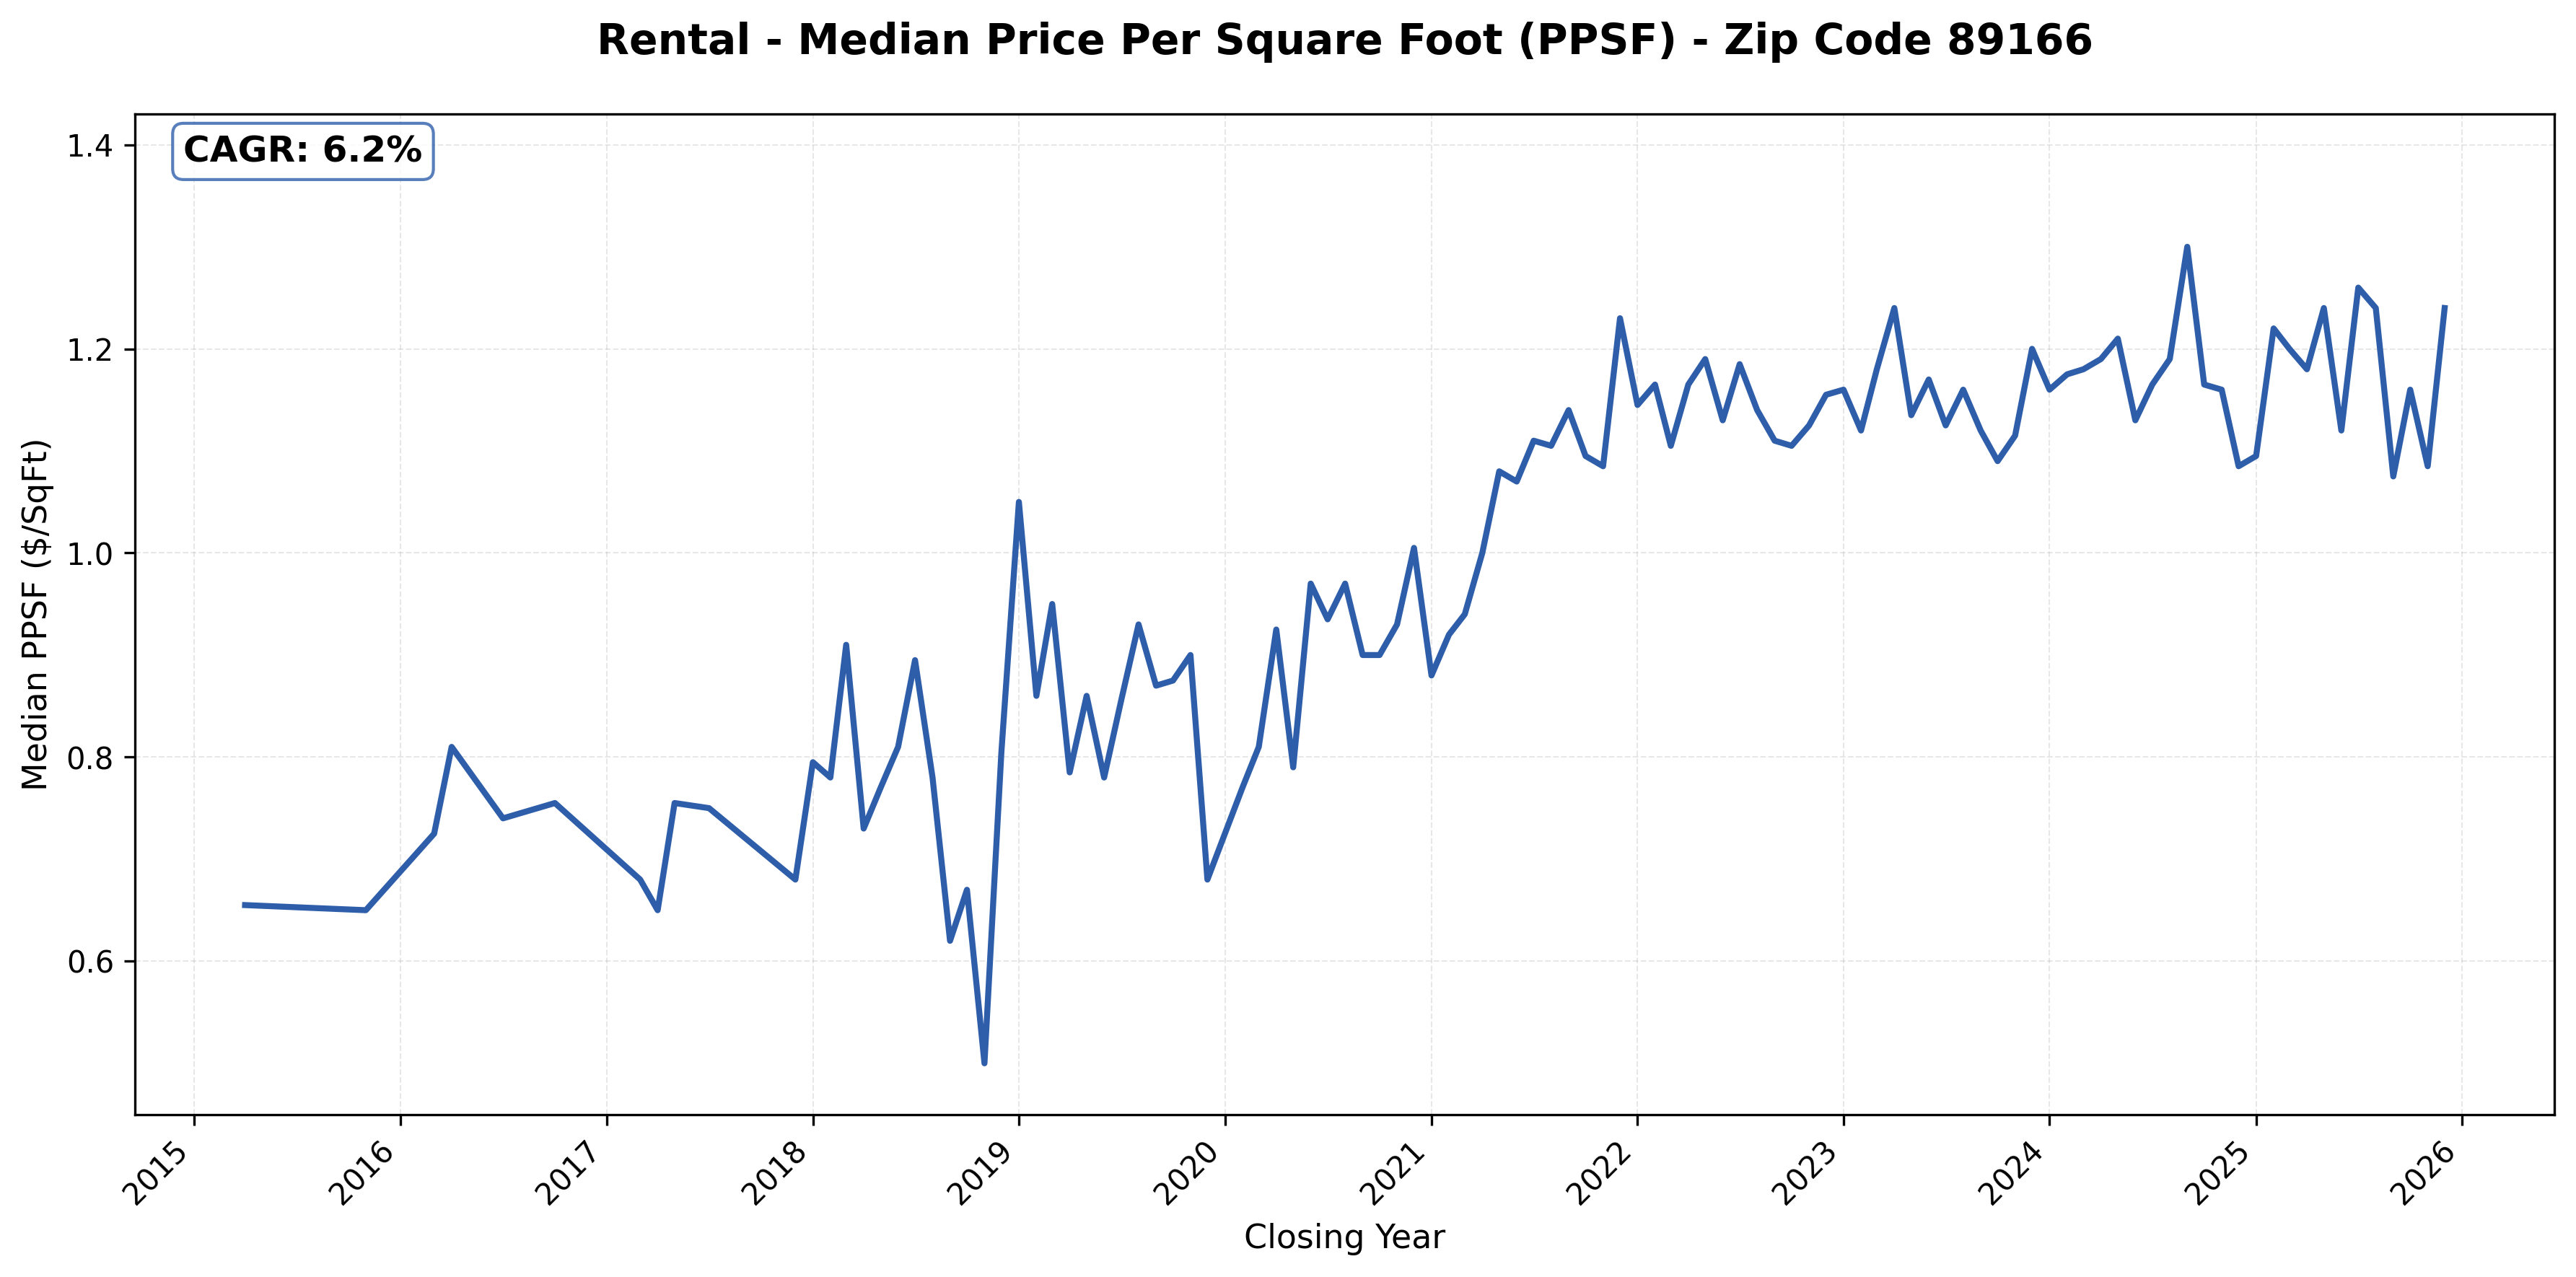
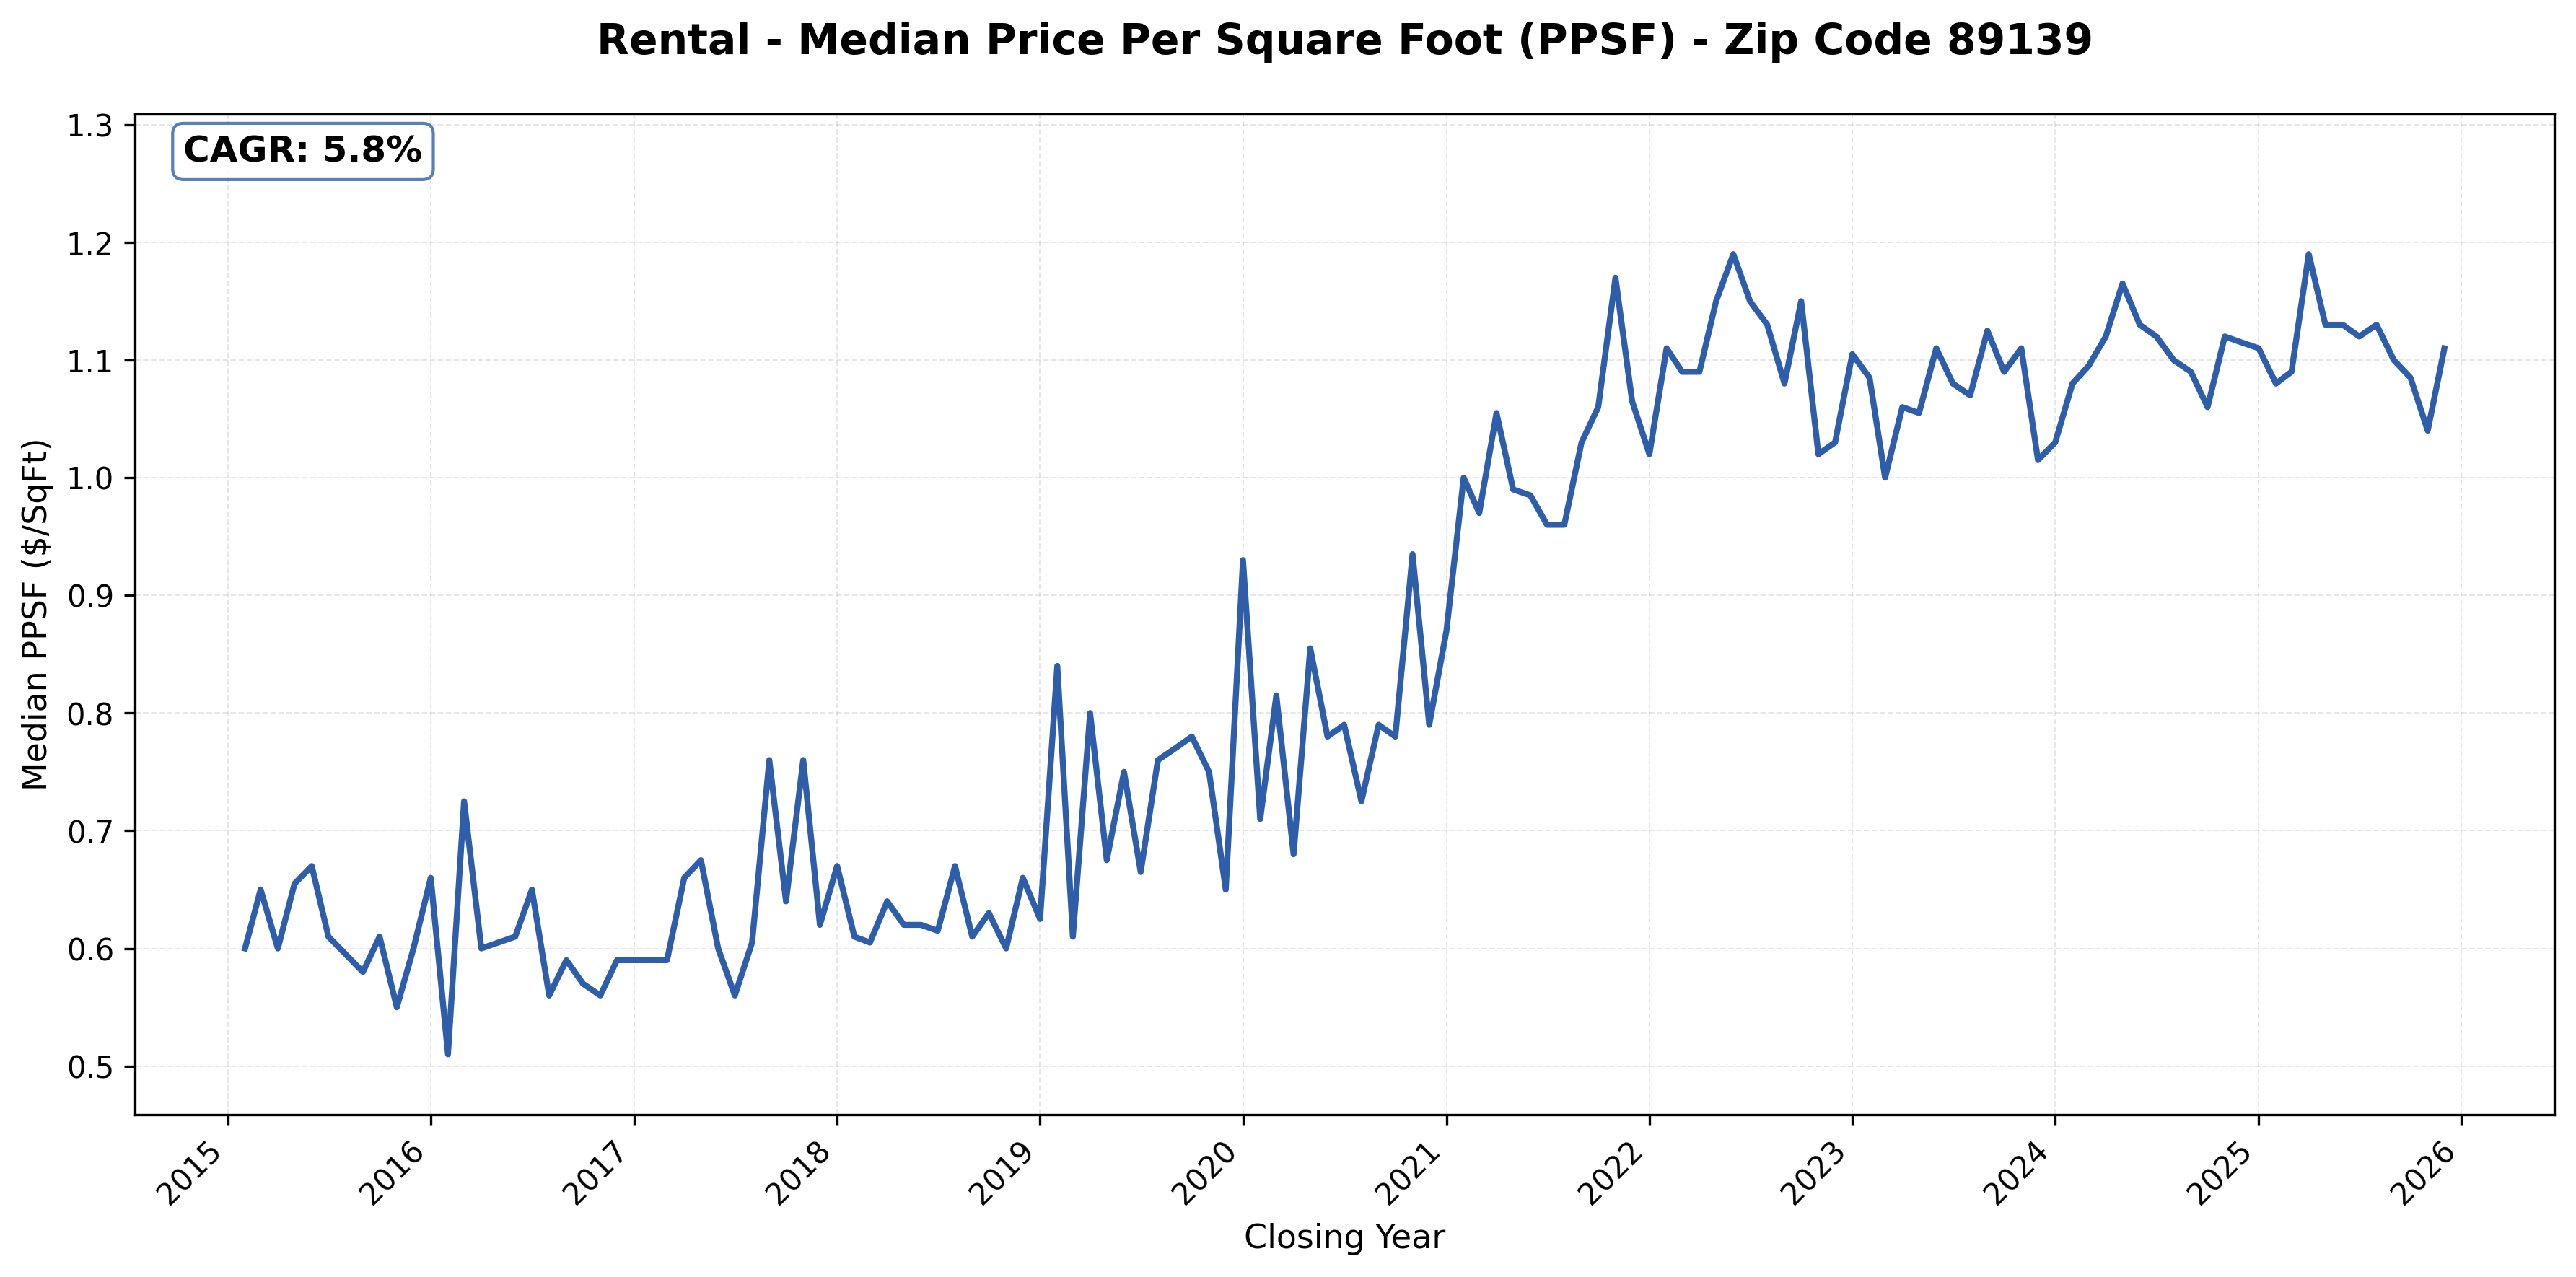
Below are individual zip code rent growth charts sorted from highest to lowest.
#1: 89123 (Silverado Ranch), 8.5% CAGR (Compound Annual Growth Rate).
#2: 89143 (Centennial Hills), 8.1% CAGR.
#3: 89002 (Black Mountain, Henderson), 7.7% CAGR.)
#4: 89149 (Northwest, Centennial Hills), 7.2% CAGR.
#5: 89183 (Silverado Ranch South), 7.1% CAGR.
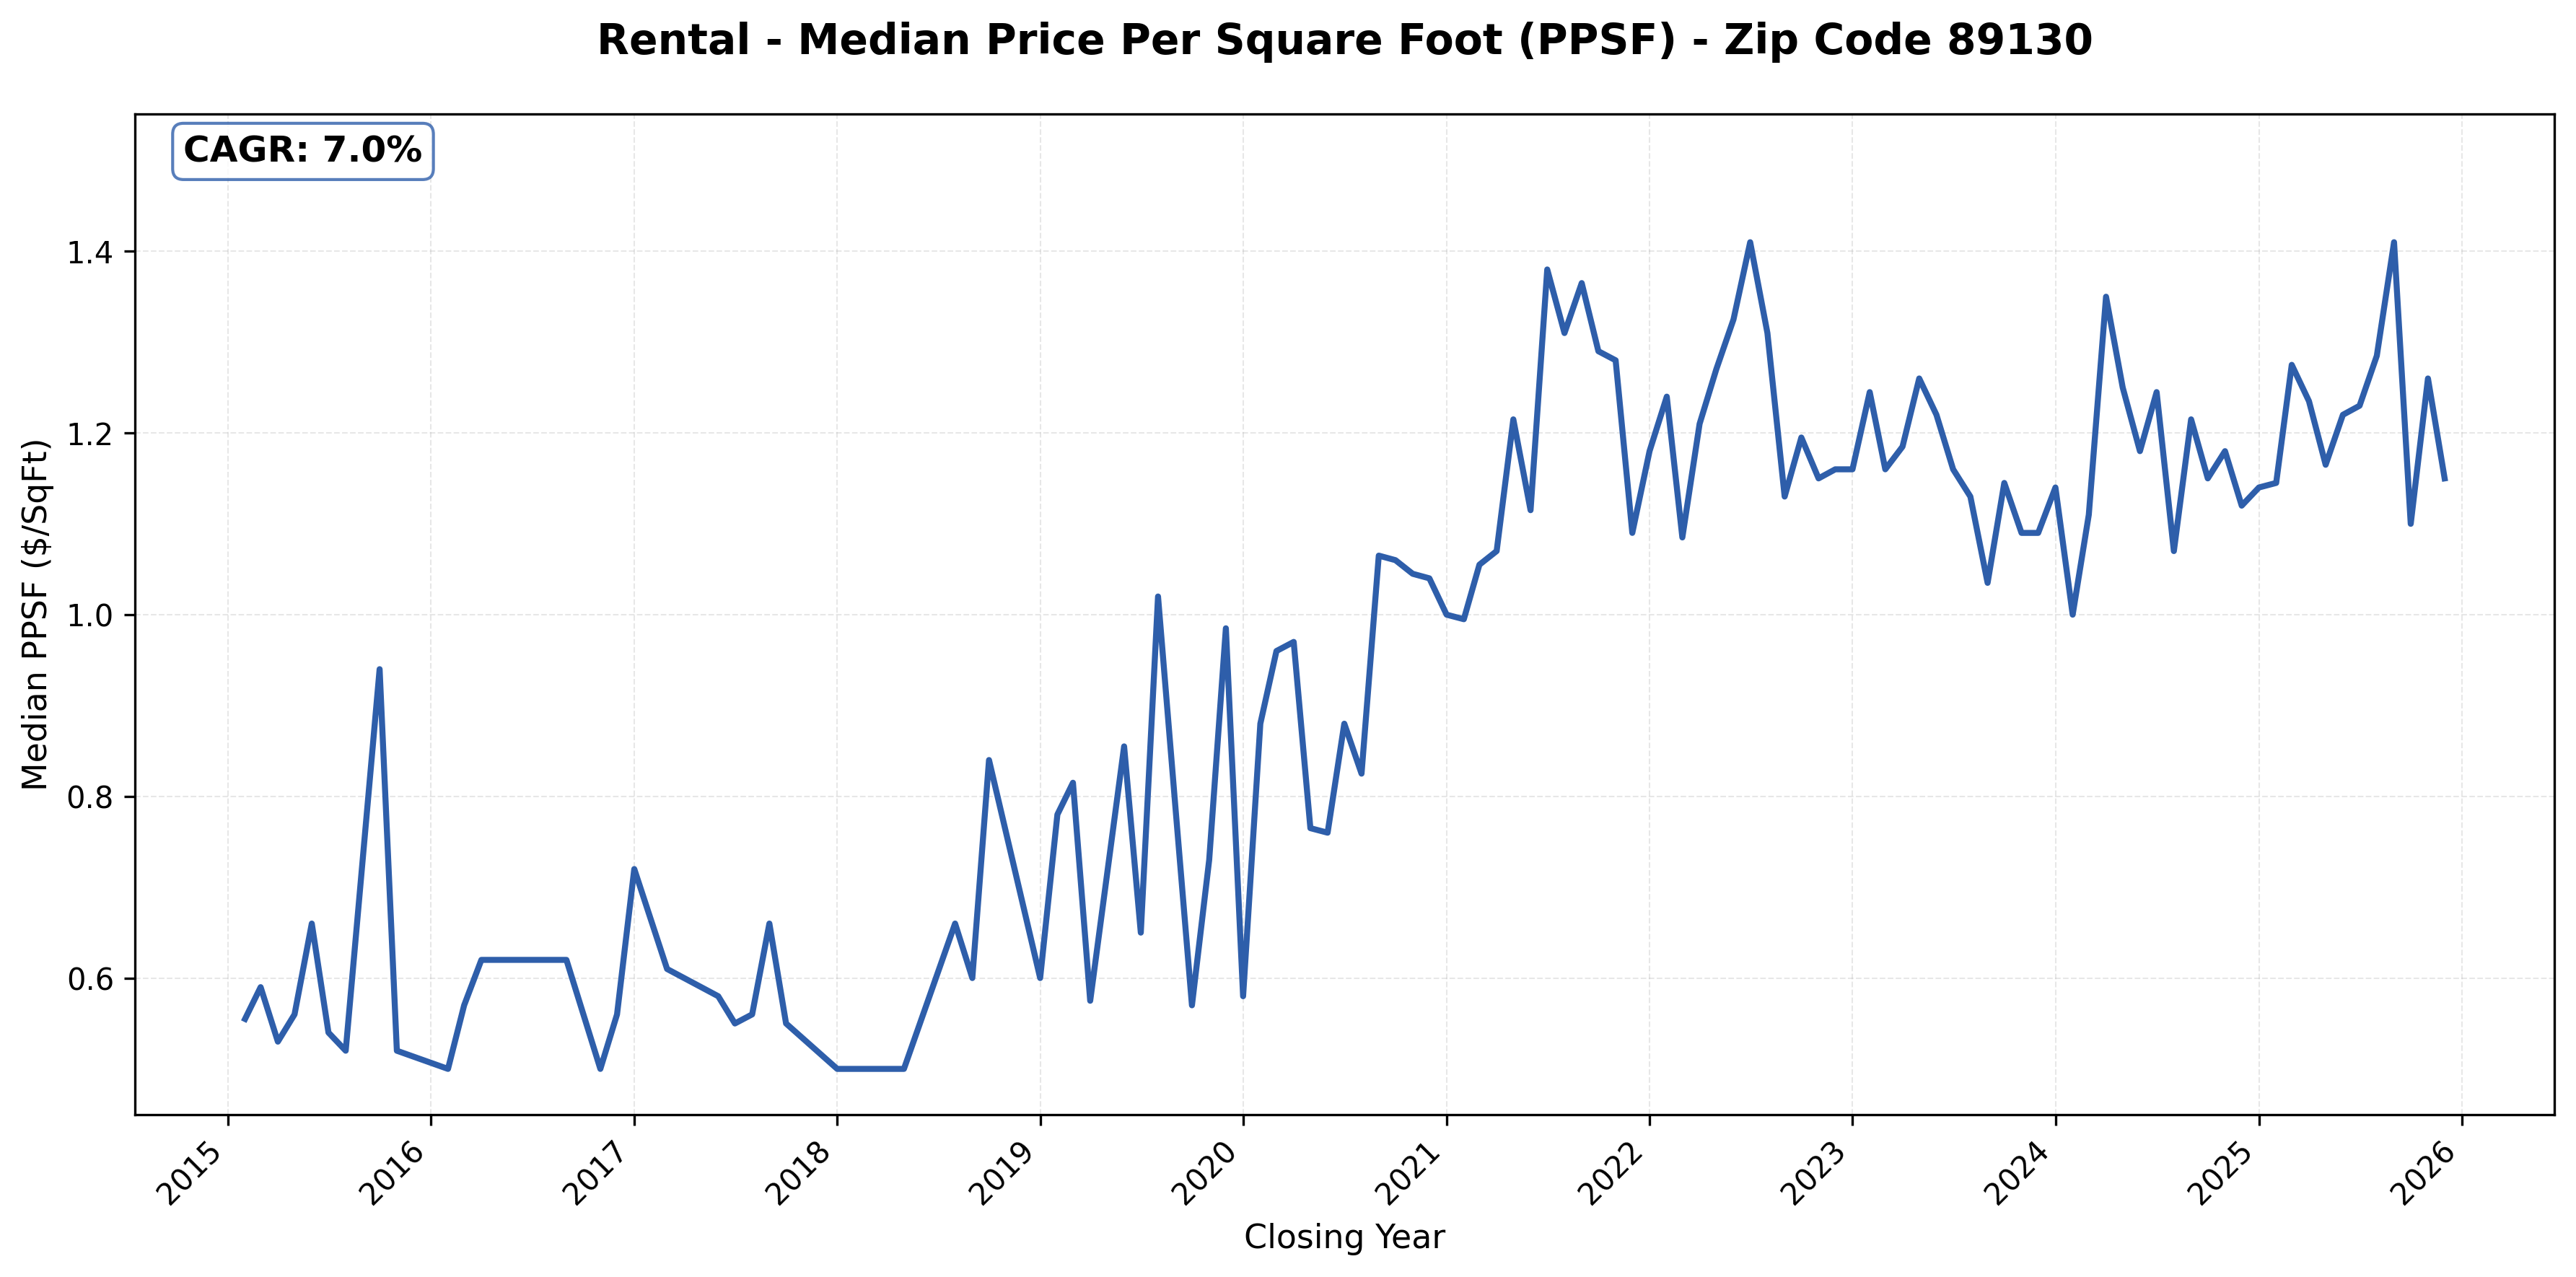
#6: 89130 (Northwest, Centennial Hills), 7.0% CAGR
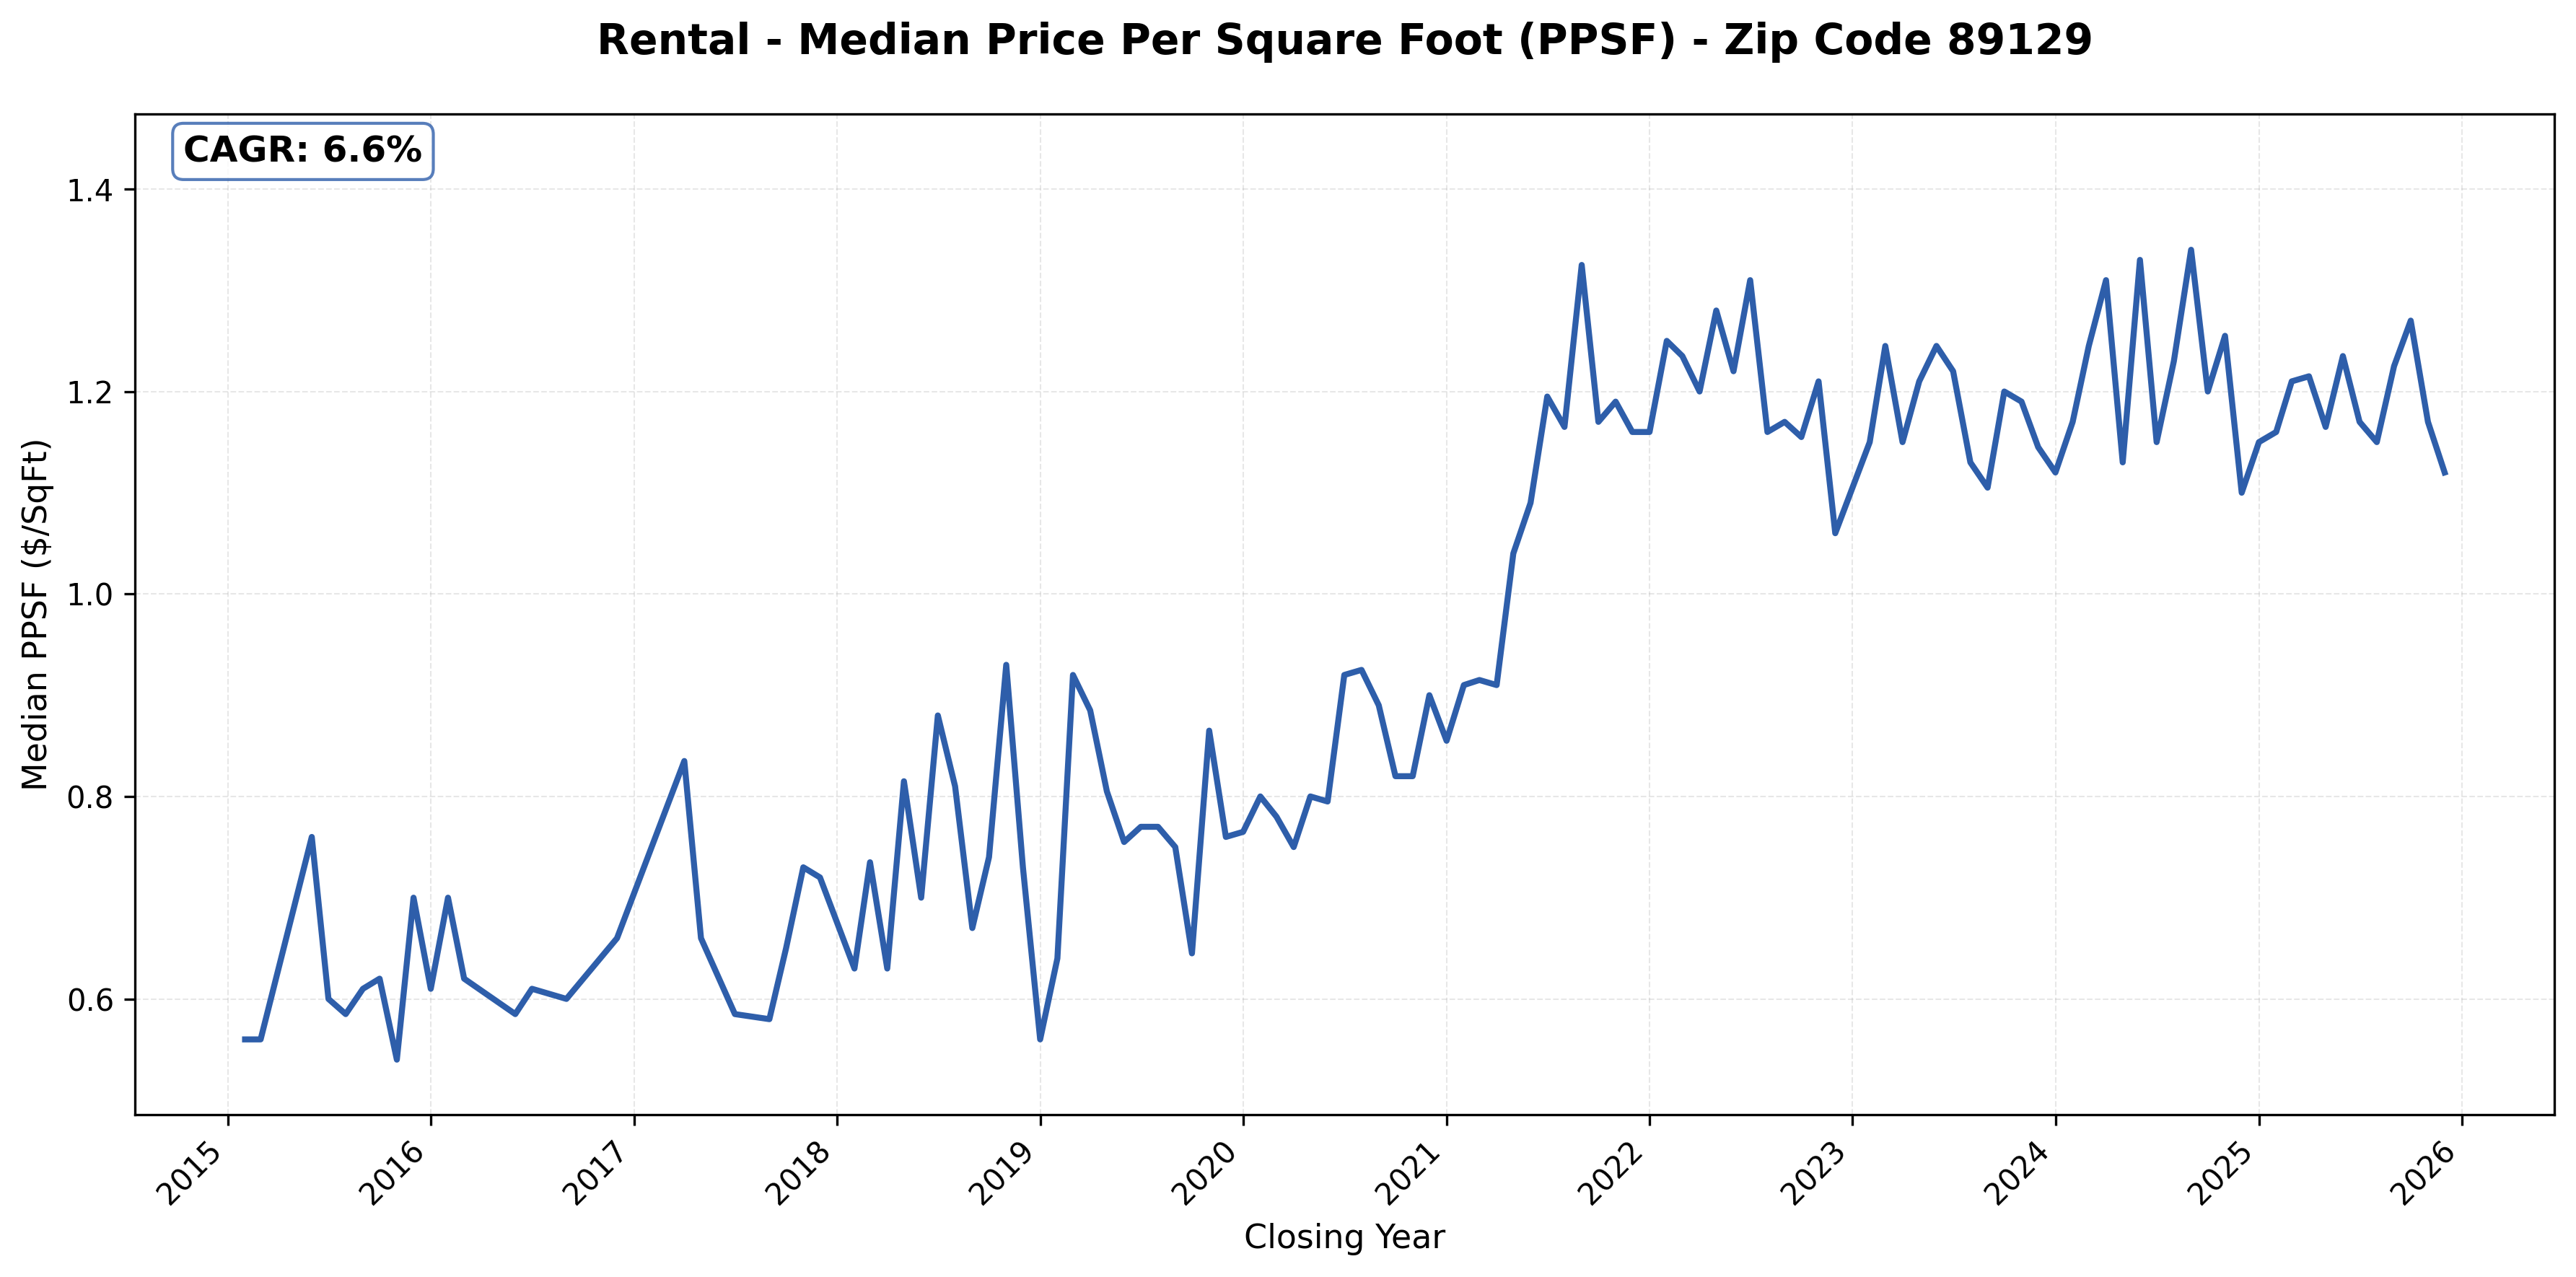
#7: 89129 (Northwest, Lone Mountain), 6.6% CAGR
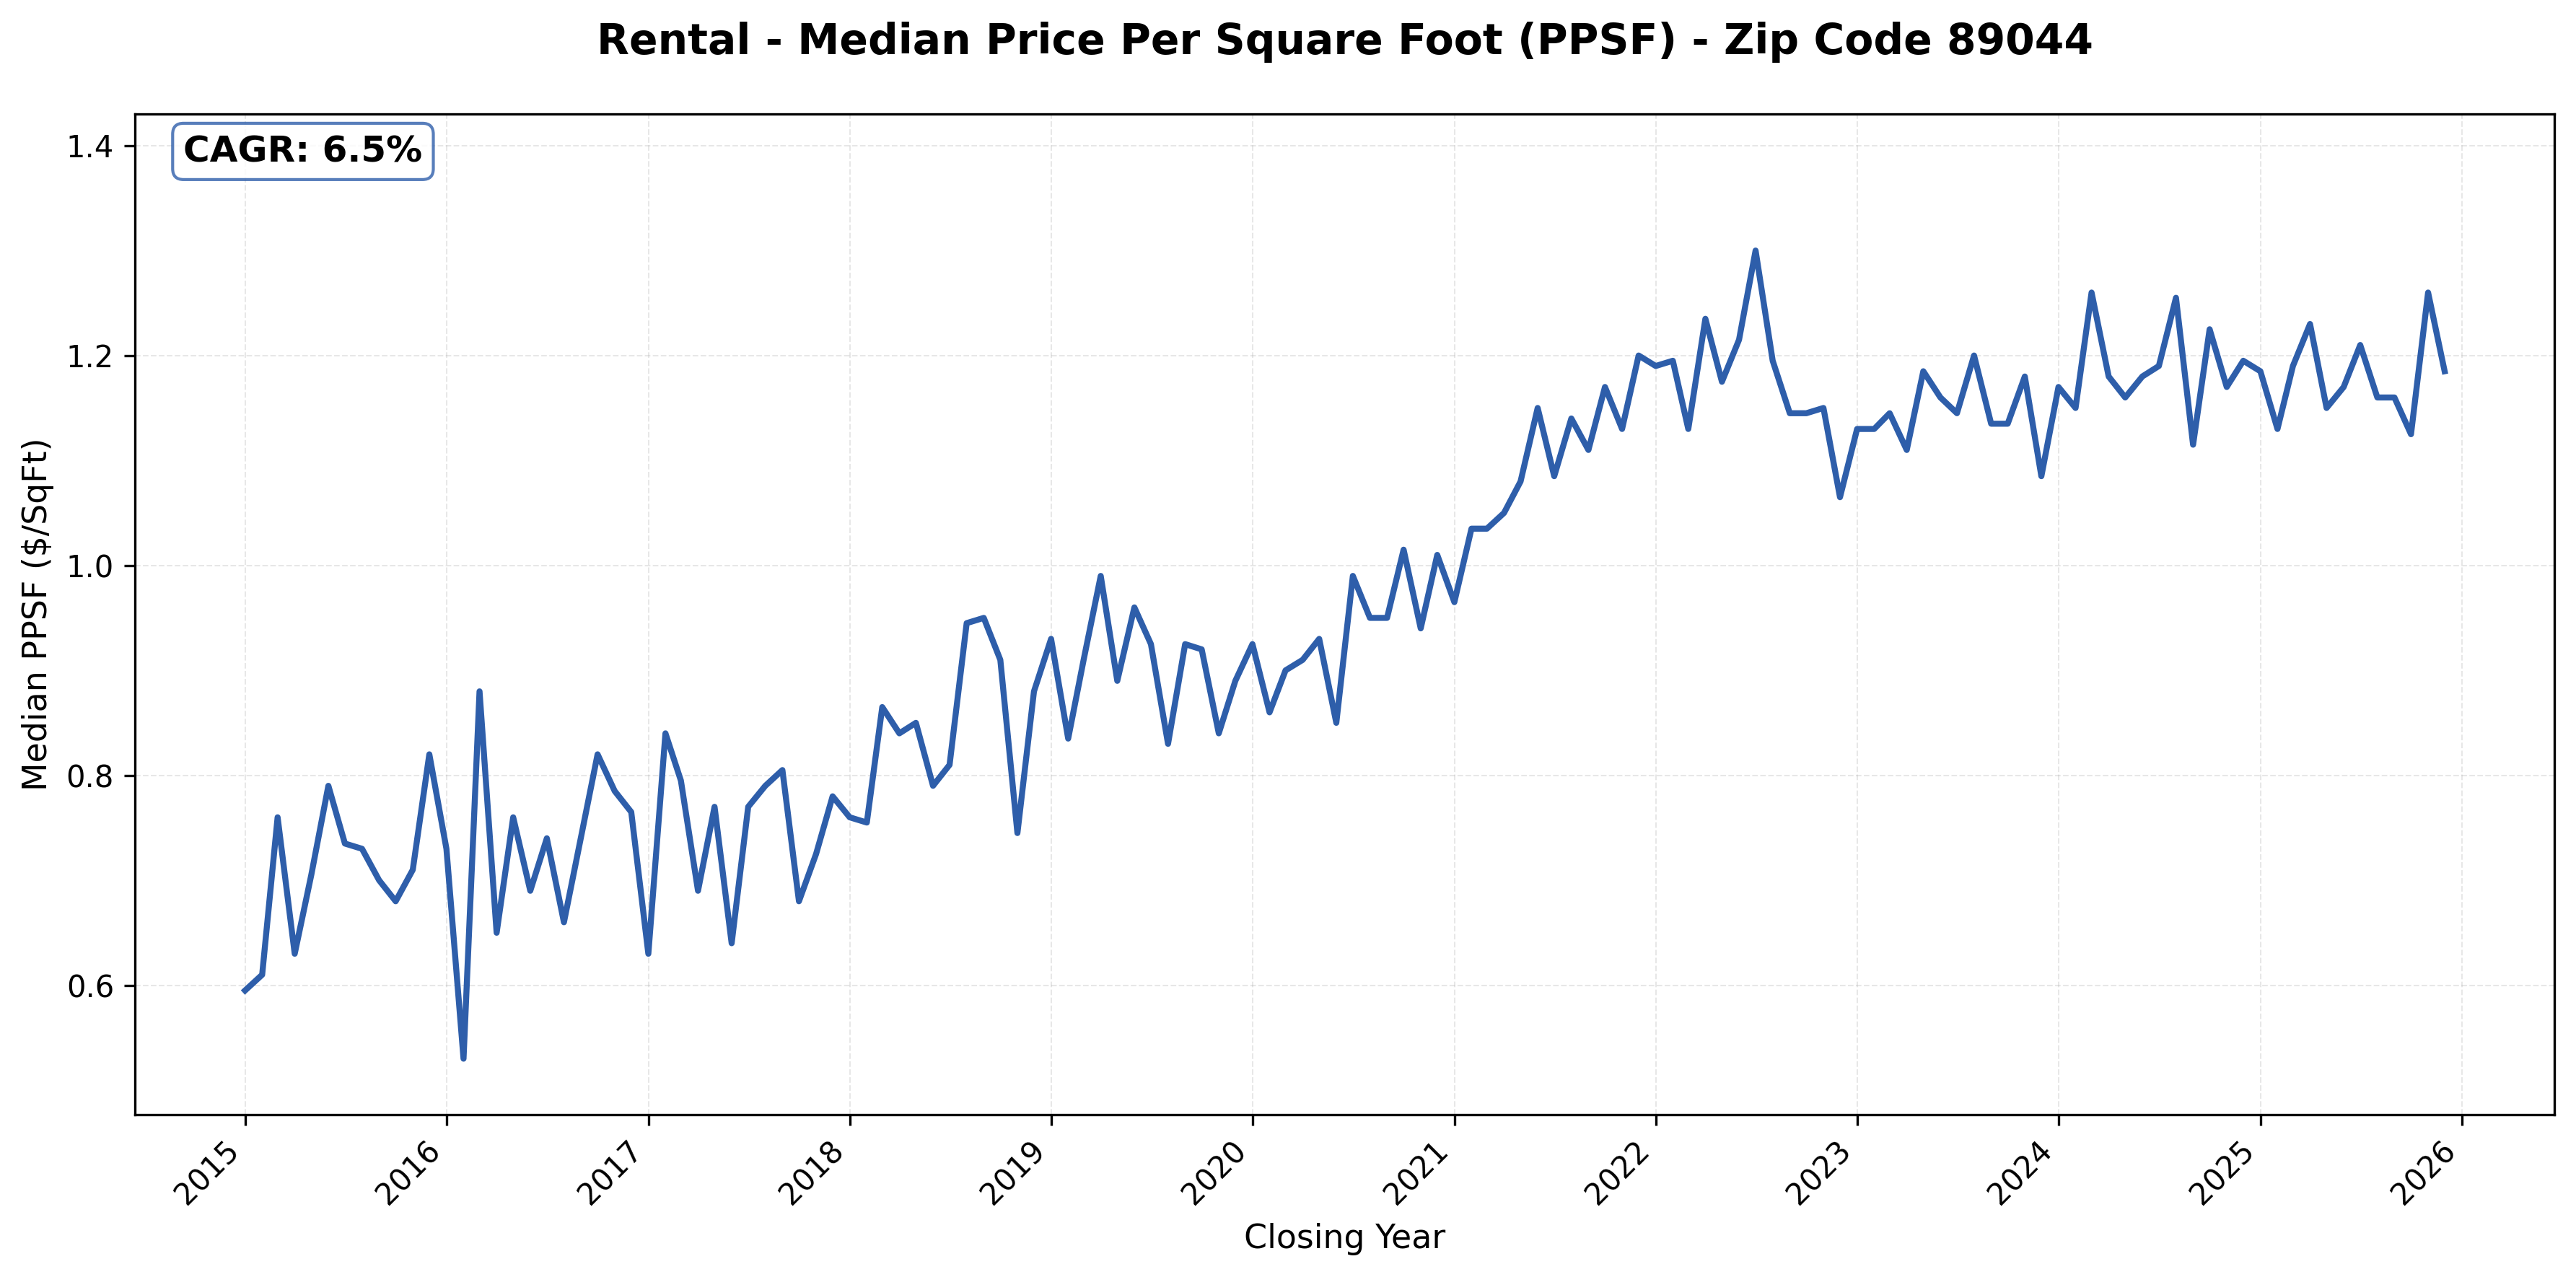
#8: 89044 (Southwest Henderson, Inspirada), 6.5% CAGR
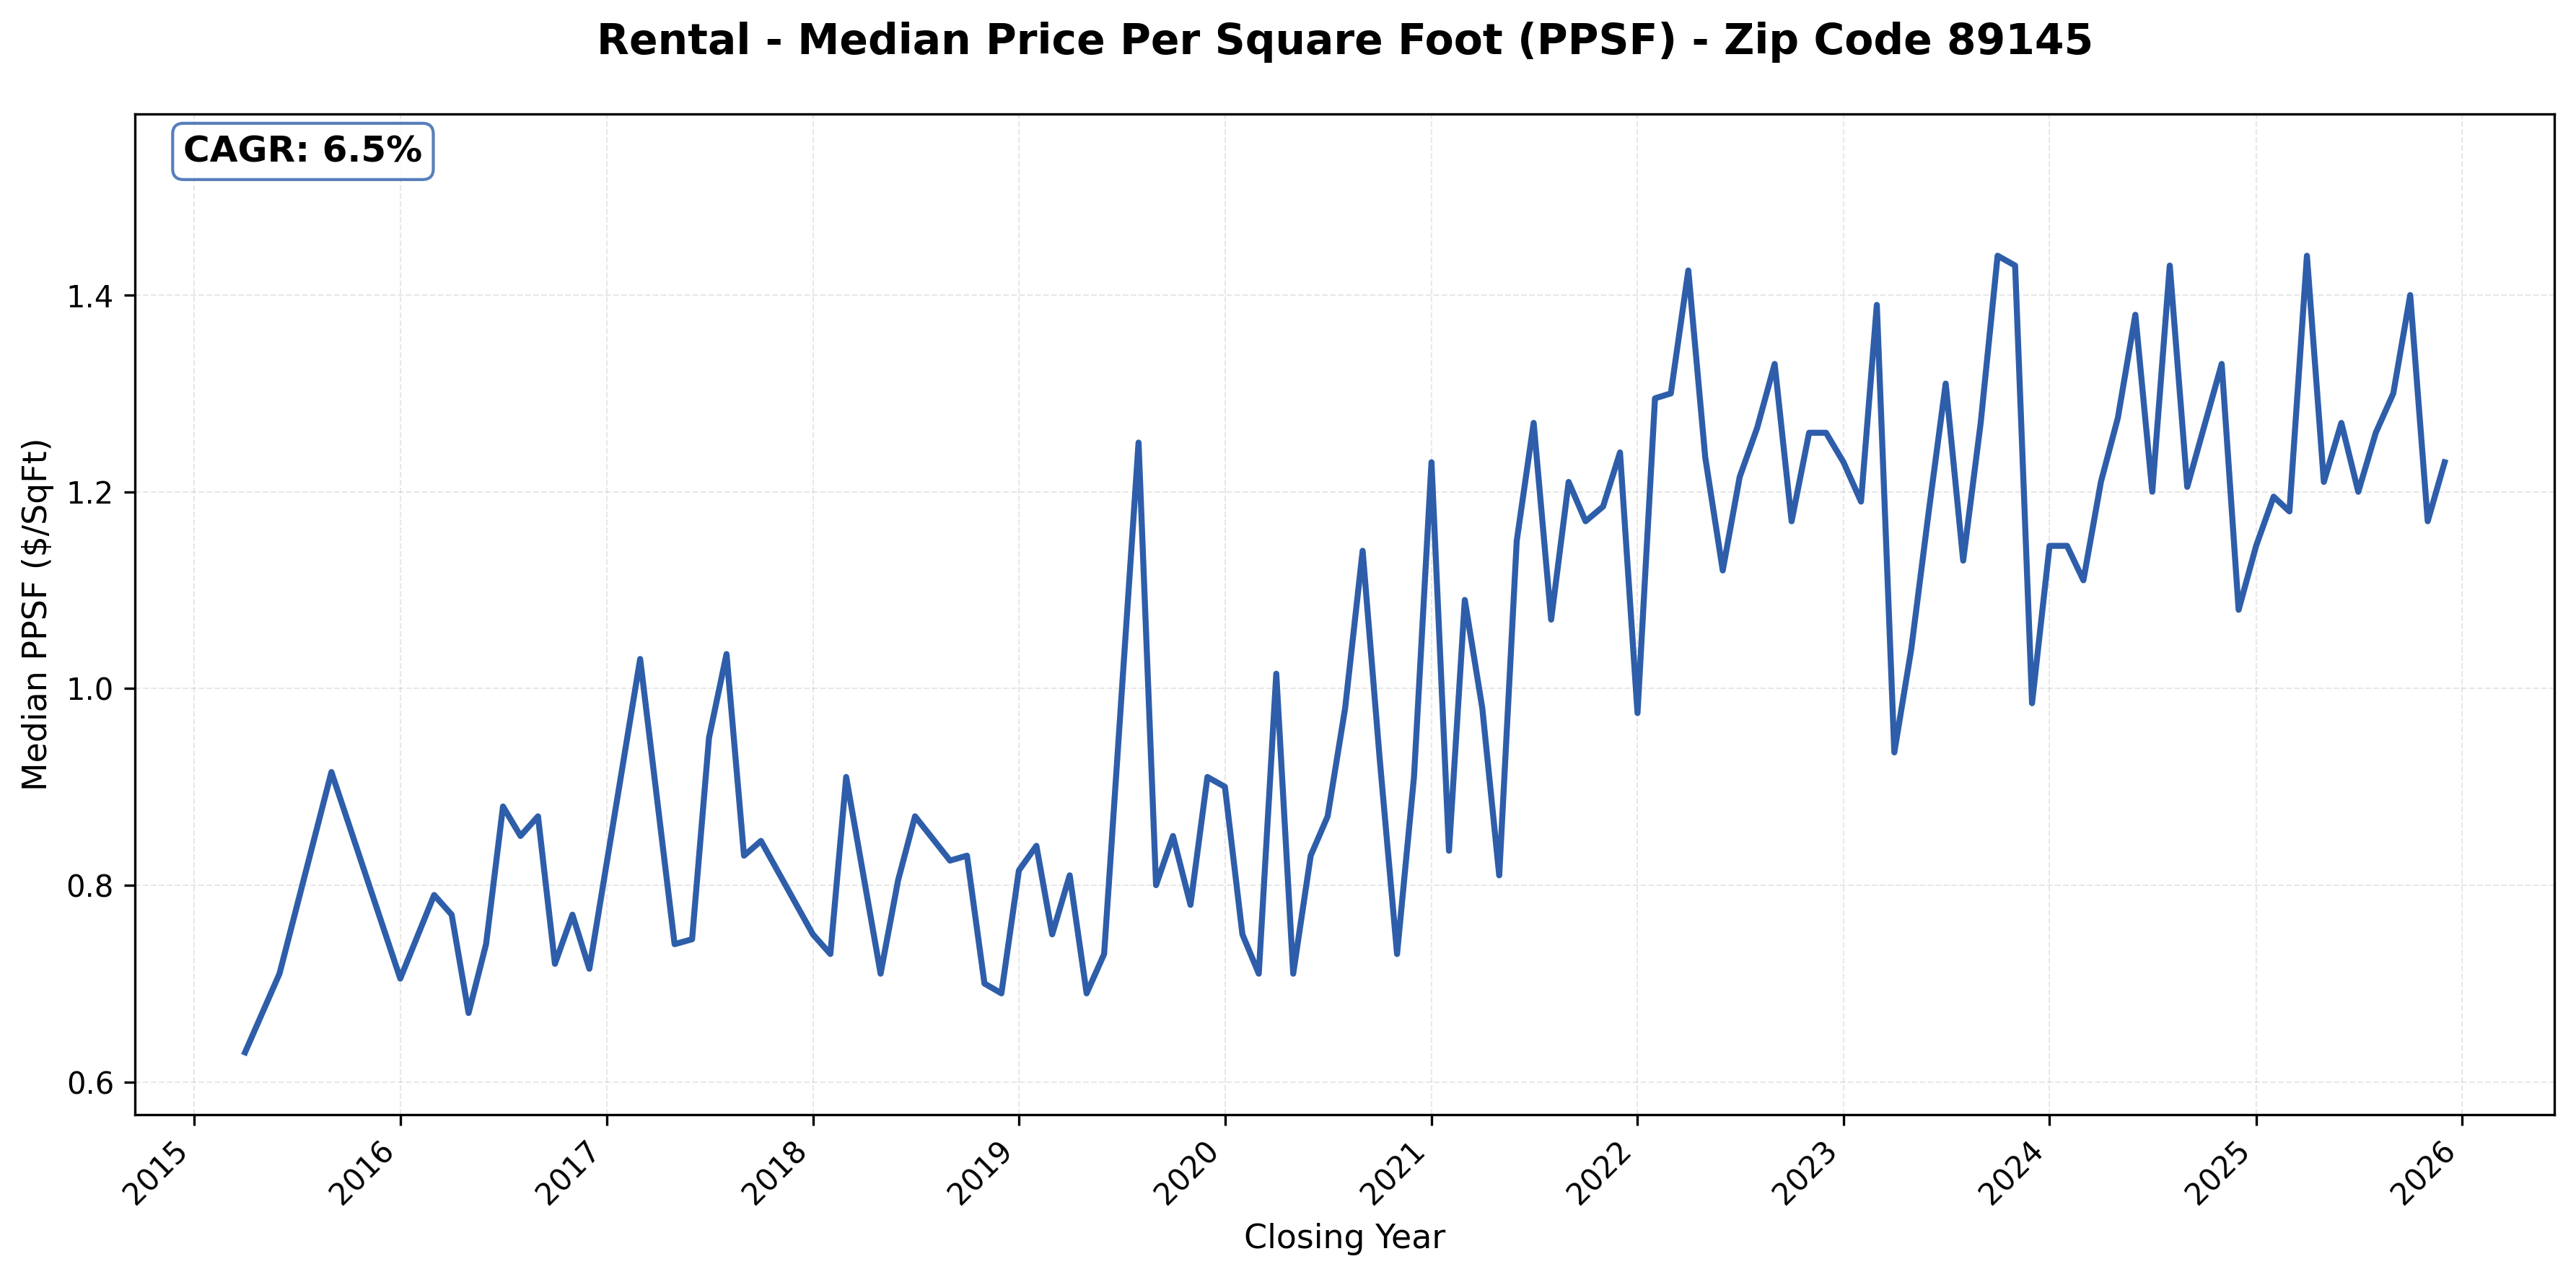
#9: 89145 (West, Summerlin adjacent), 6.5% CAGR.
#10: 89131 (Centennial Hills), 6.4% CAGR
#11: 89074 (Green Valley, Henderson), 6.2% CAGR
#12: 89166 (Centennial Hills), 6.2% CAGR
#13: 89139 (Southwest, Blue Diamond), 5.8% CAGR
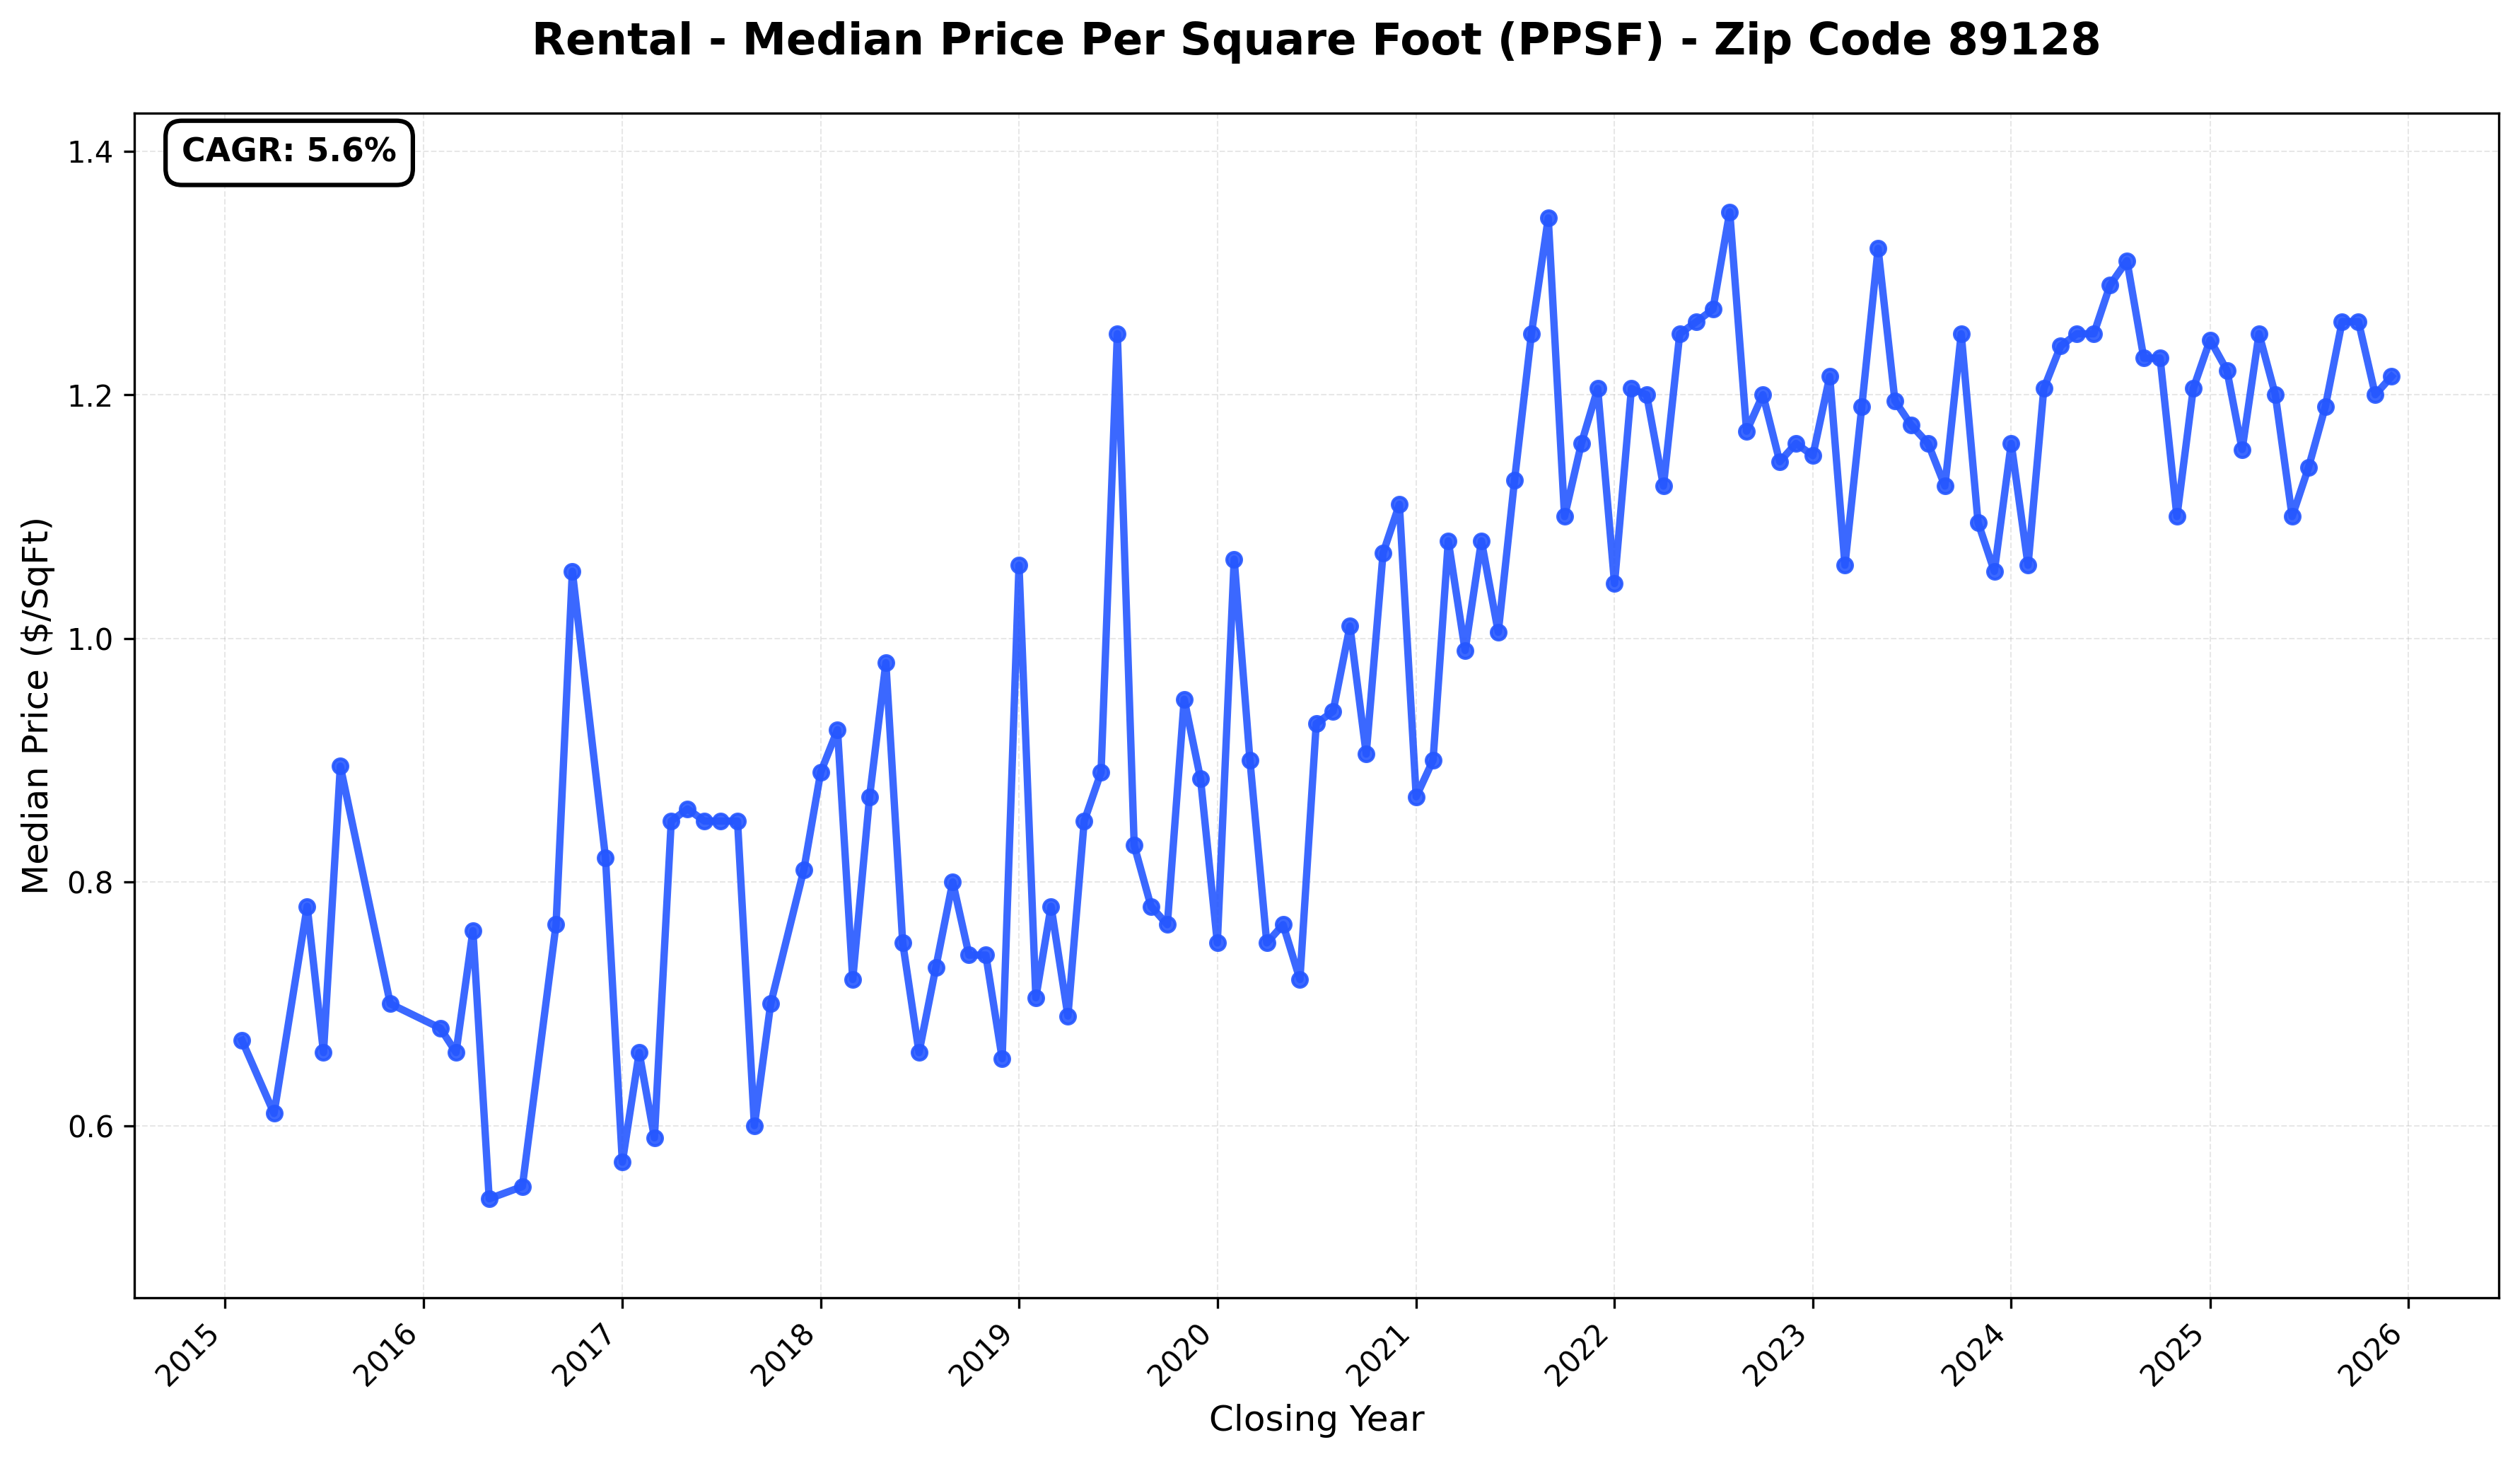
#14: 89128 (Northwest, Desert Shores), 5.6% CAGR.
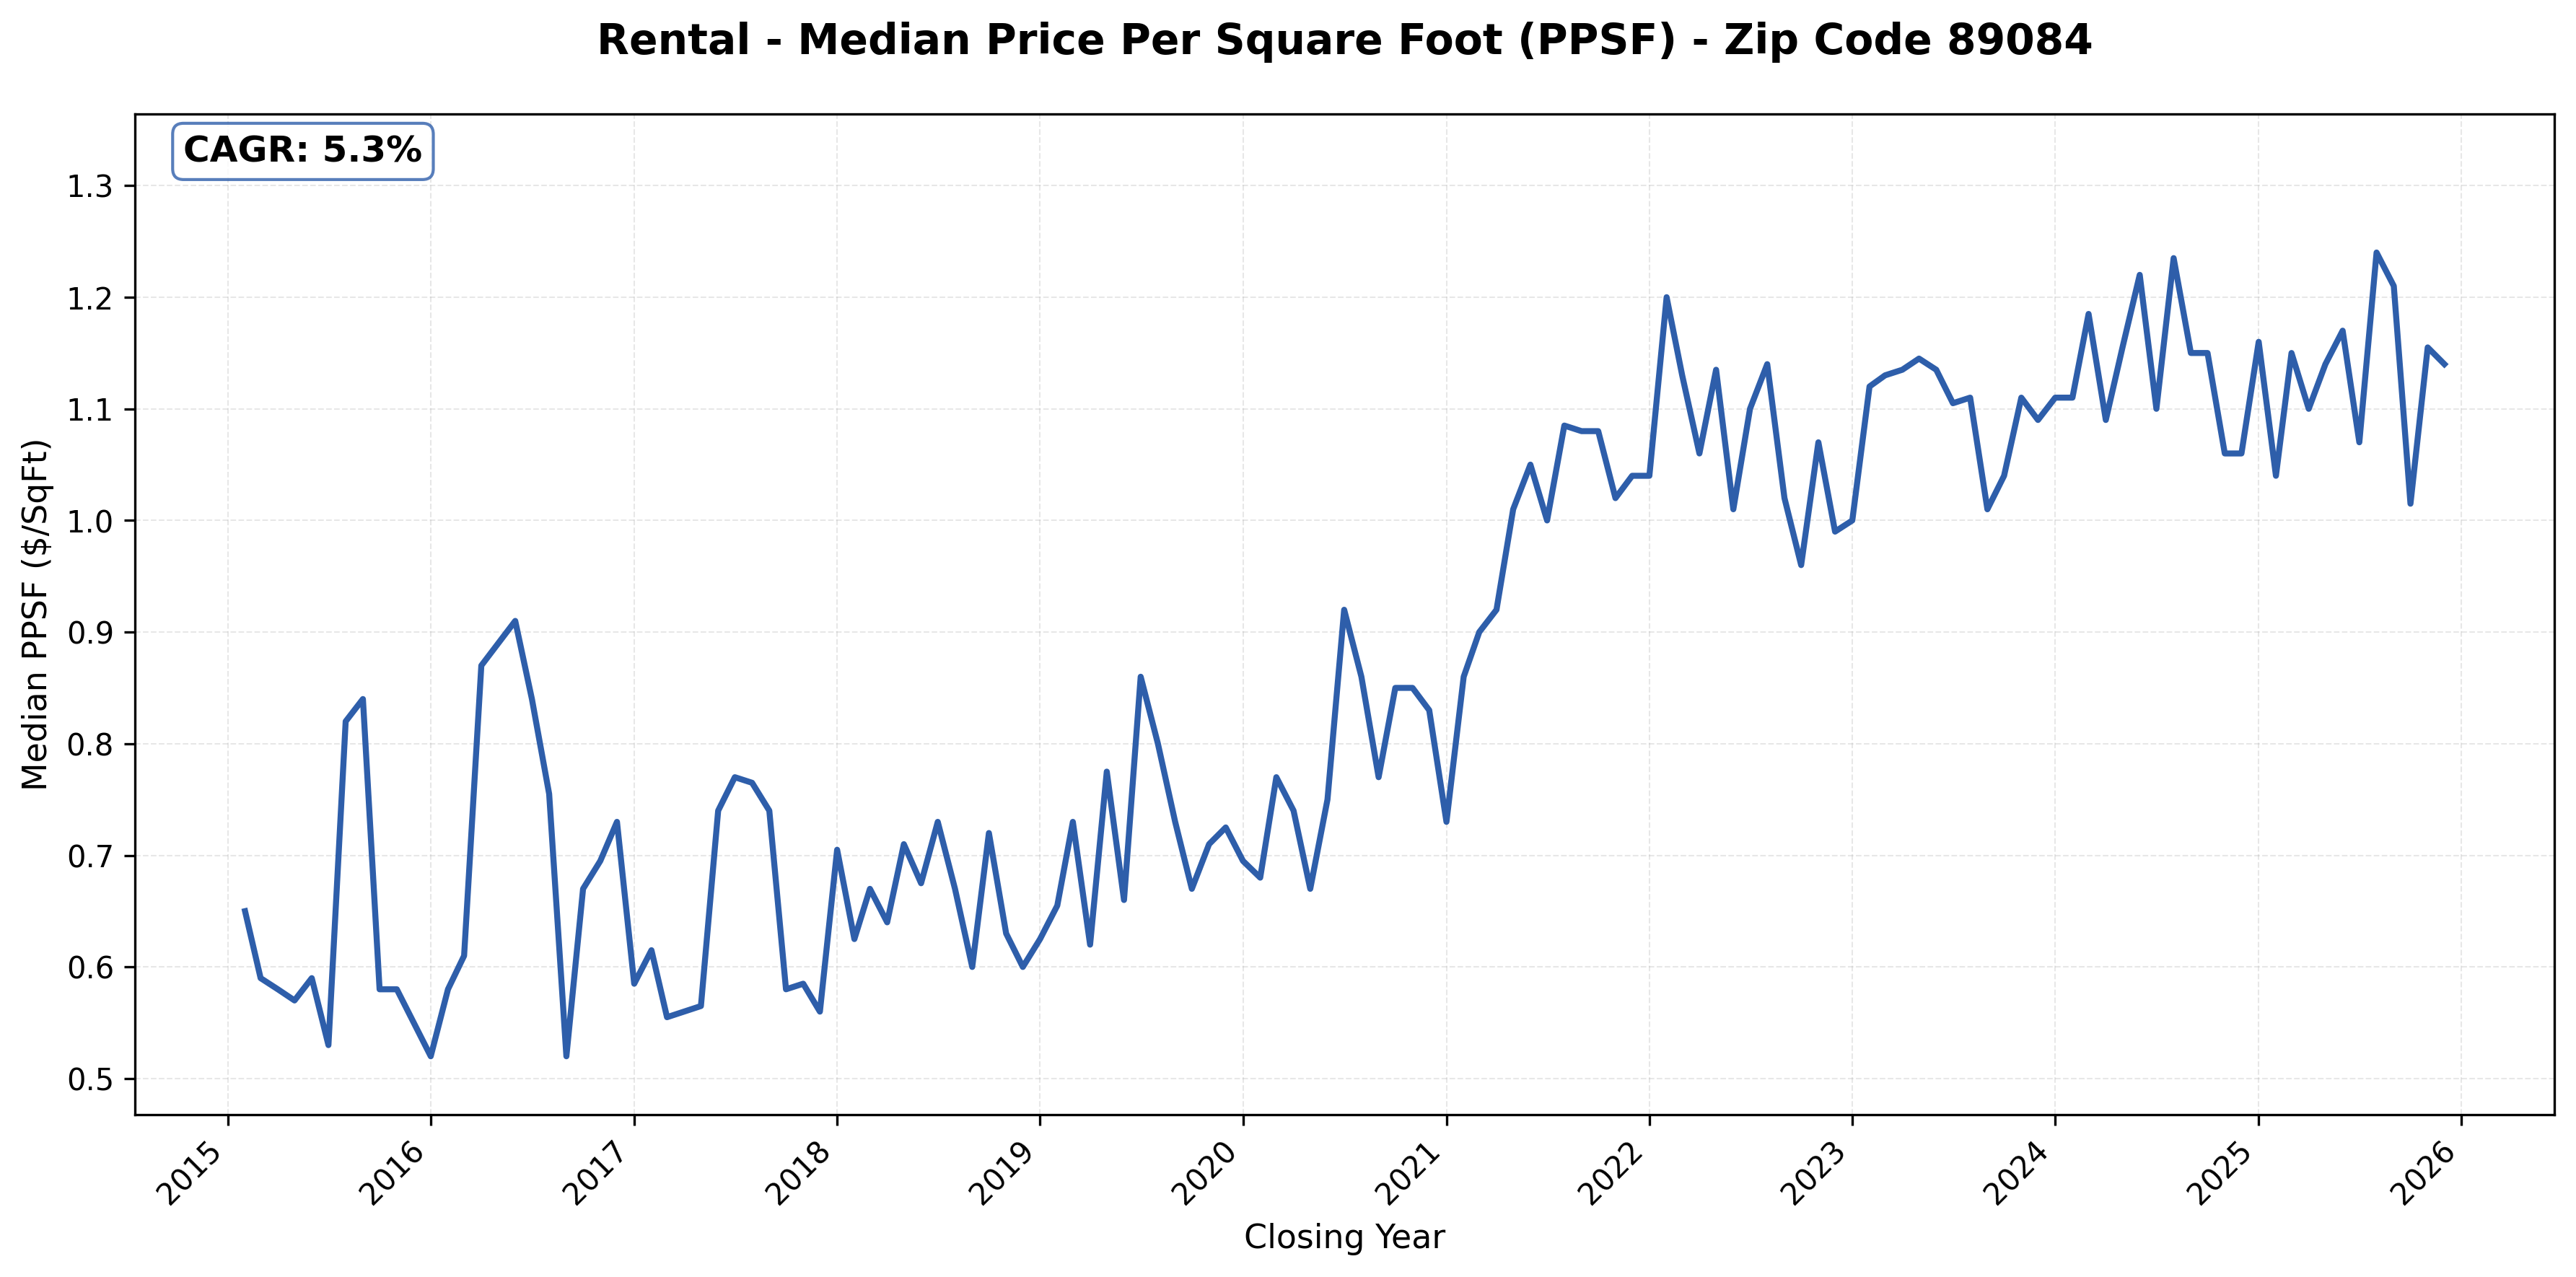
#15: 89084 (Aliante, North Las Vegas), 5.3% CAGR
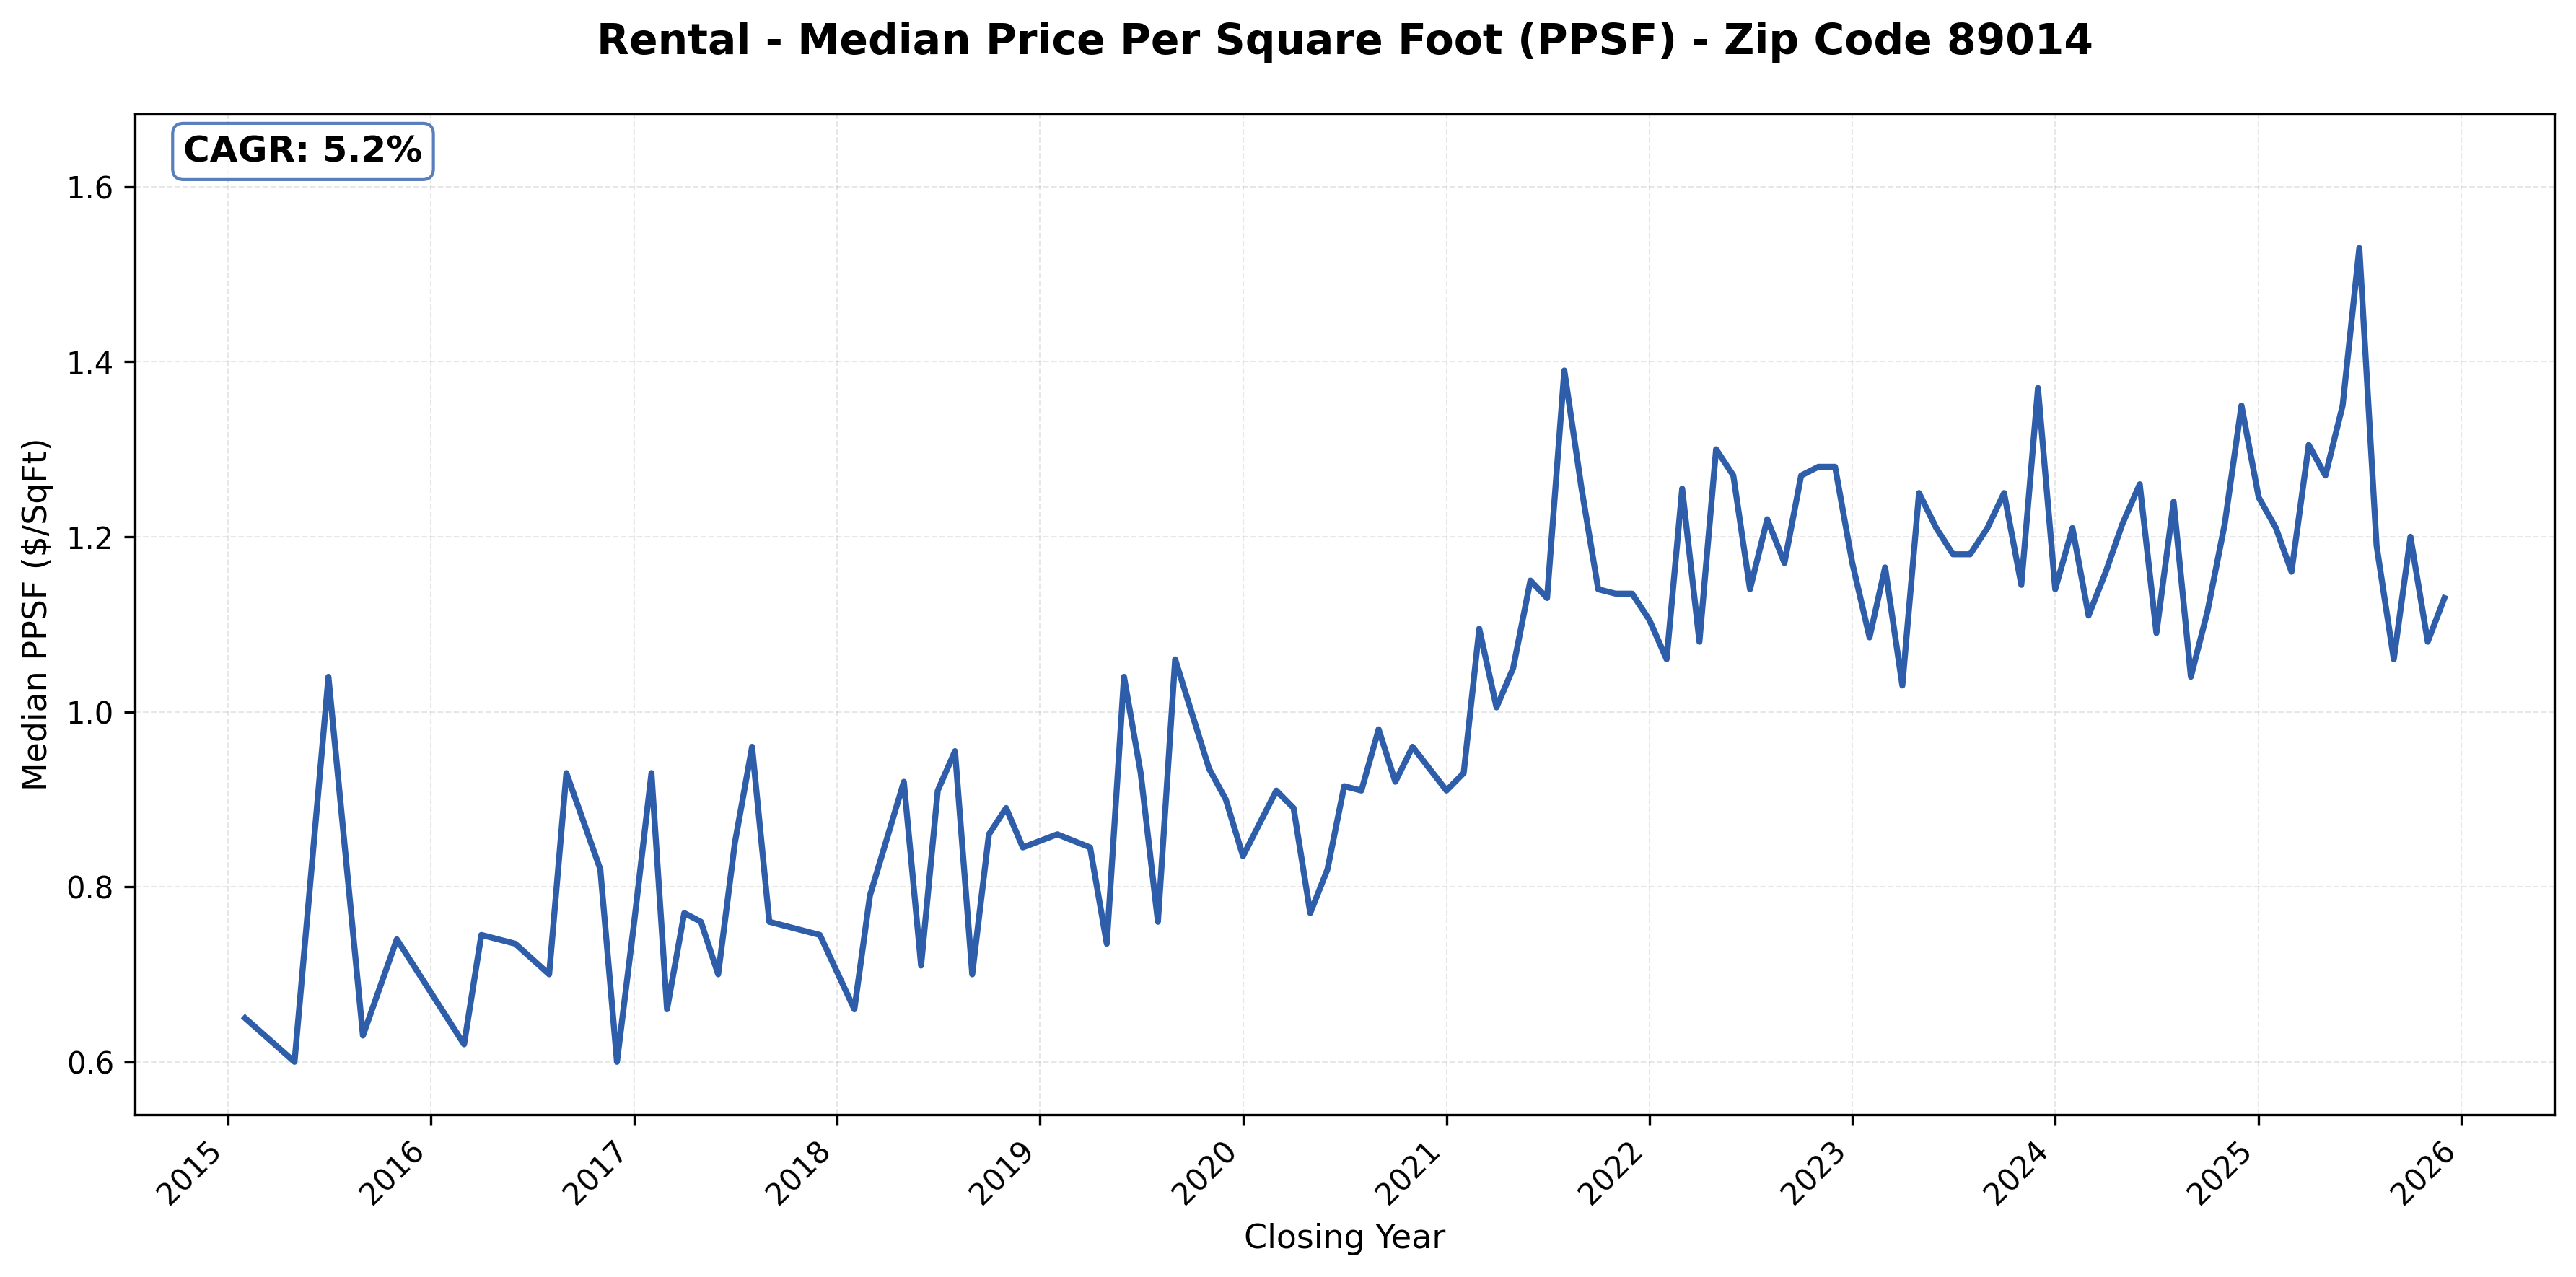
#16: 89014 (Green Valley North, Whitney Ranch, Henderson), 5.2% CAGR
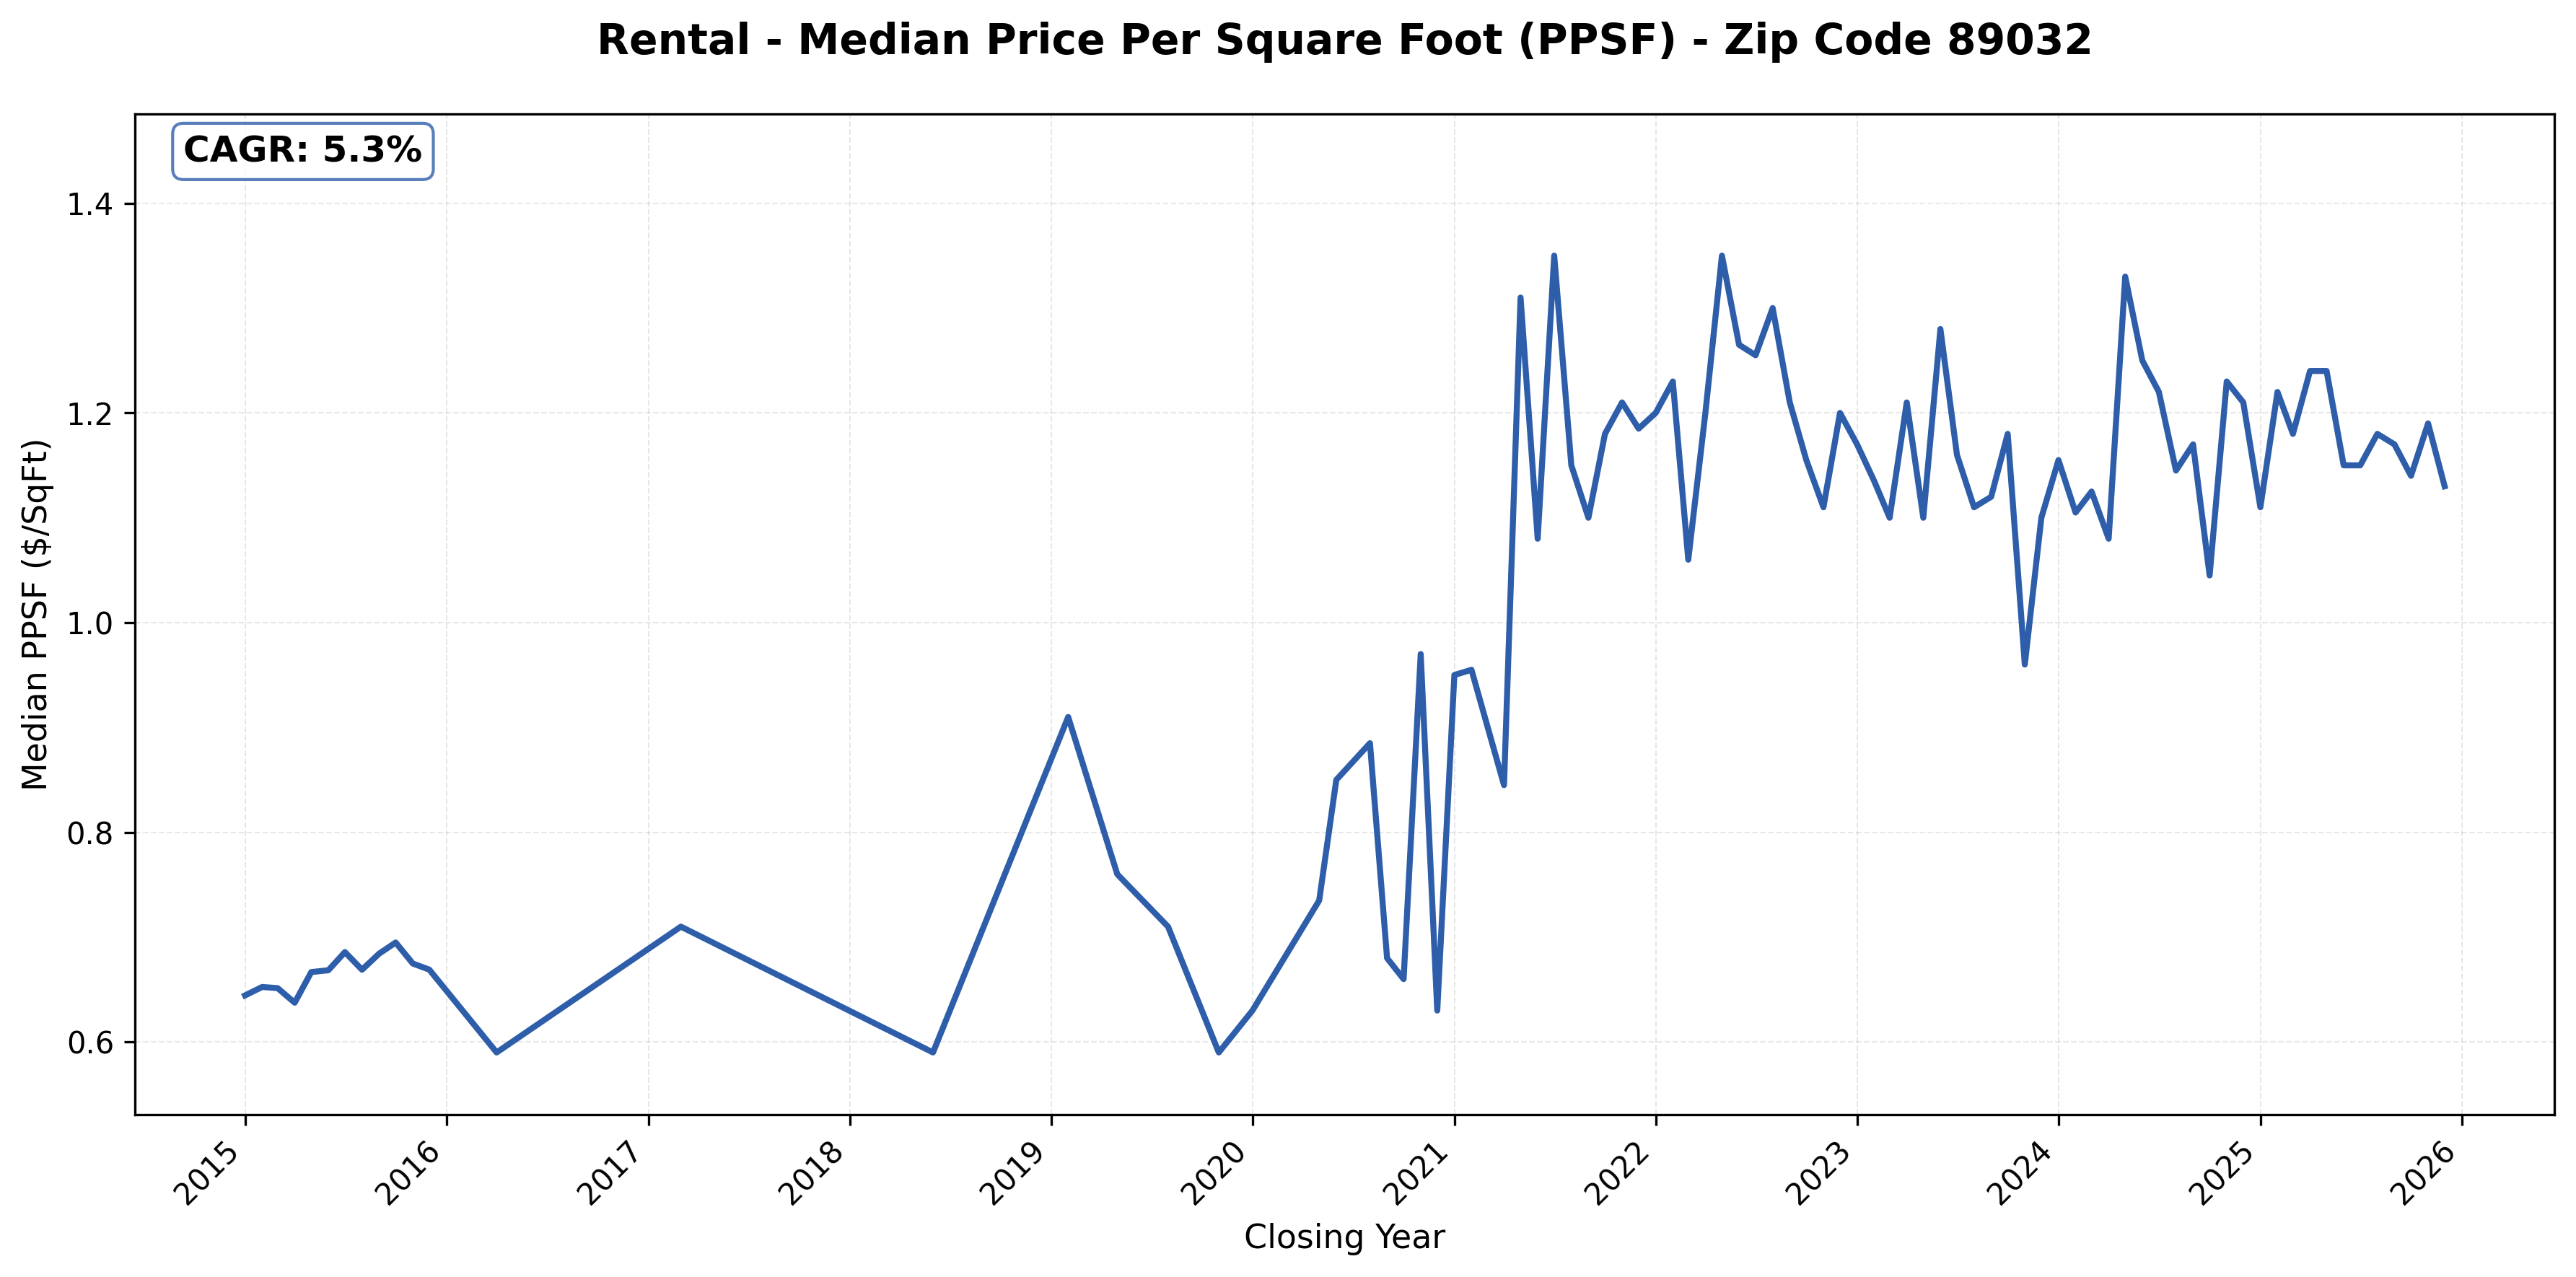
#17: 89032 (North Las Vegas), 5.3% CAGR
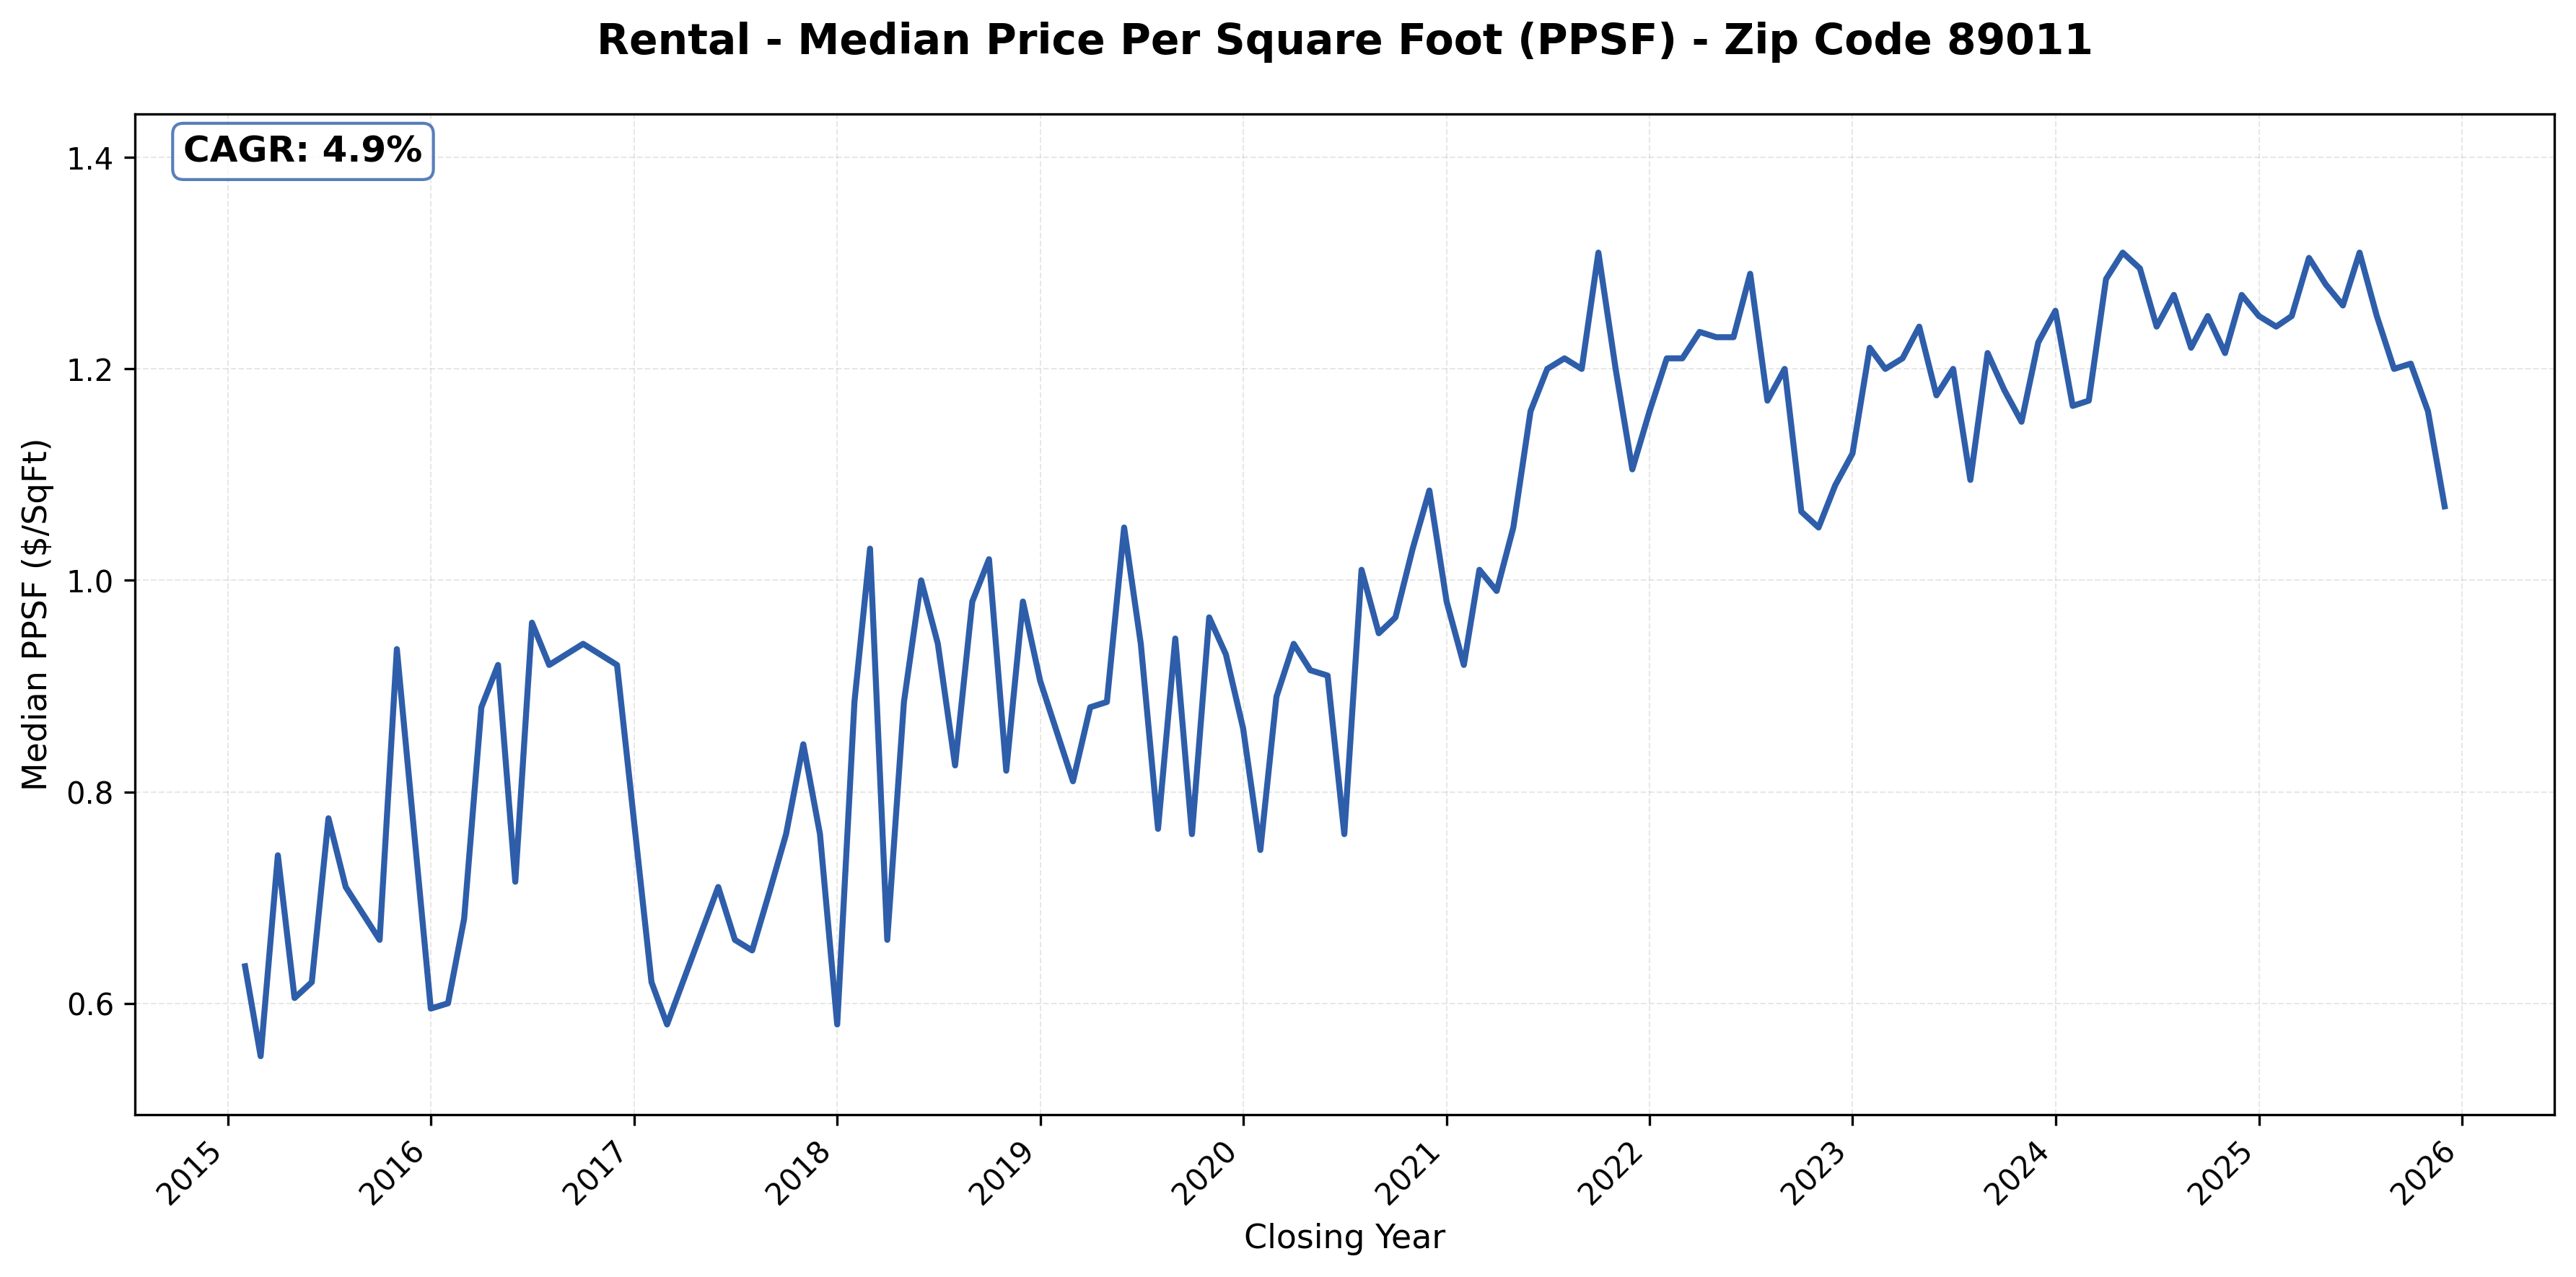
#18: 89011 (Cadence, Henderson), 4.9% CAGR.
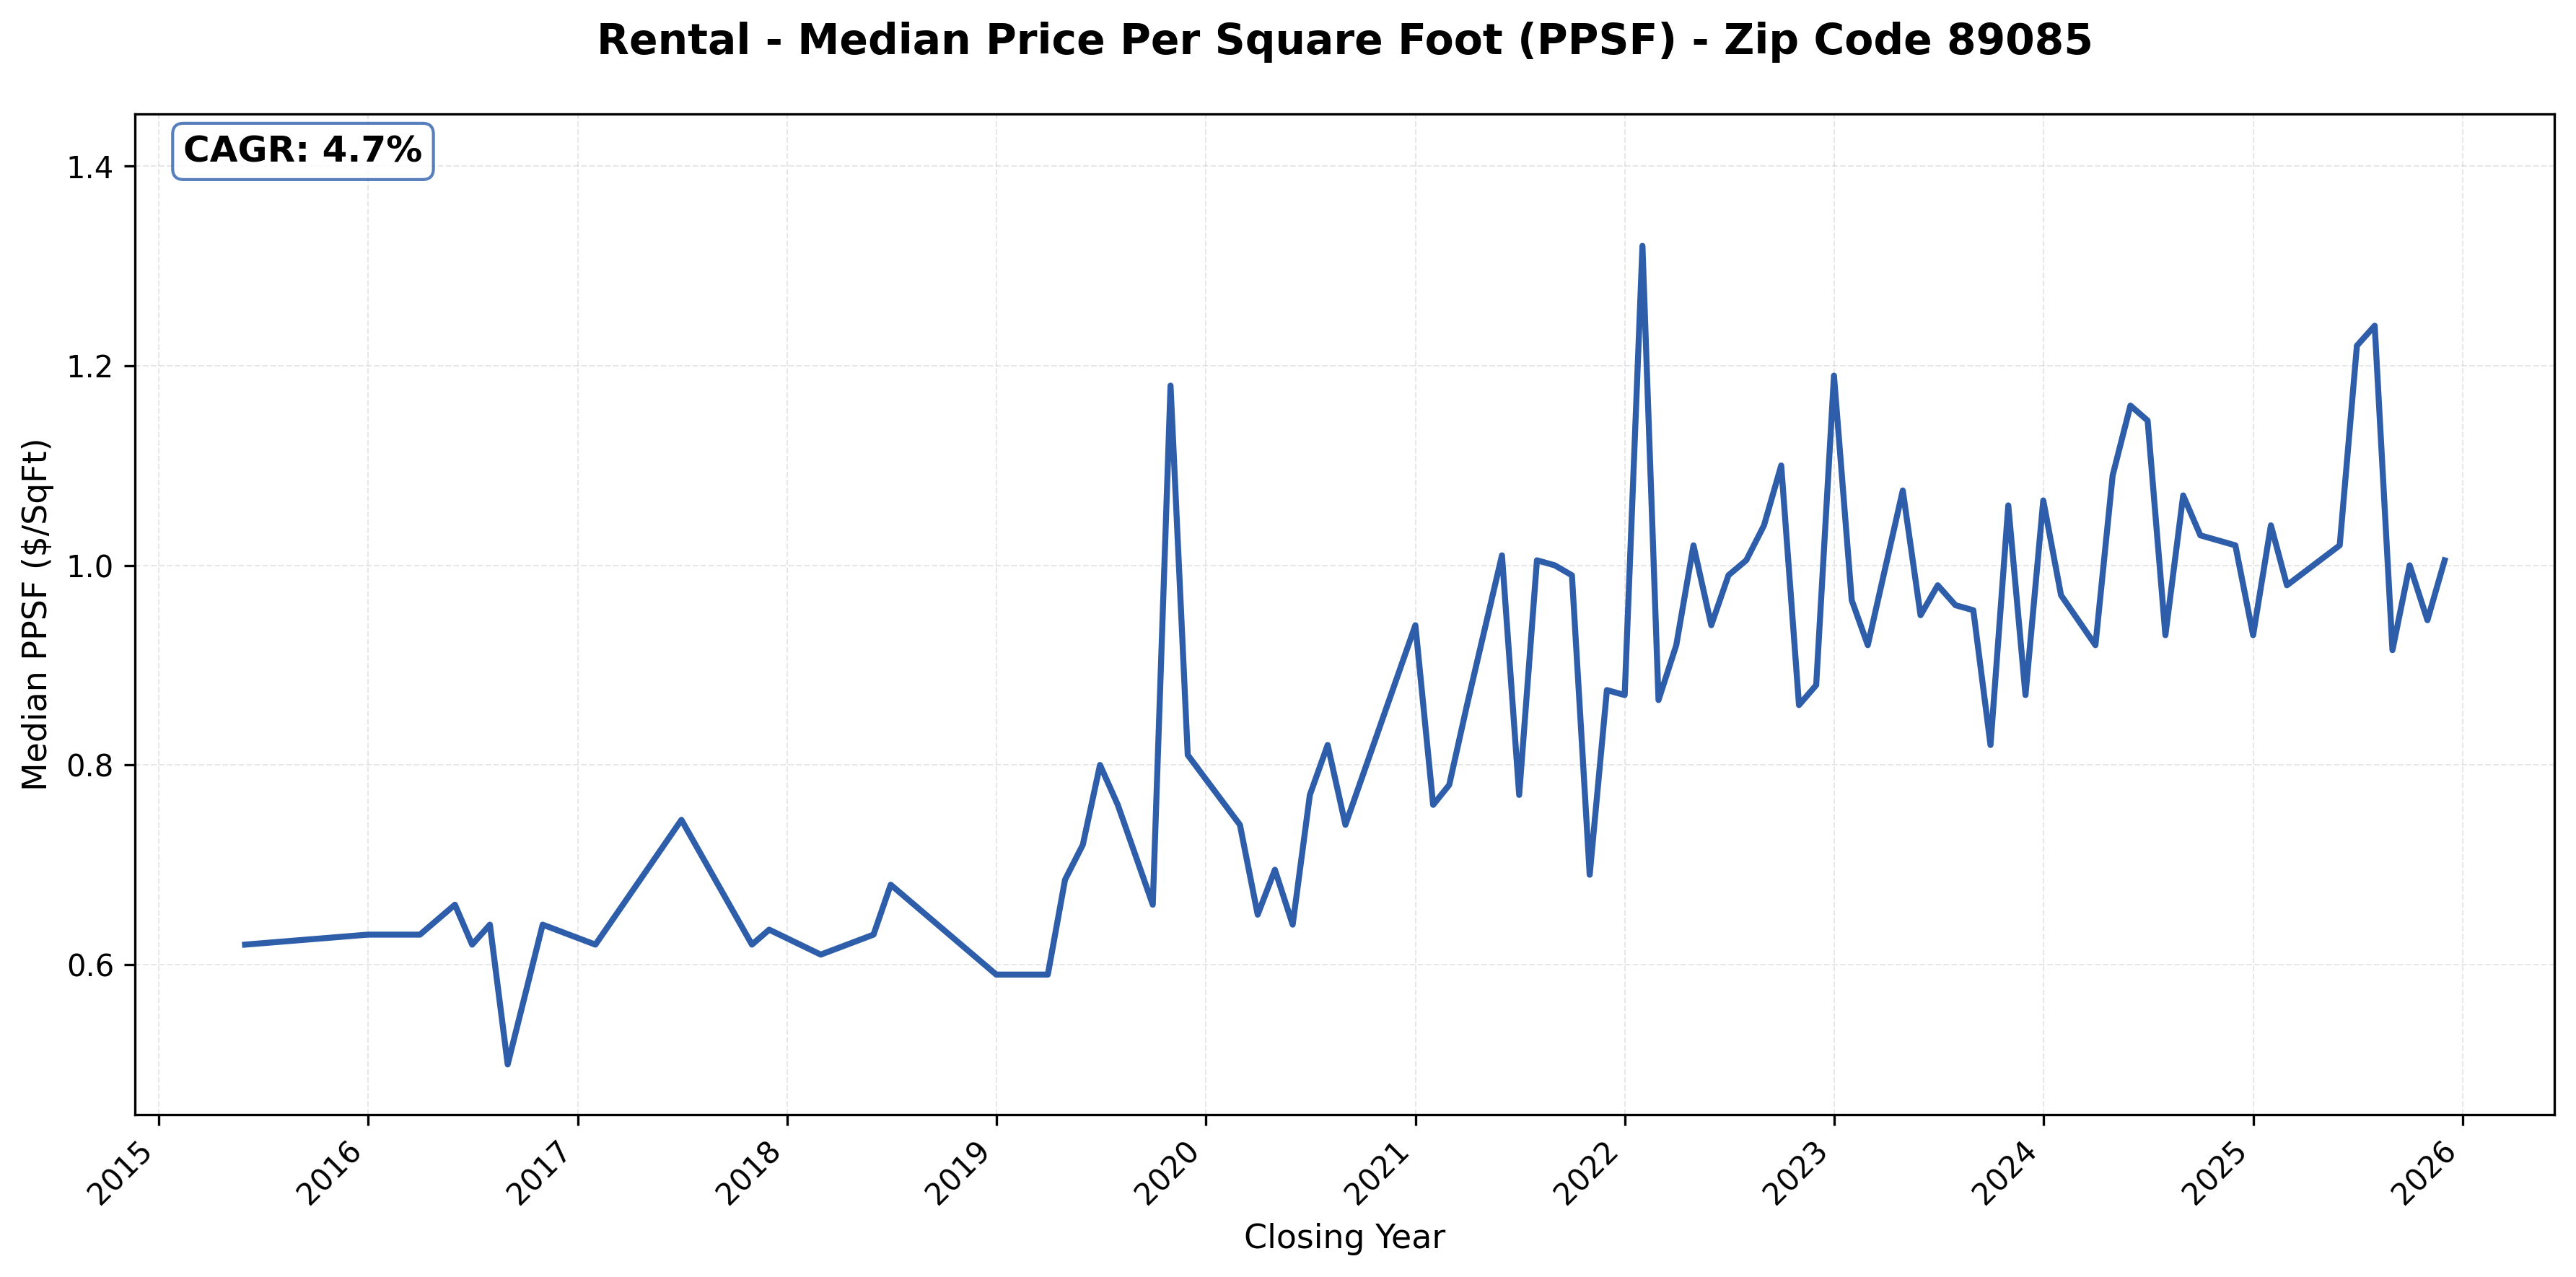
#19: 89085 (Aliante, North Las Vegas), 4.7% CAGR
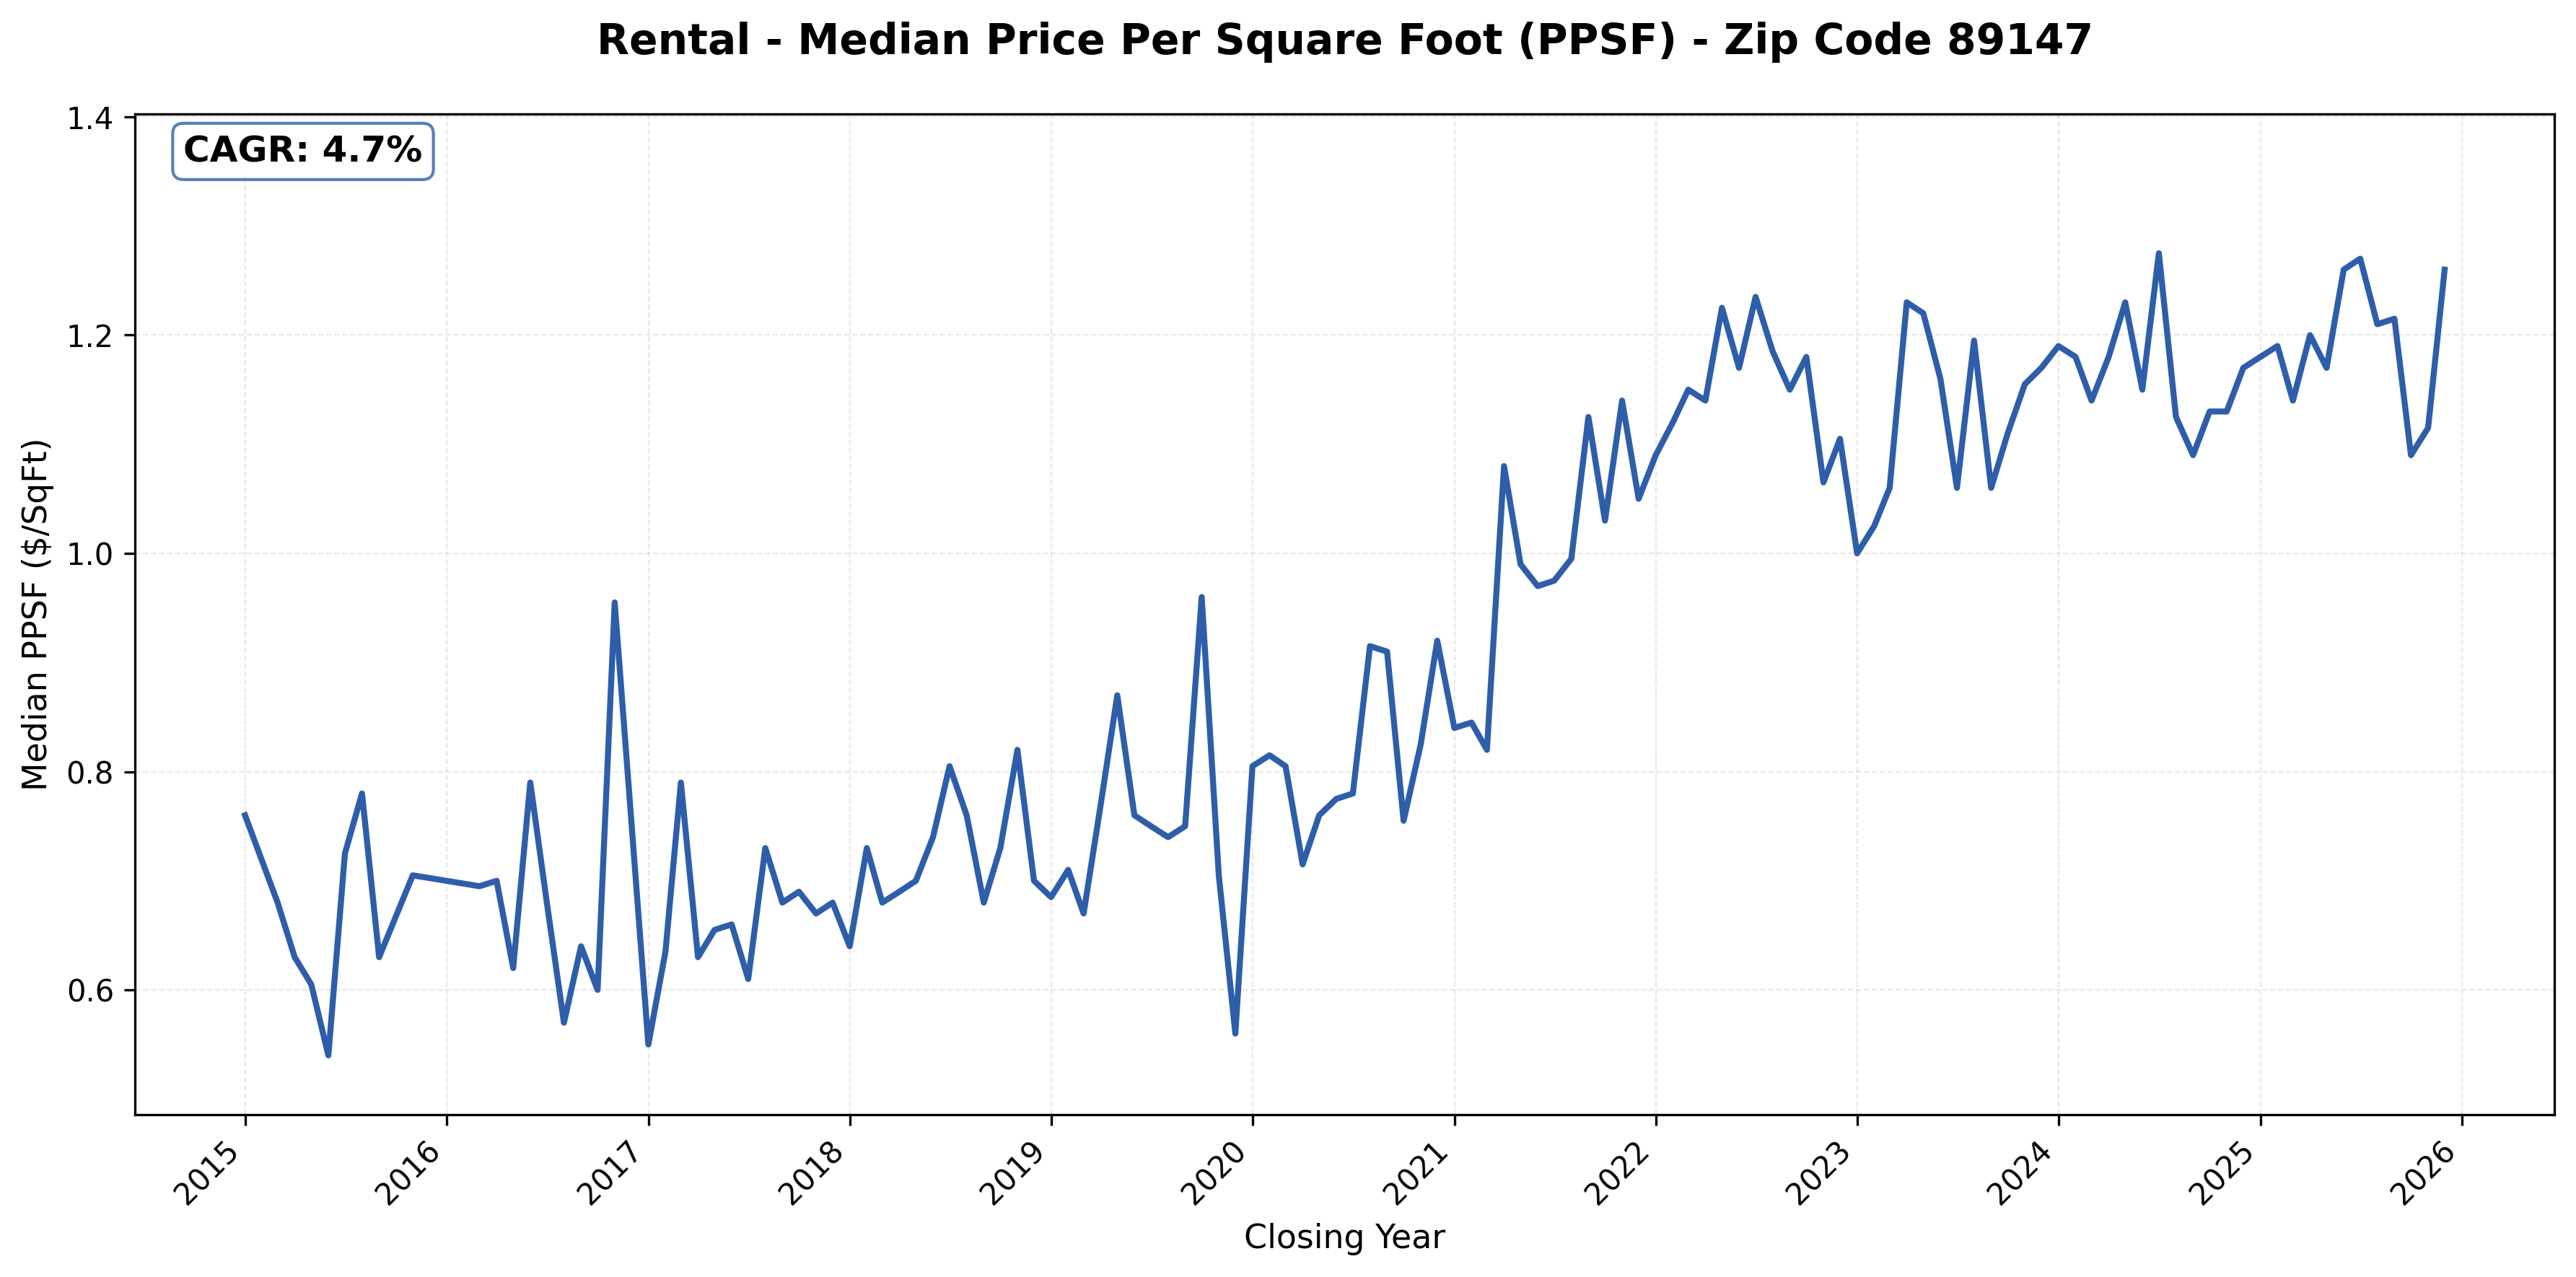
#20: 89147 (West, Summerlin adjacent), 4.7% CAGR
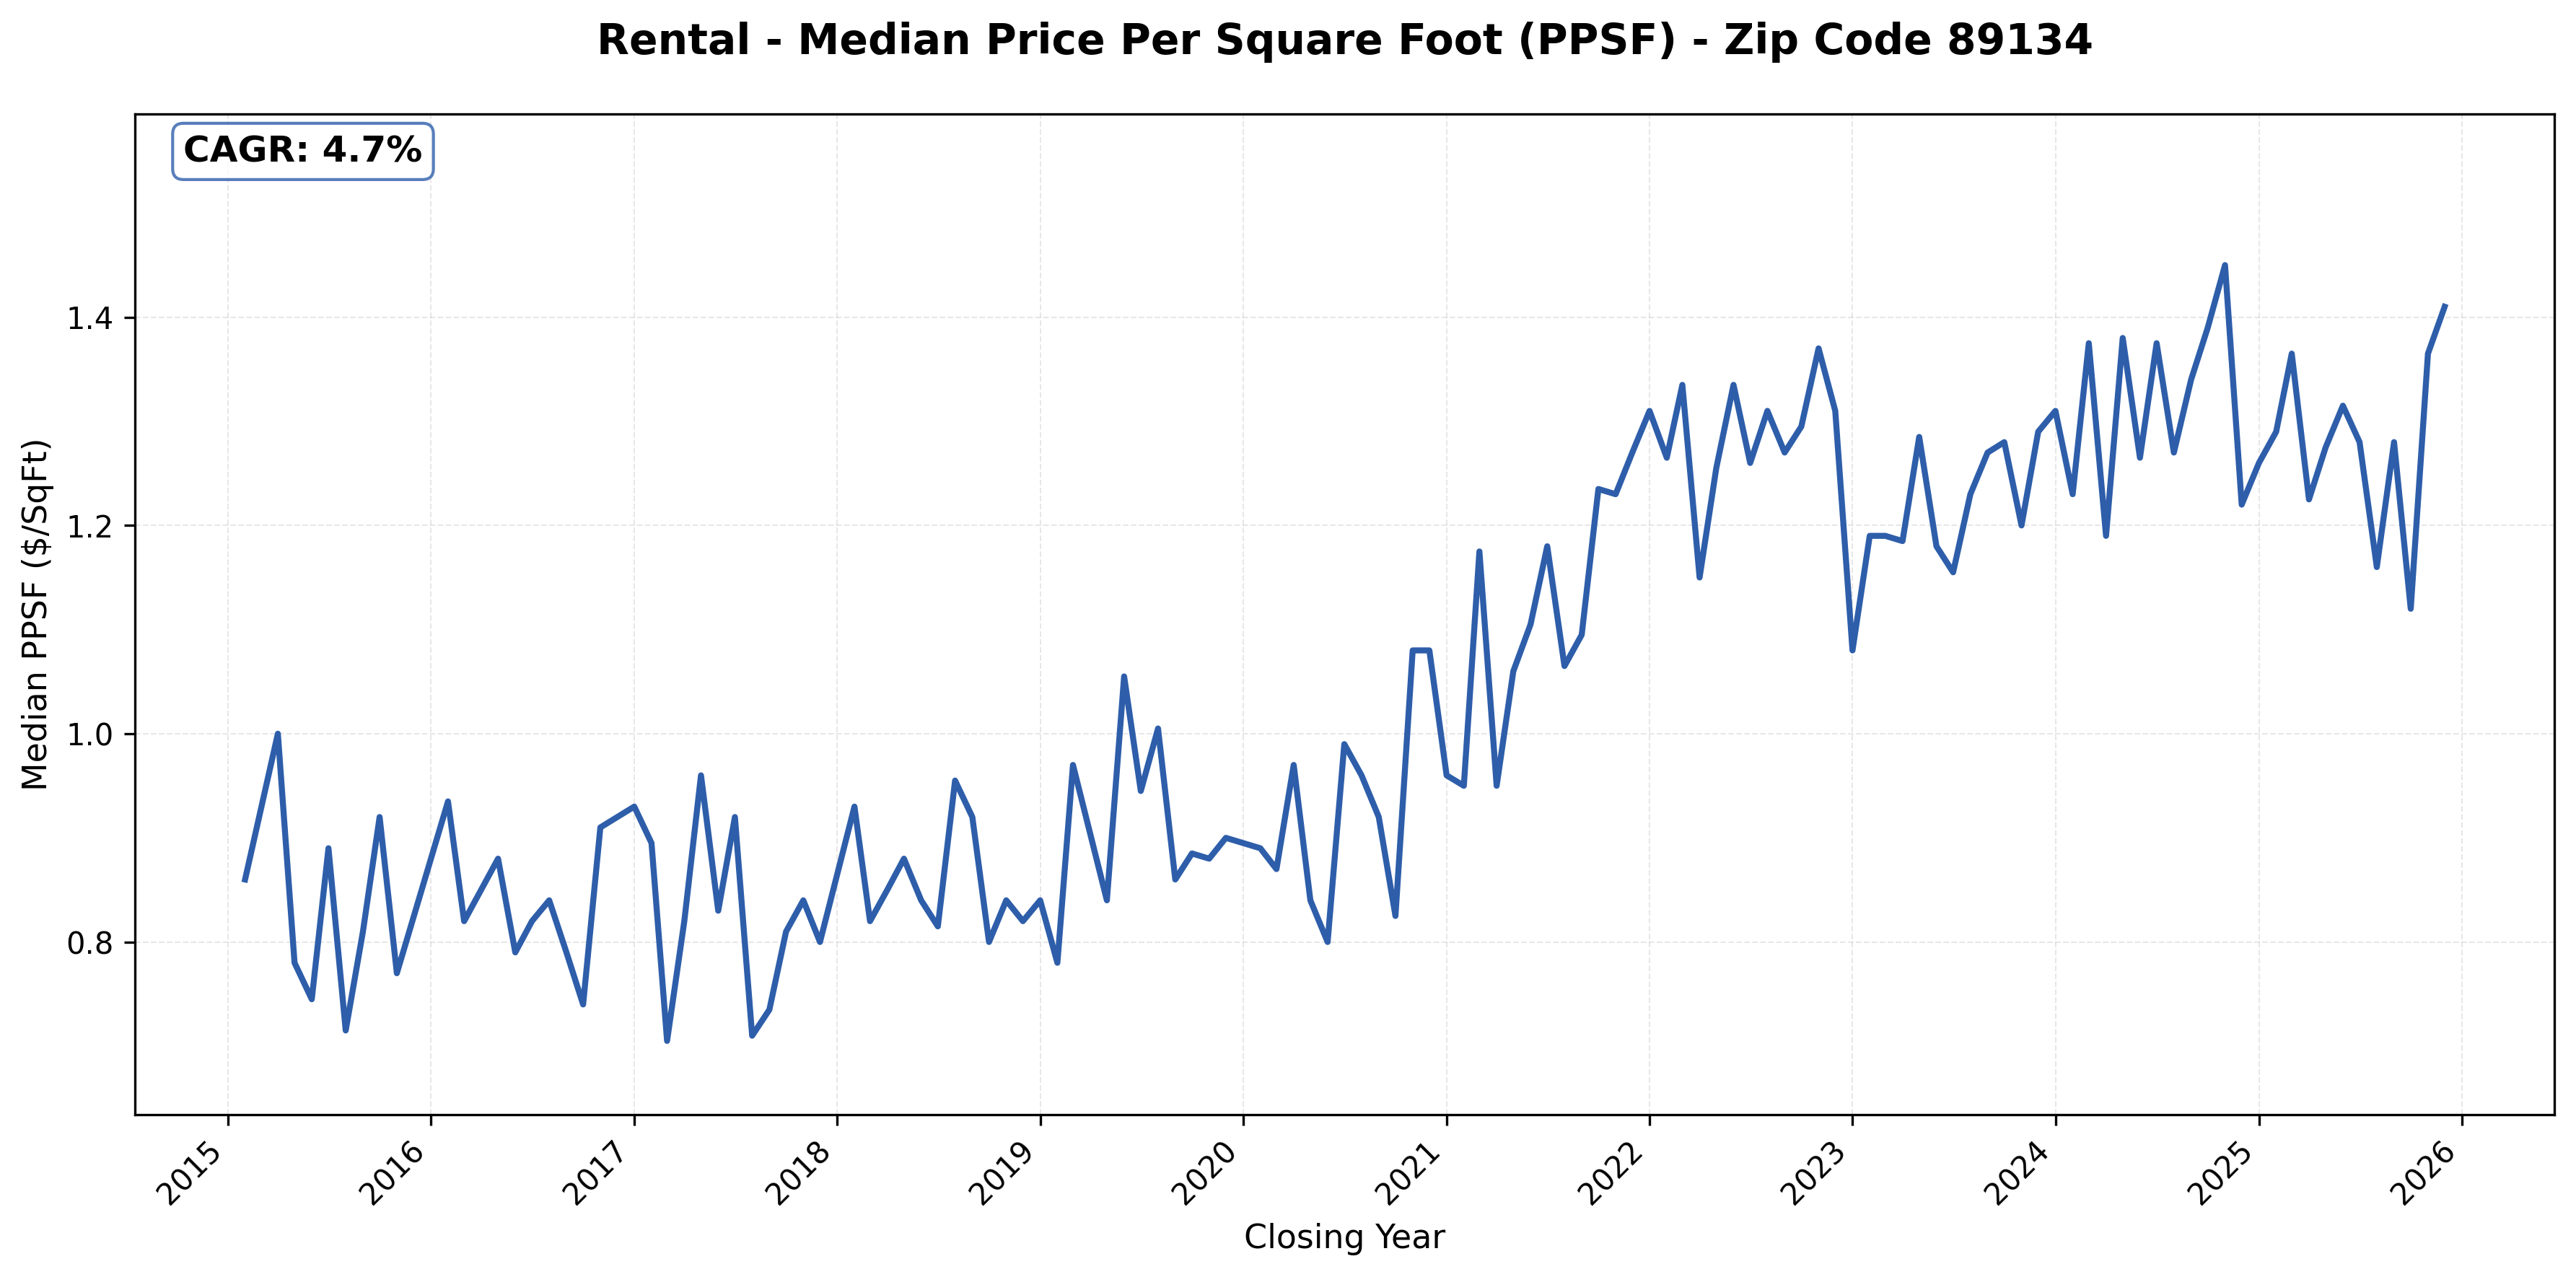
#21: 89134 (Summerlin), 4.7% CAGR
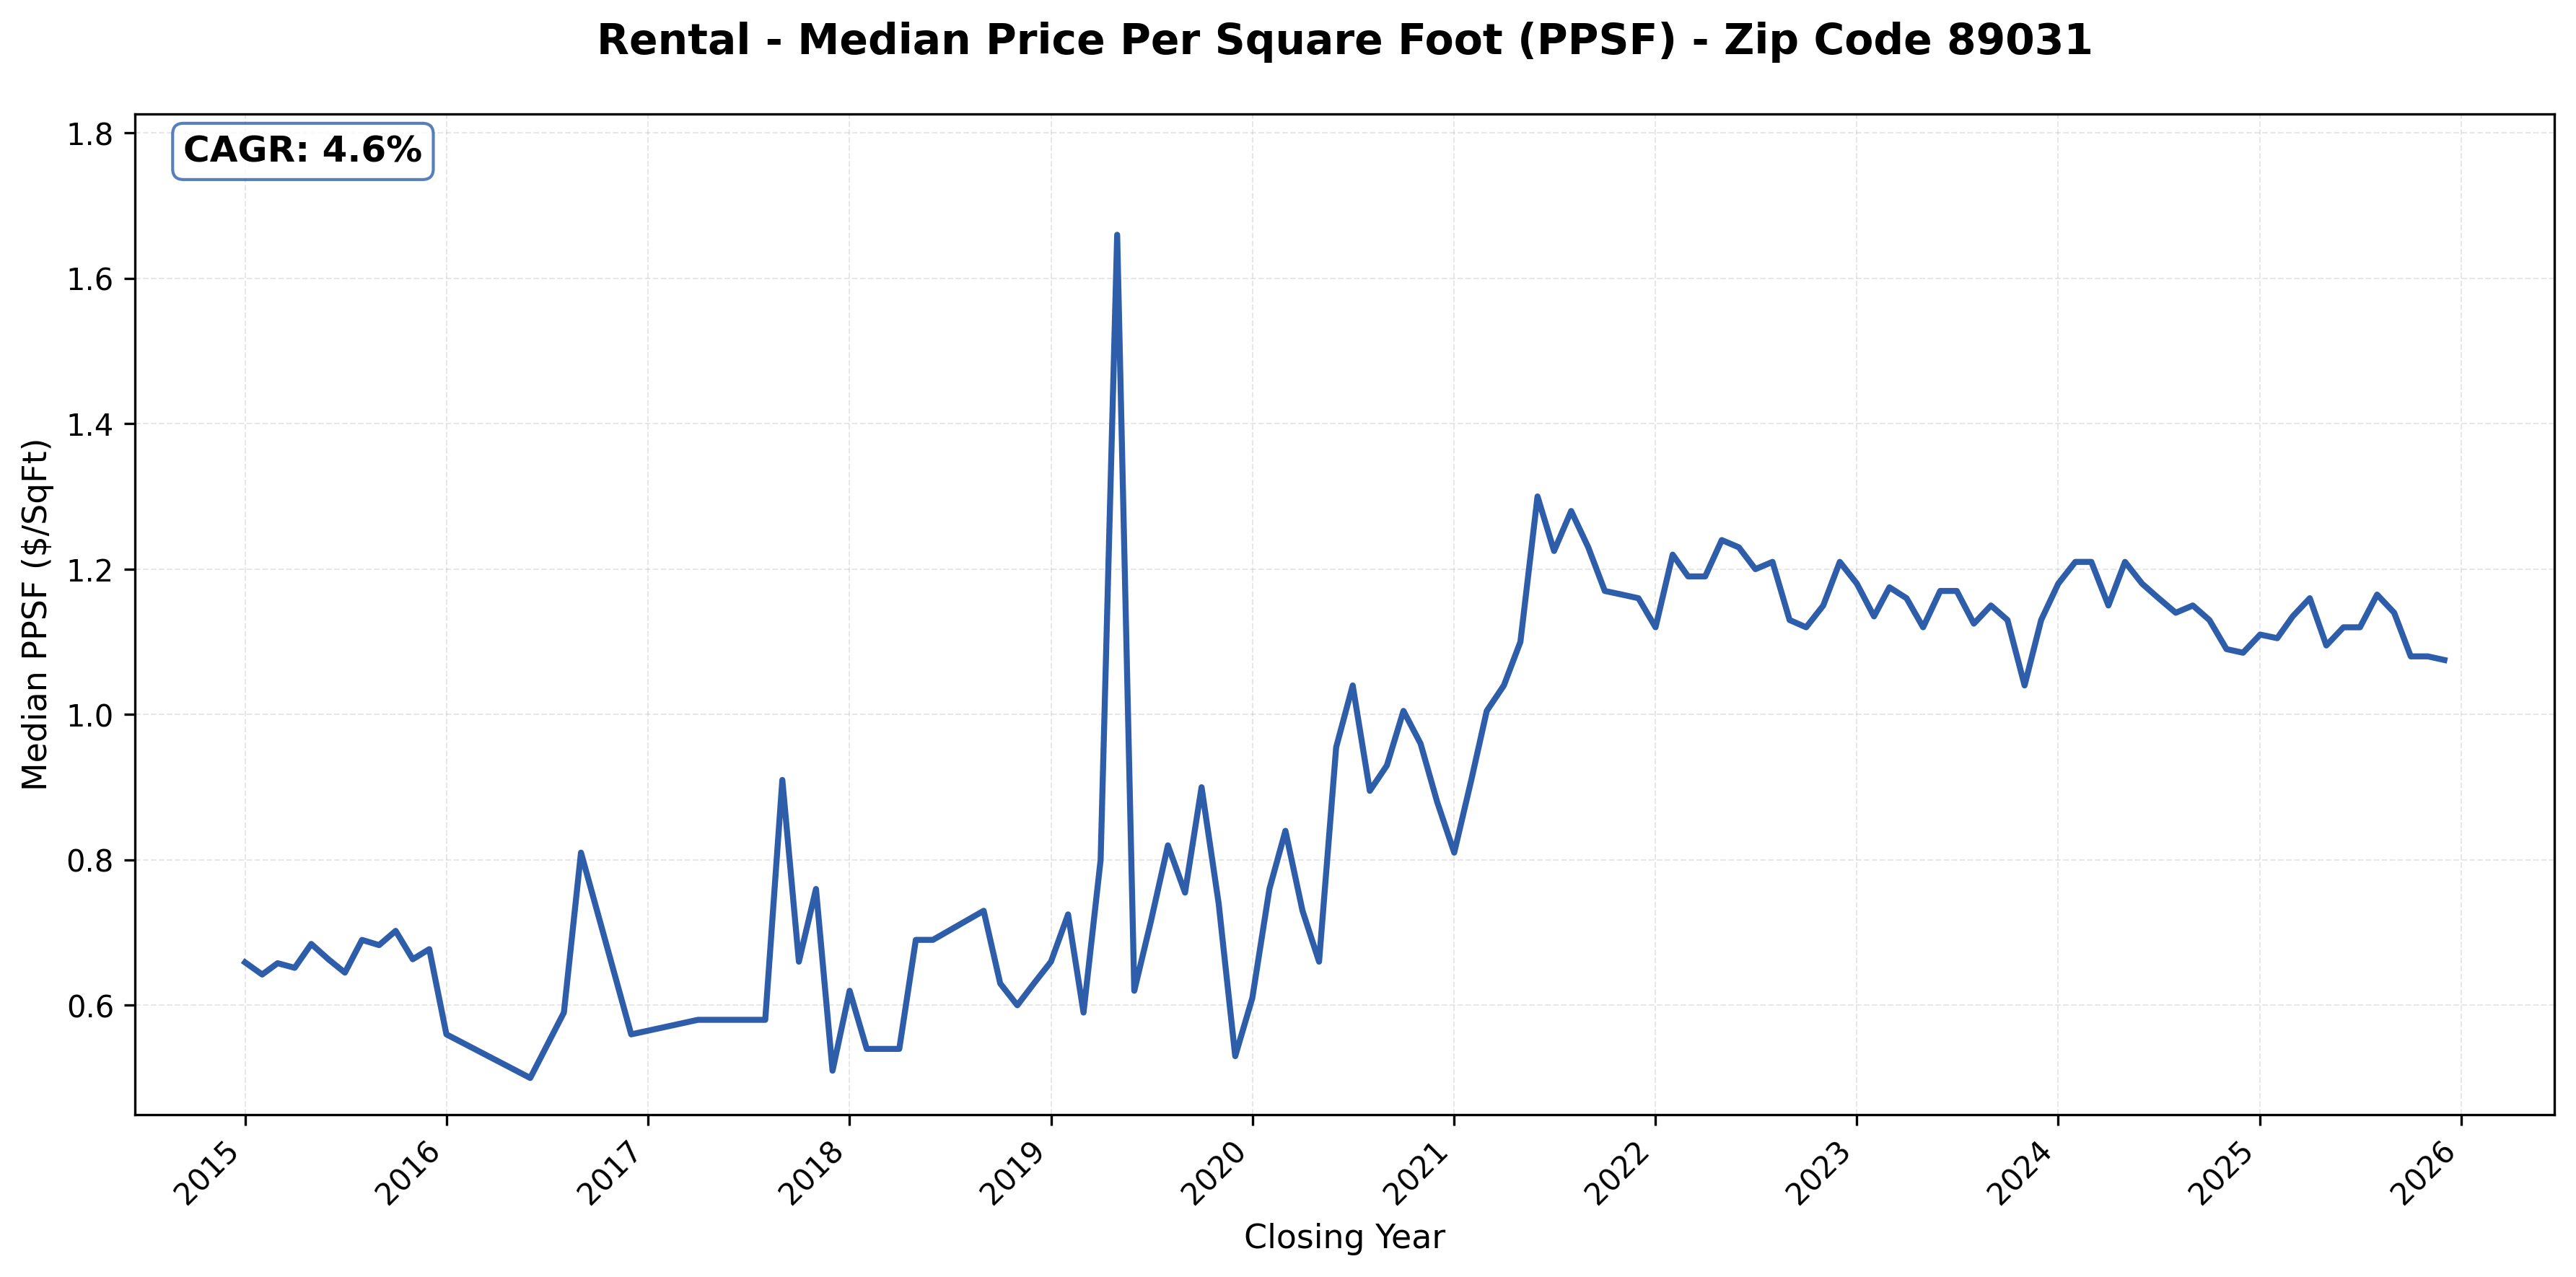
#22: 89031 (Eldorado, North Las Vegas), 4.6% CAGR.
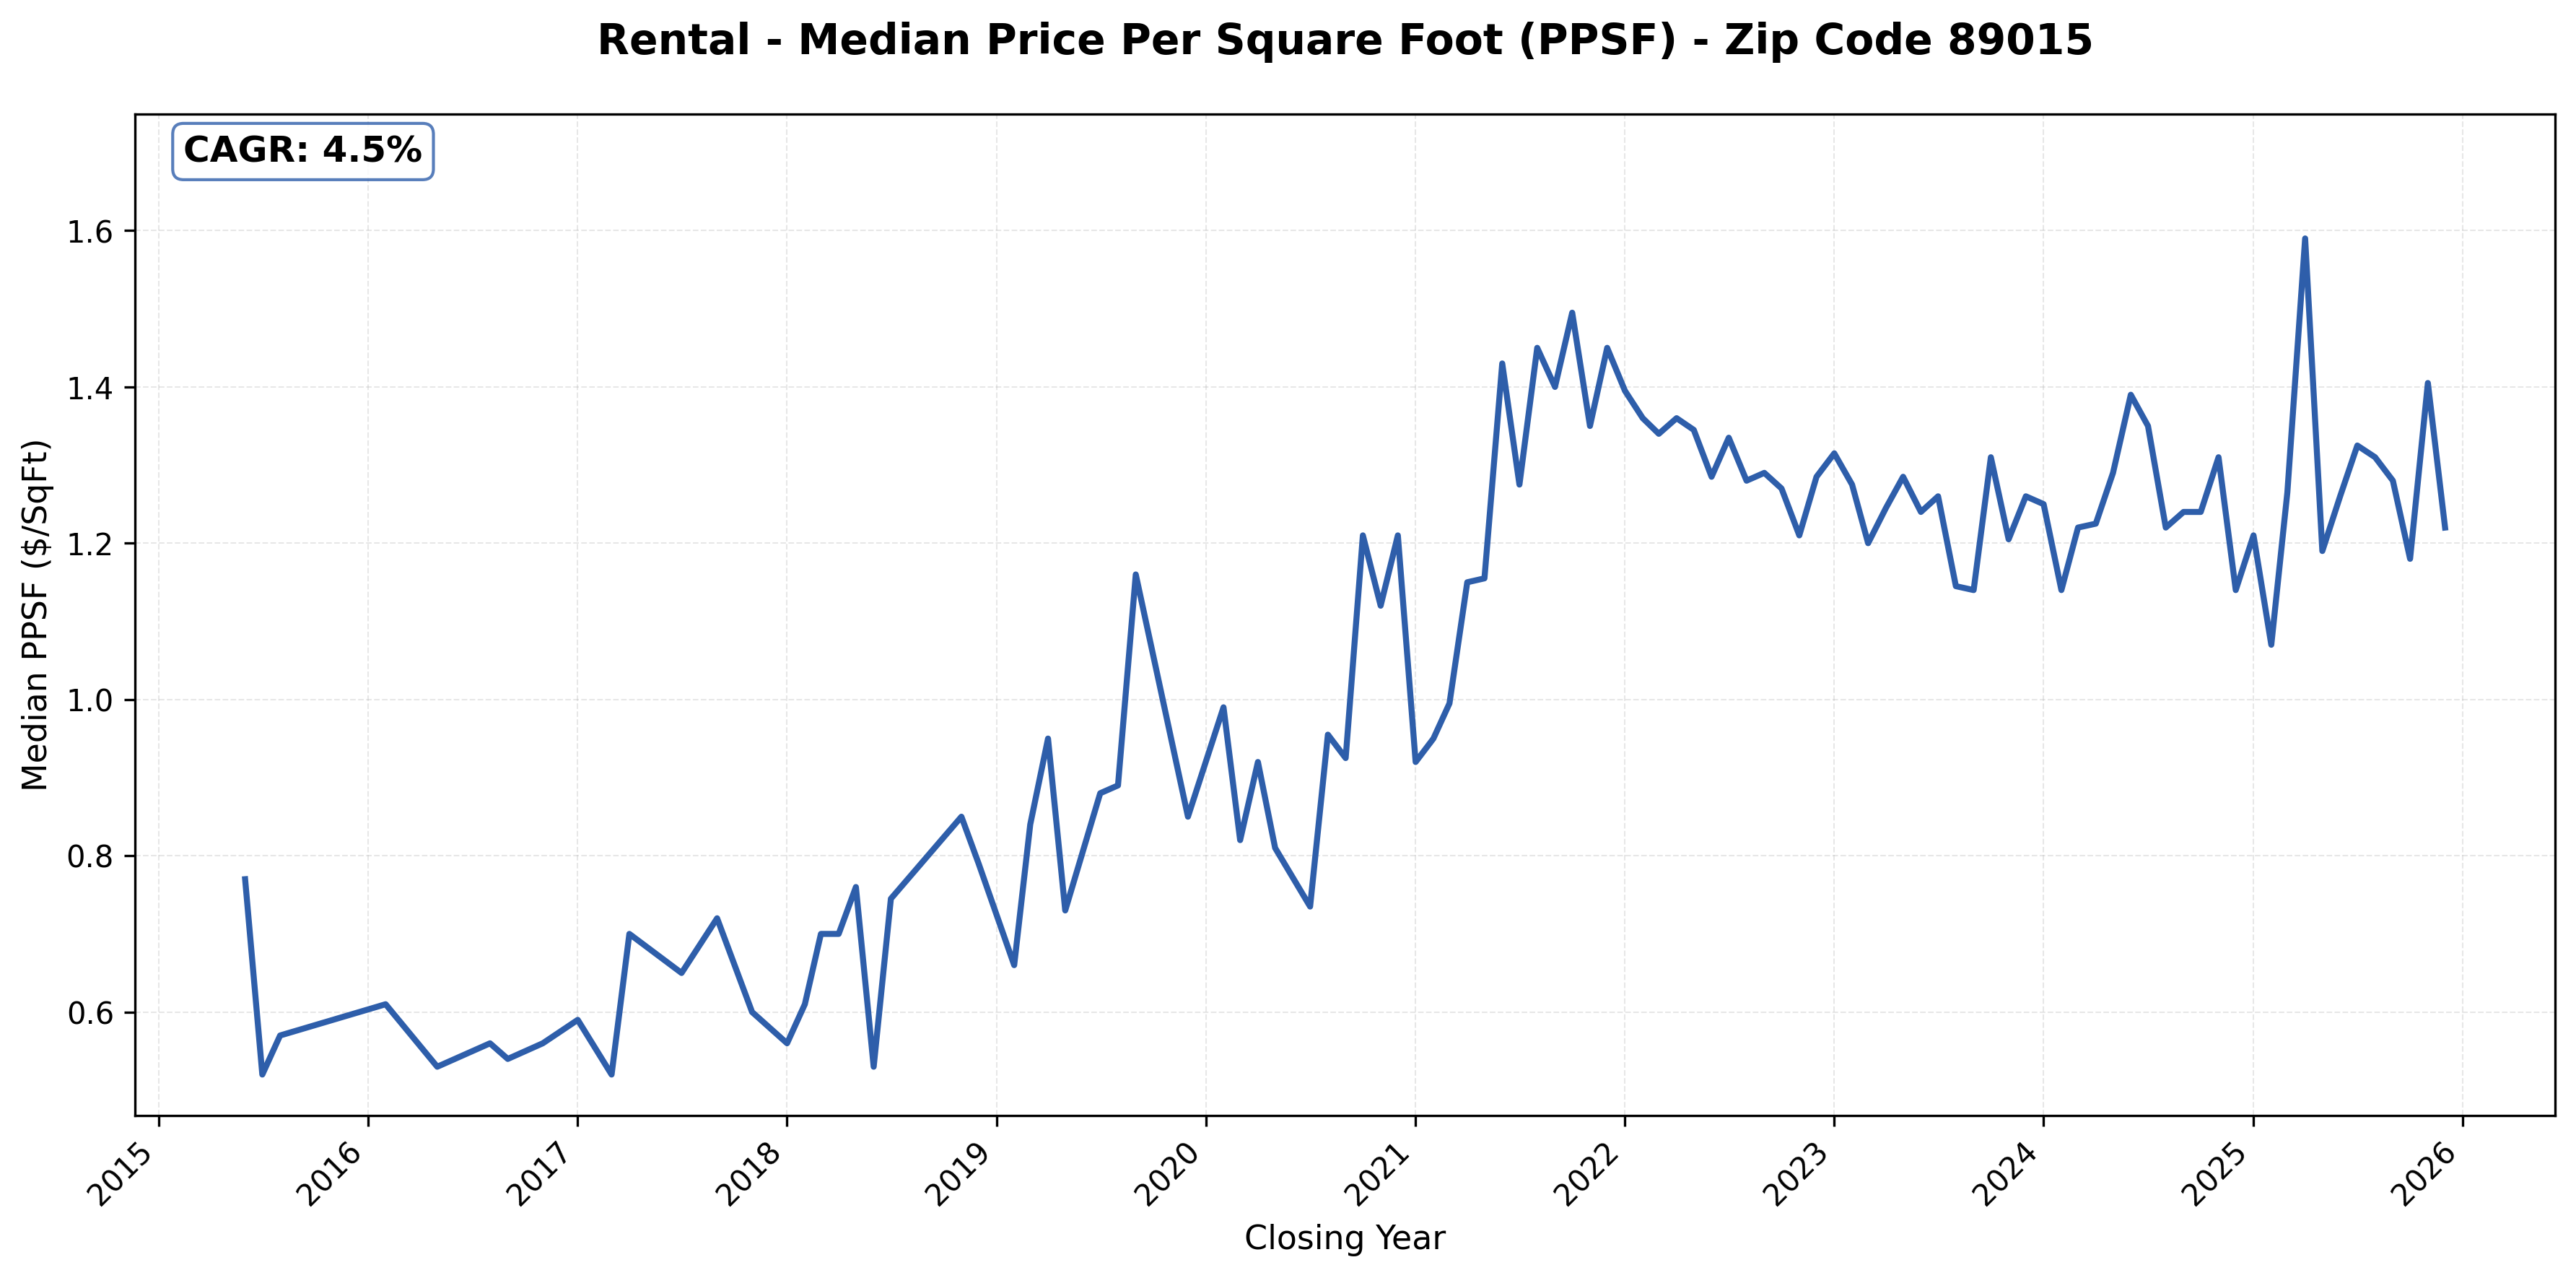
#23: 89015 (Henderson), 4.5% CAGR
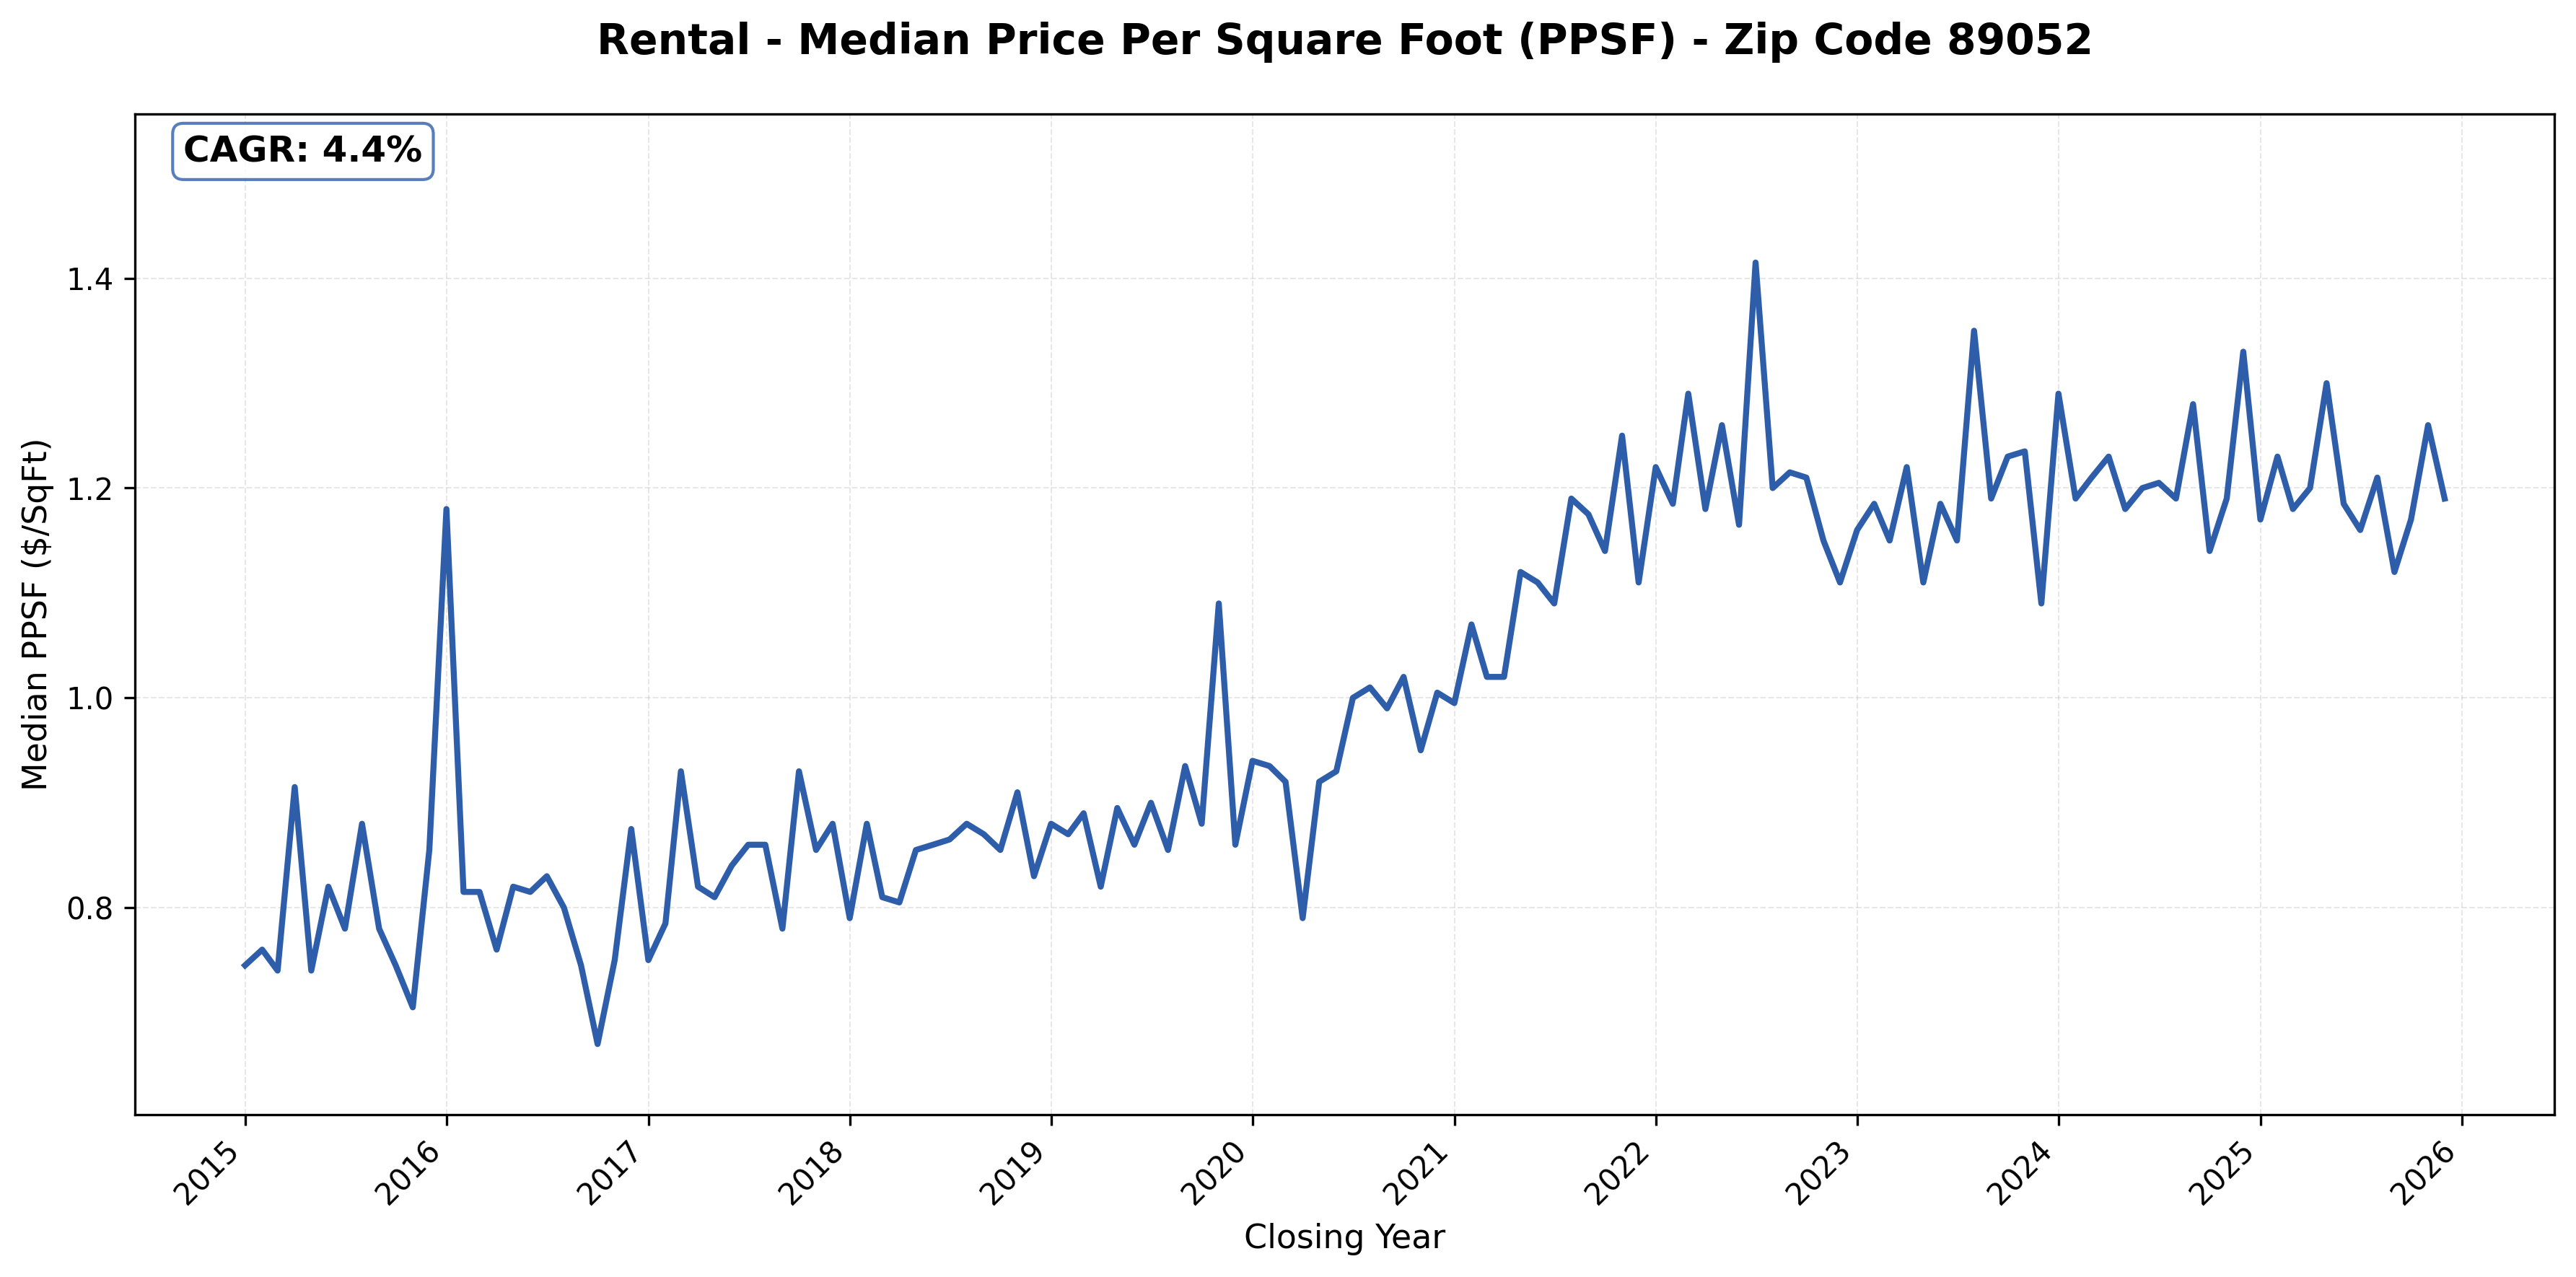
#24: 89052 (Green Valley Ranch, Anthem, Henderson), 4.4% CAGR
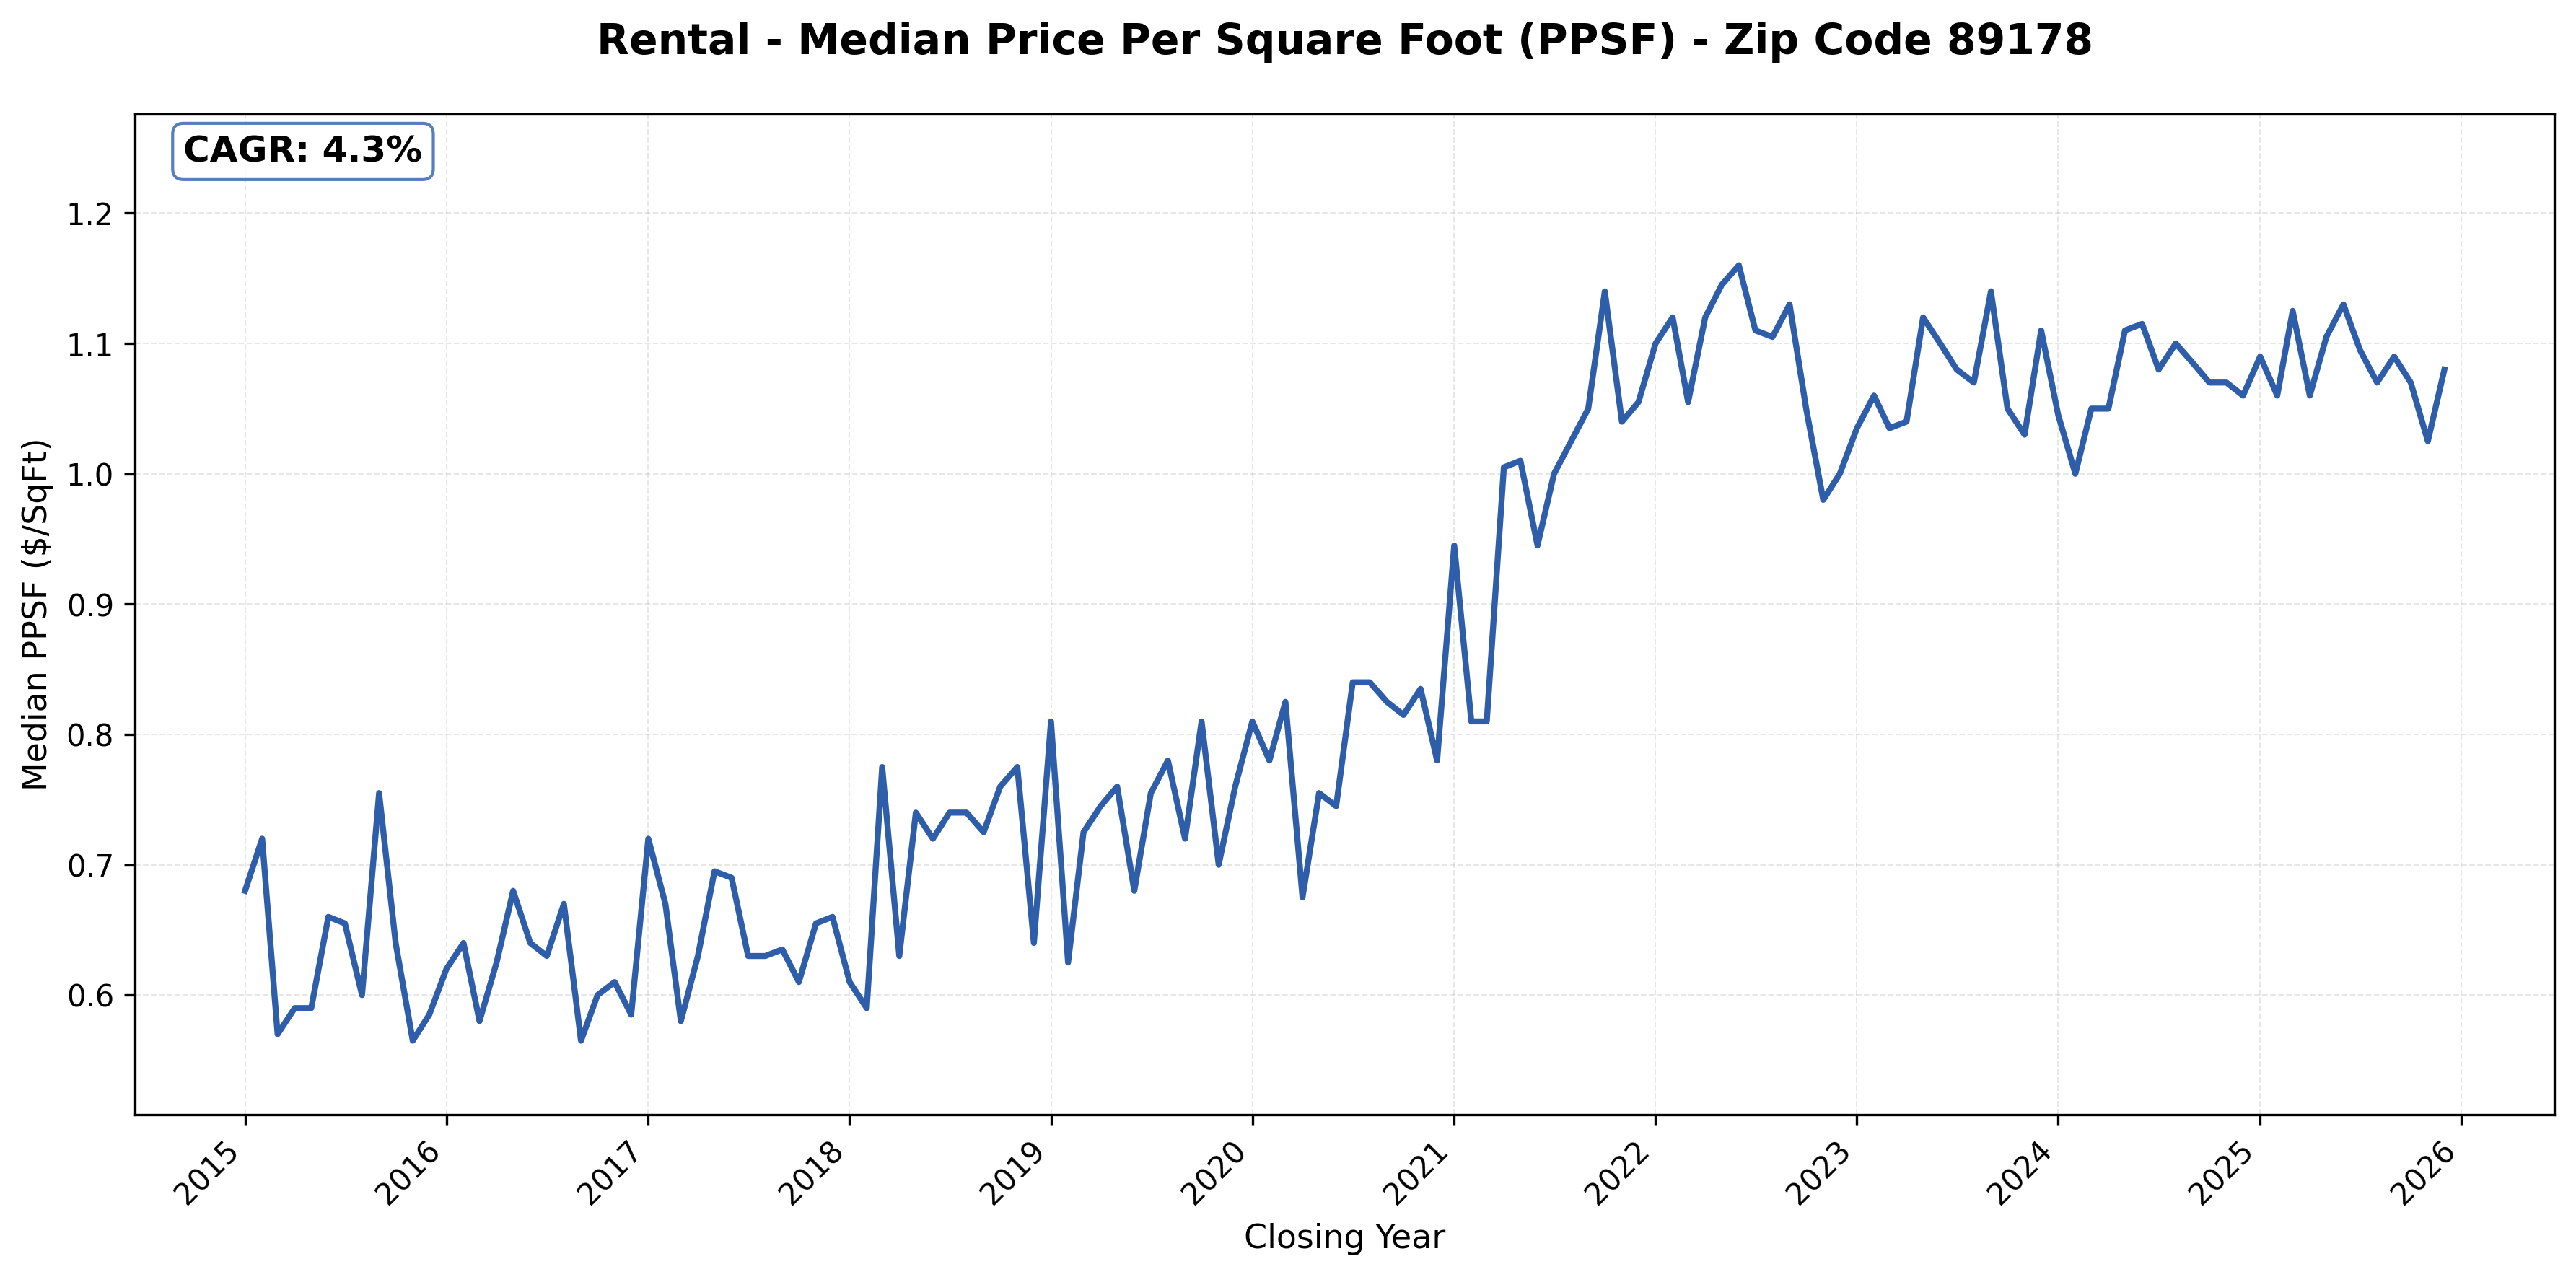
#25: 89178 (Southwest, Mountain’s Edge), 4.3% CAGR
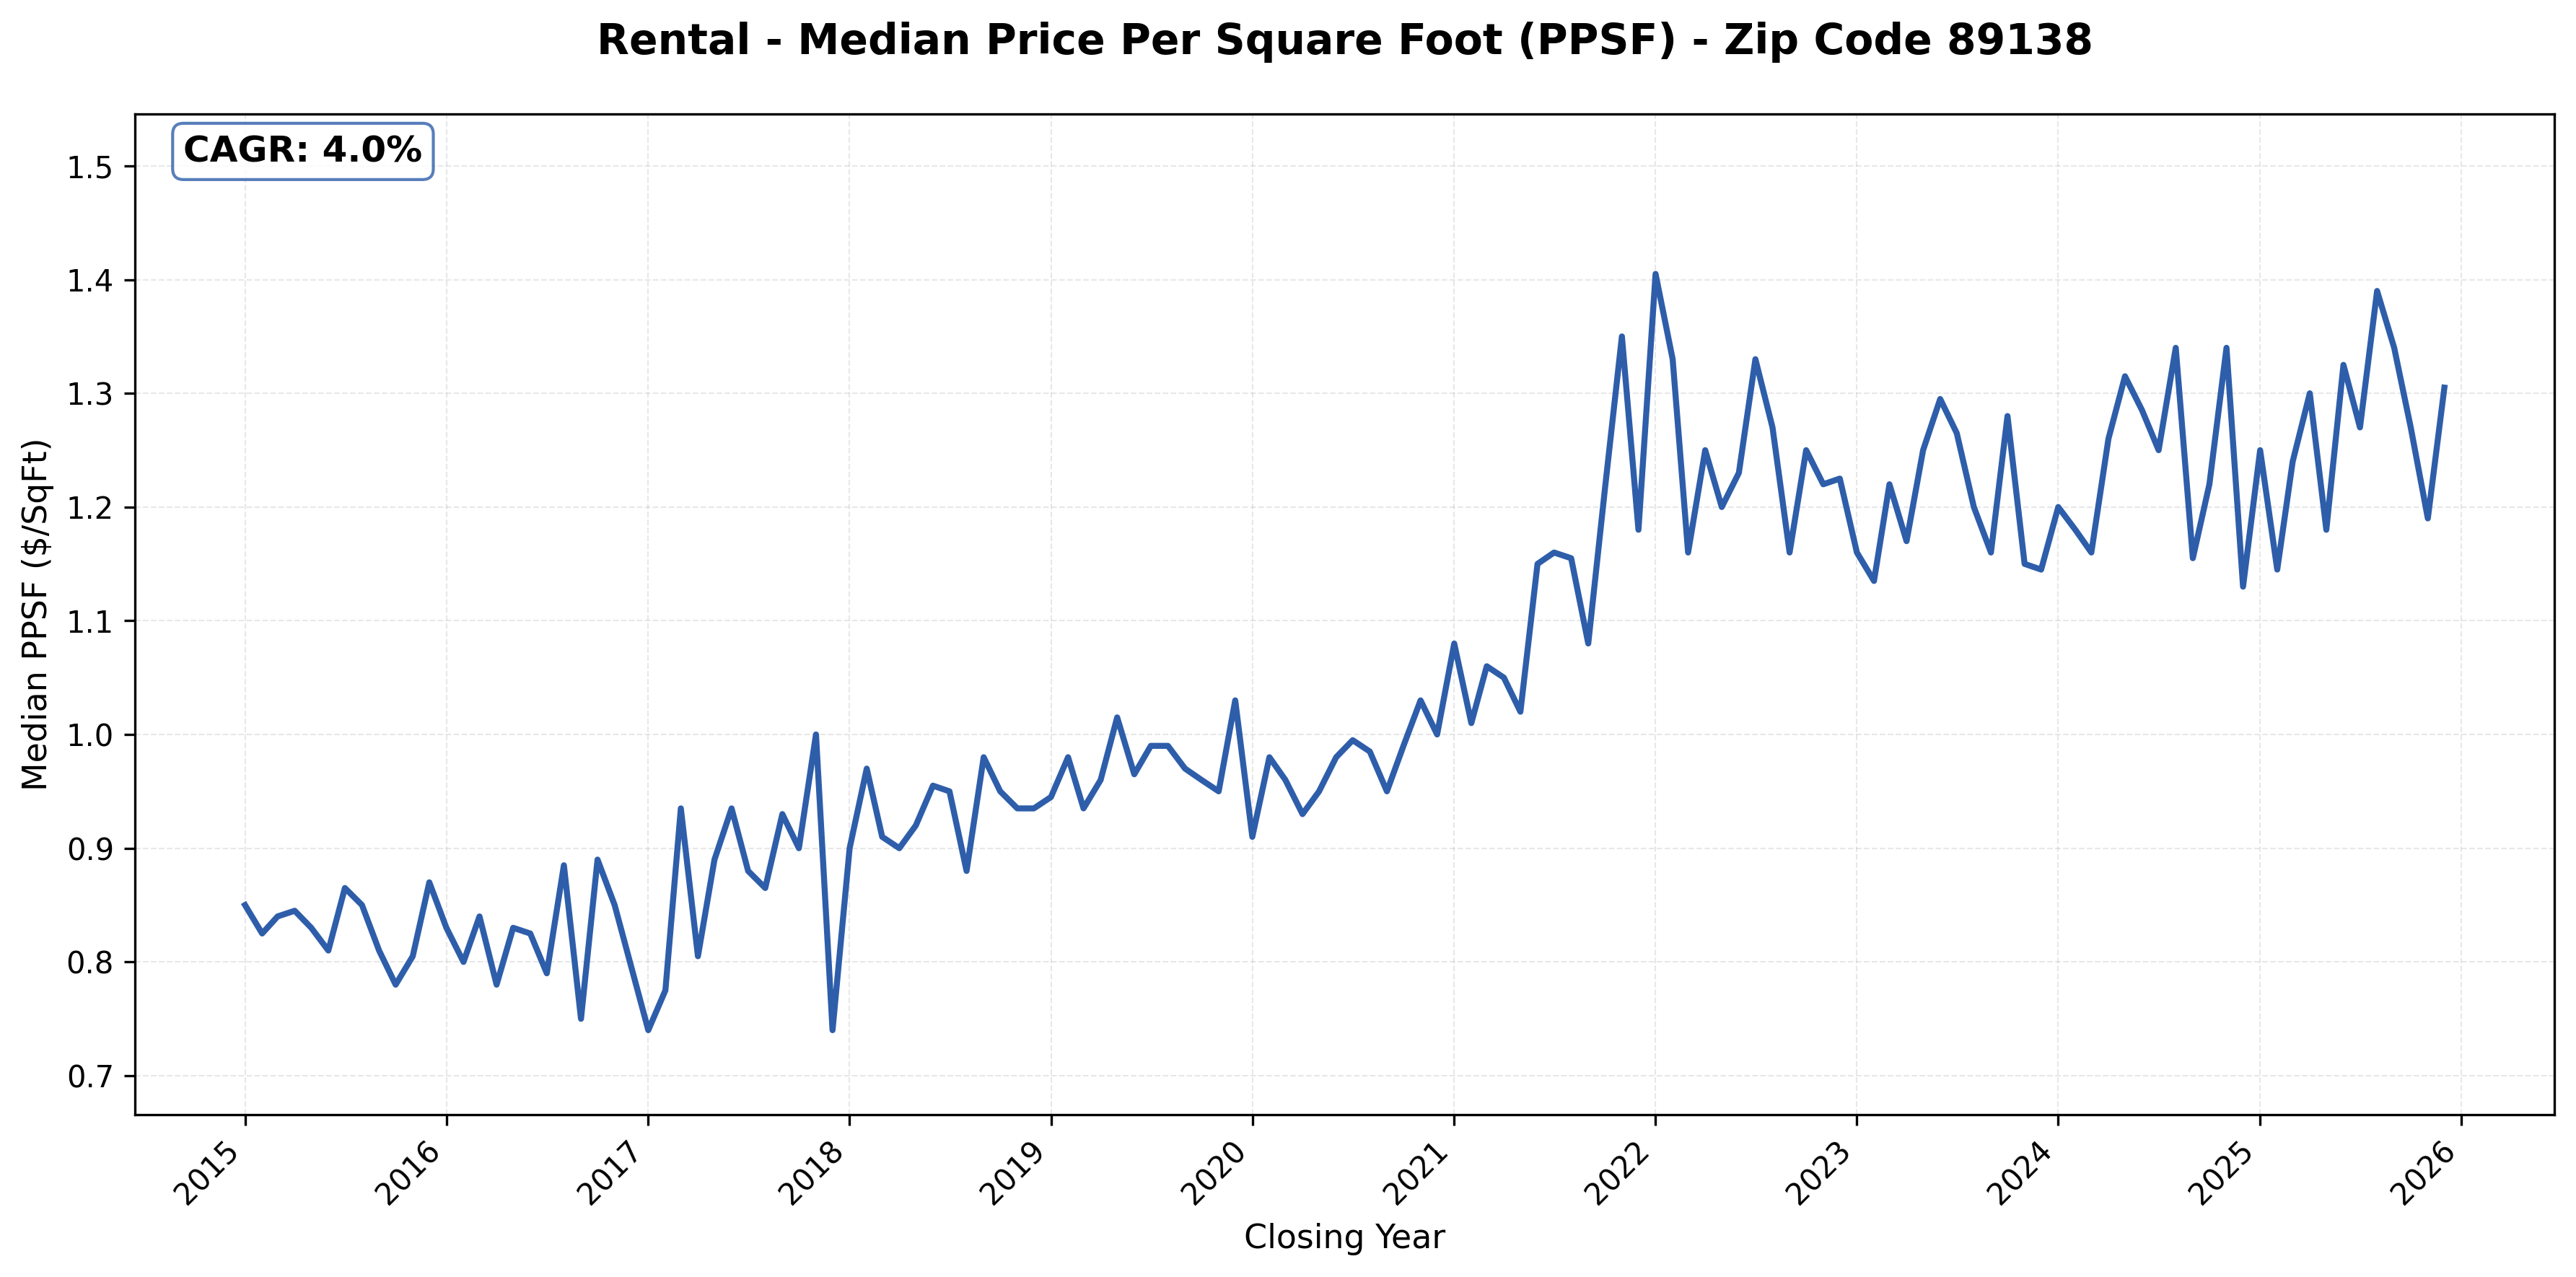
#26: 89138 (Summerlin), 4.0% CAGR.
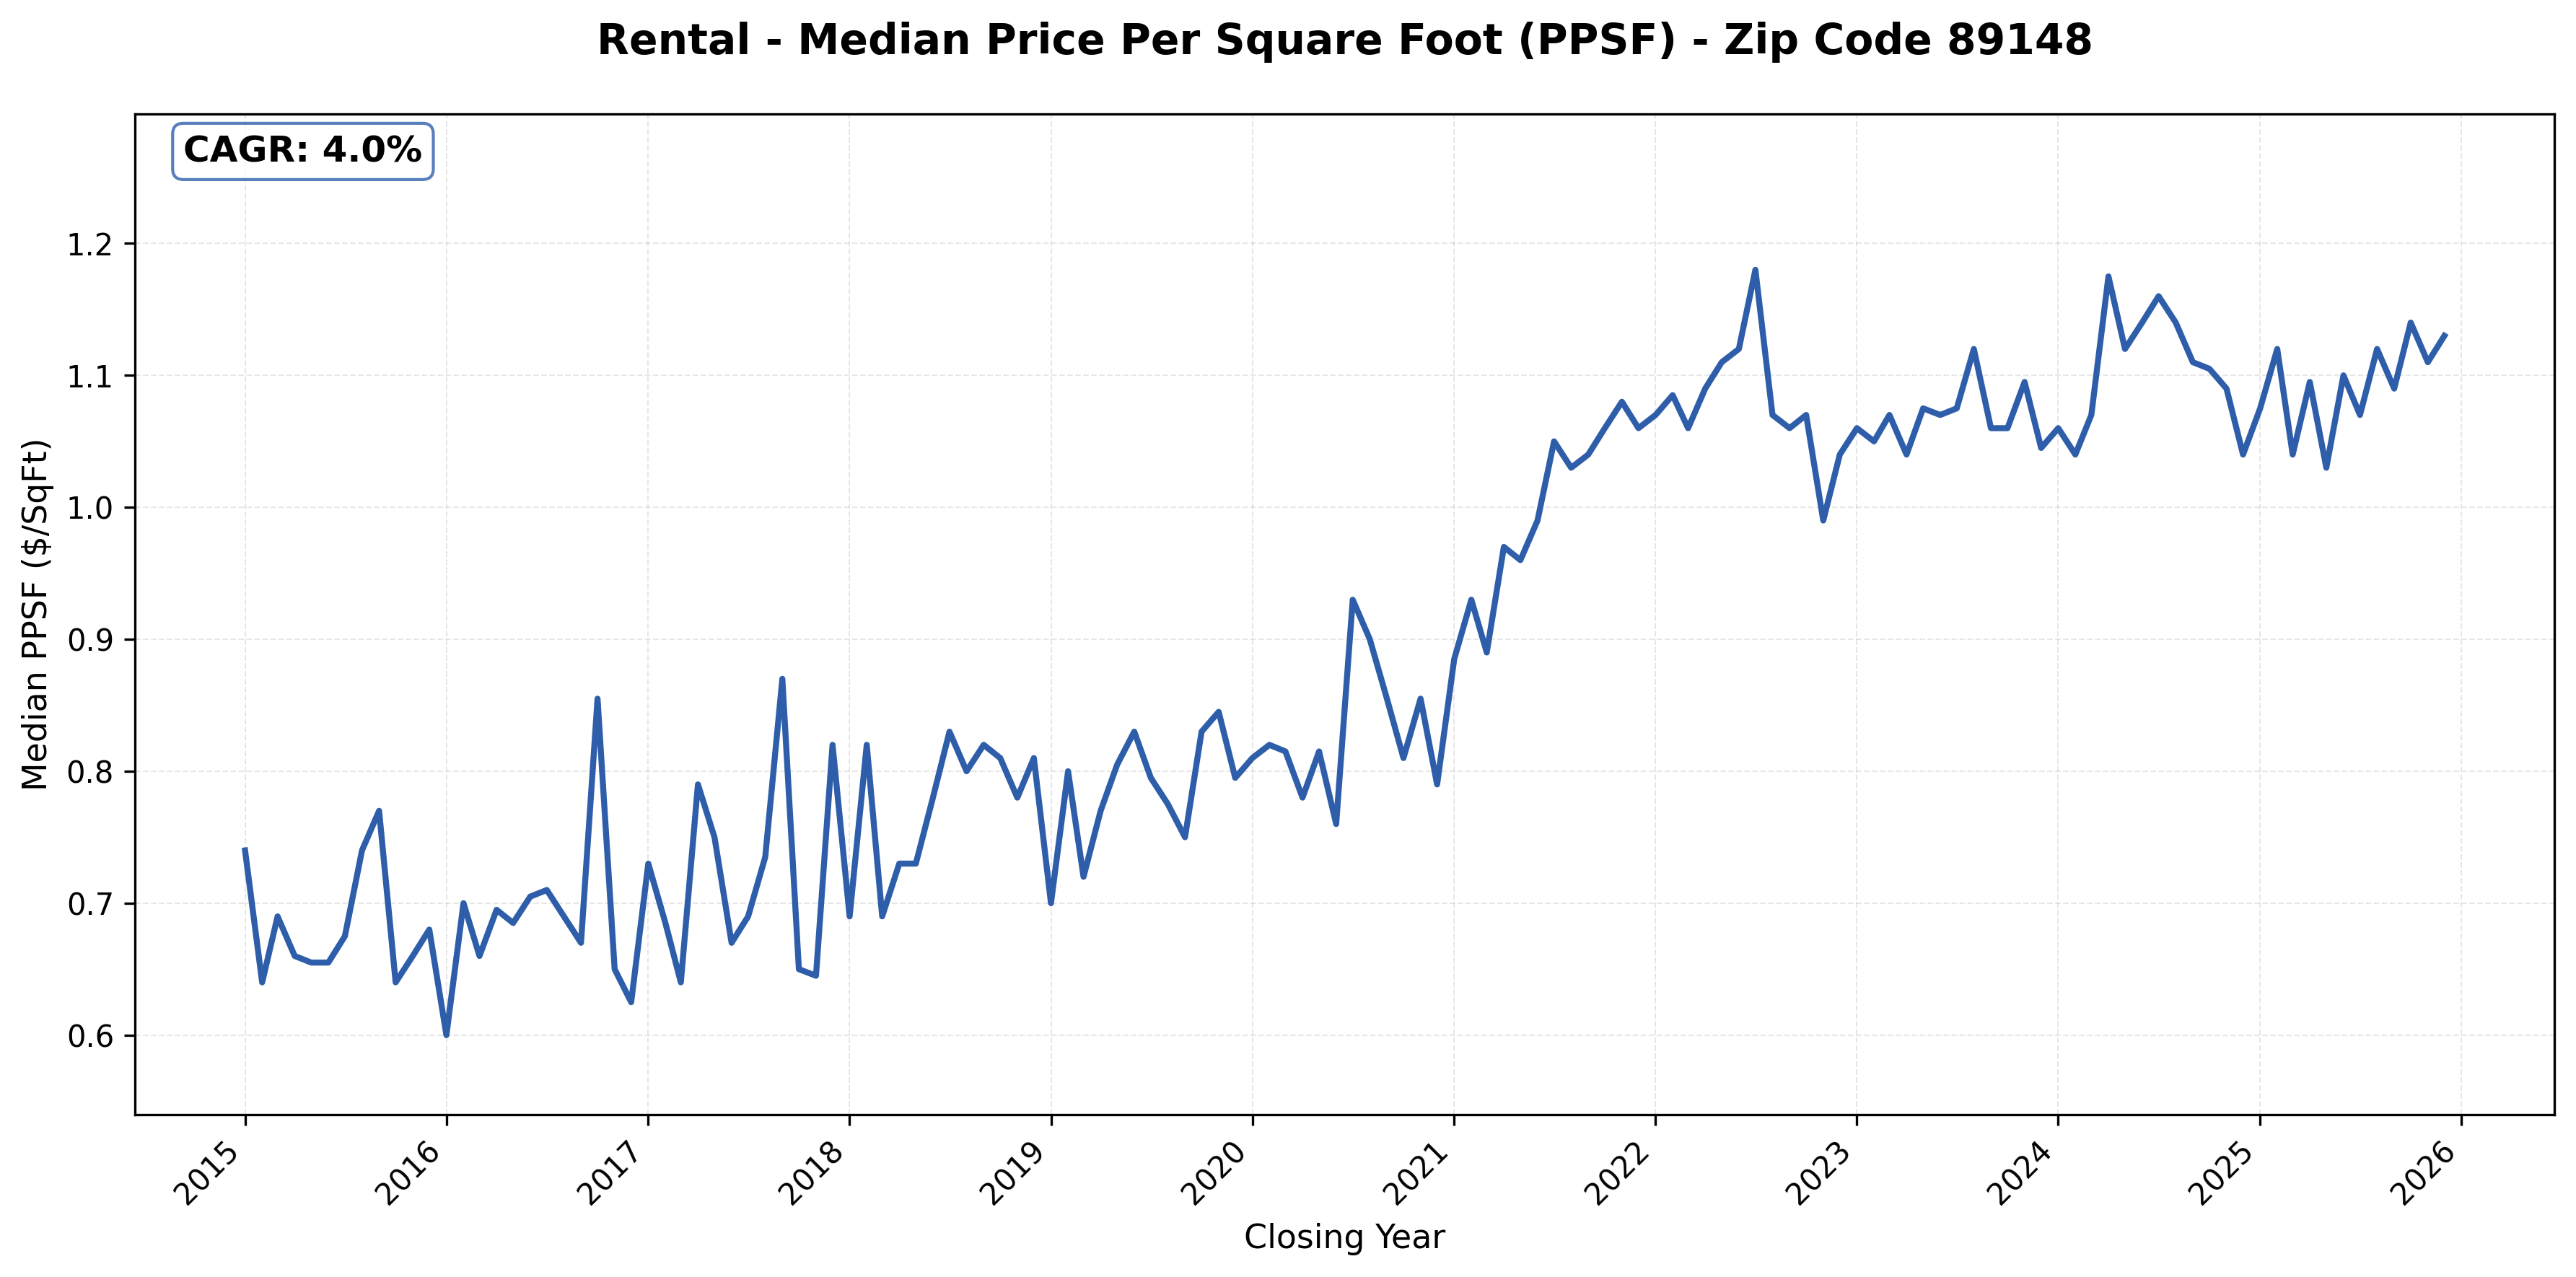
#27: 89148 (Southwest, Rhodes Ranch), 4.0% CAGR.
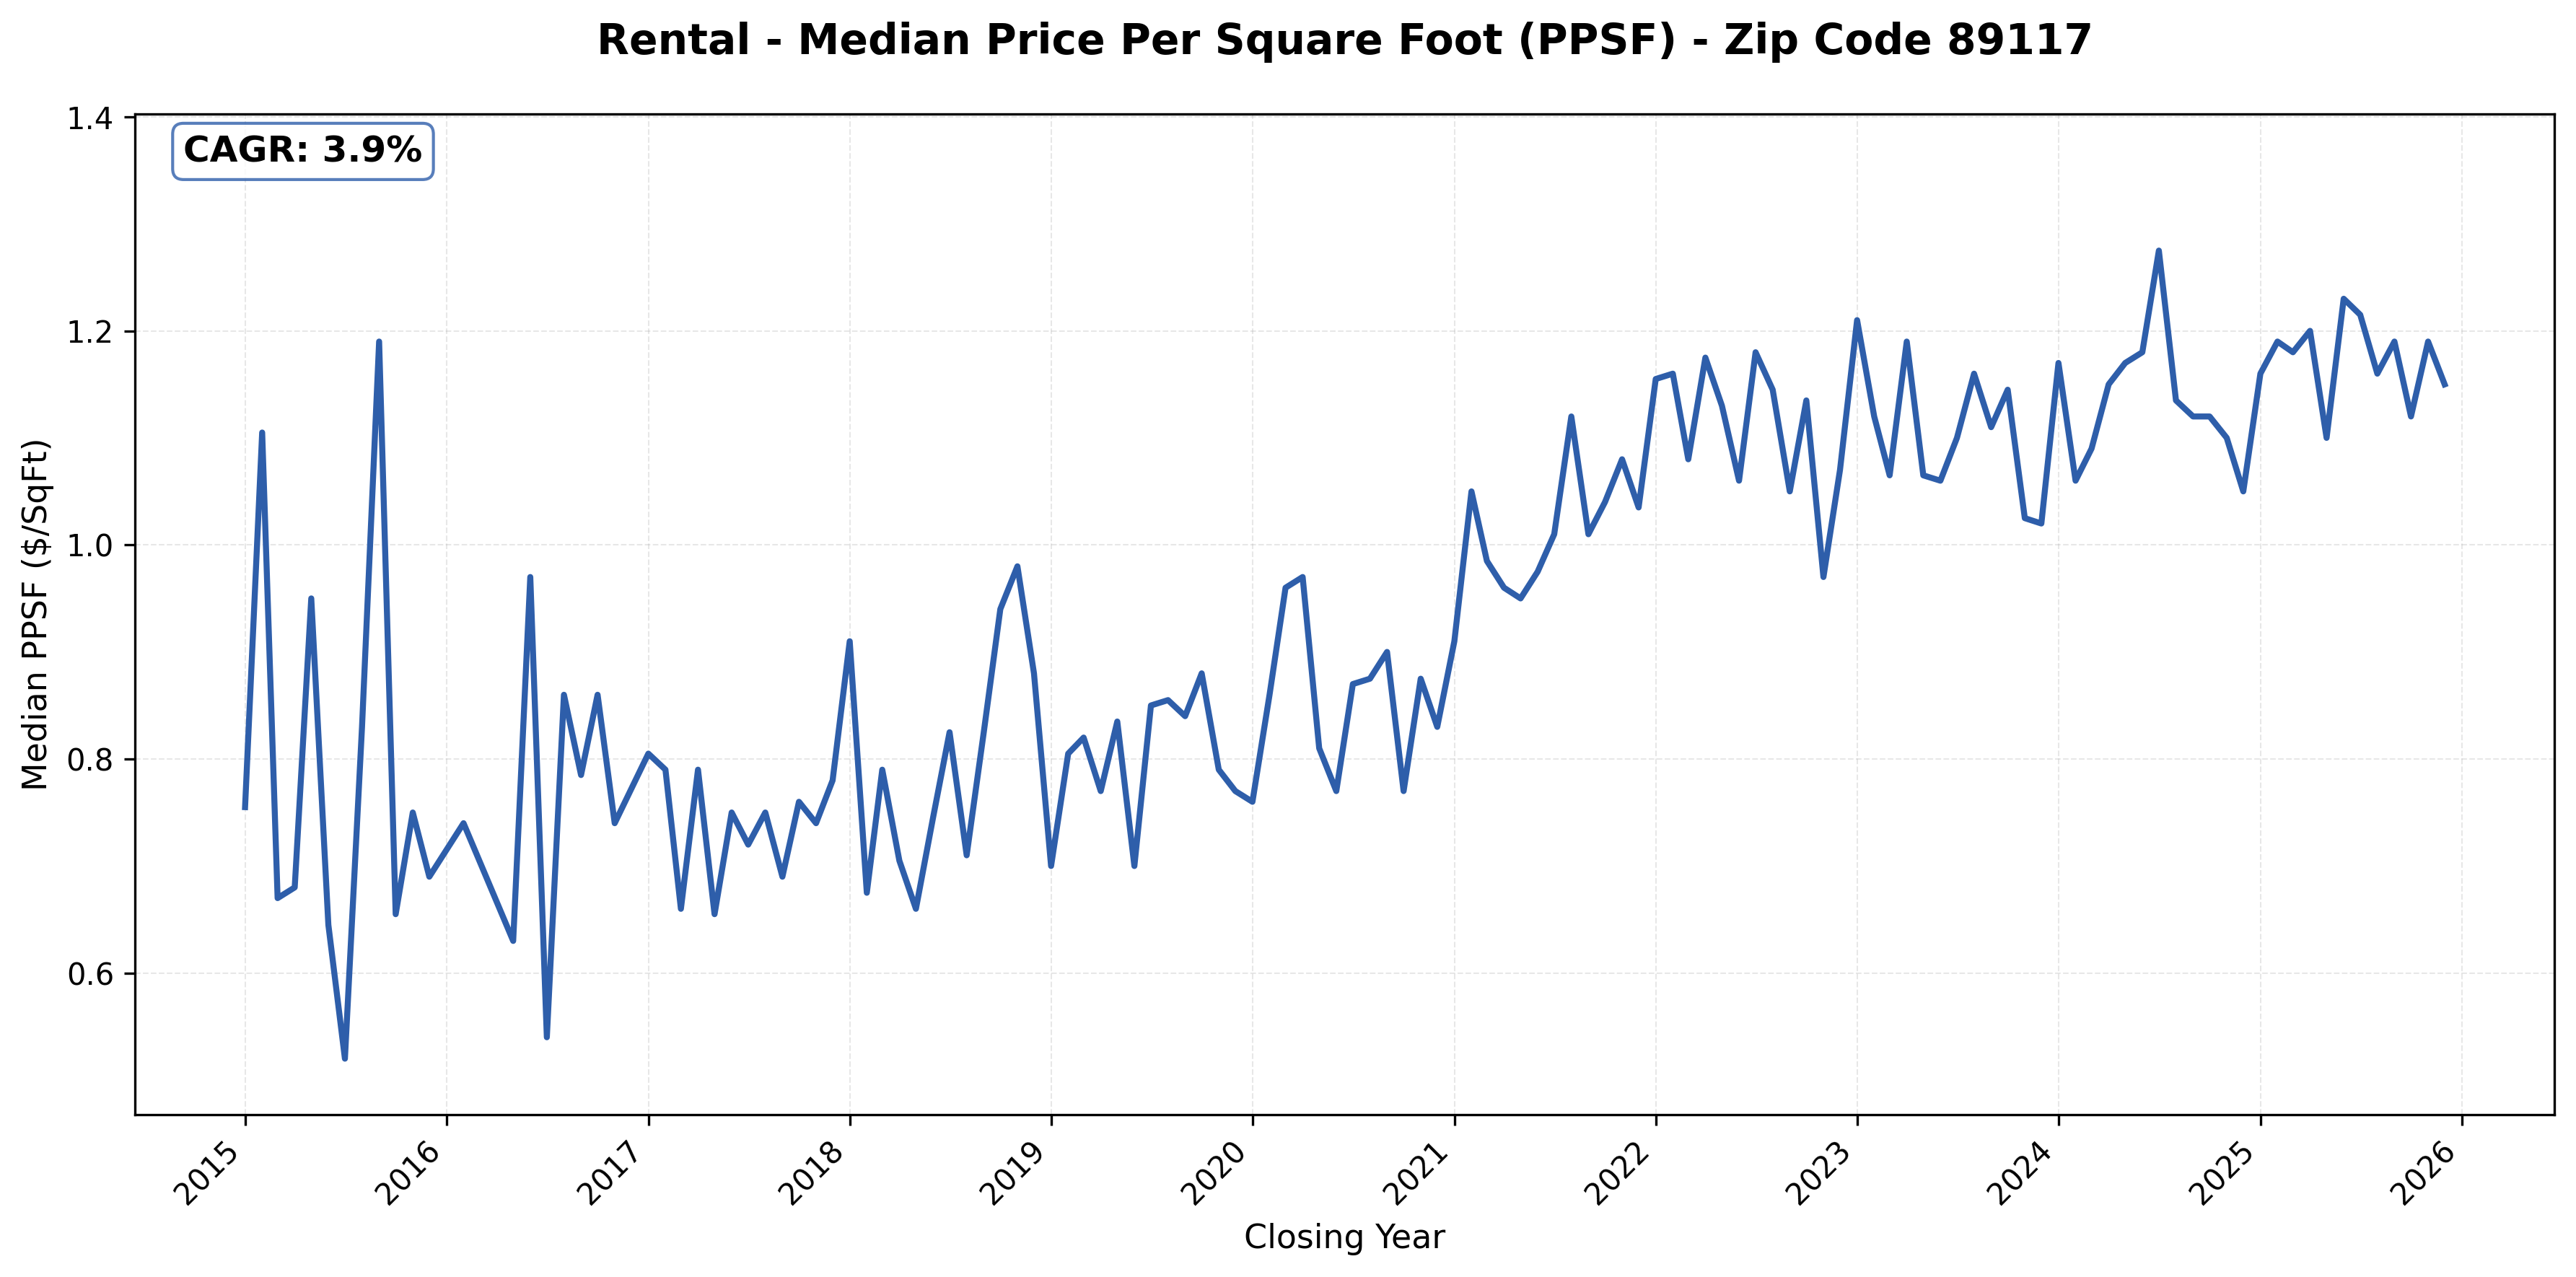
#28: 89117 (West, Summerlin adjacent), 3.9% CAGR
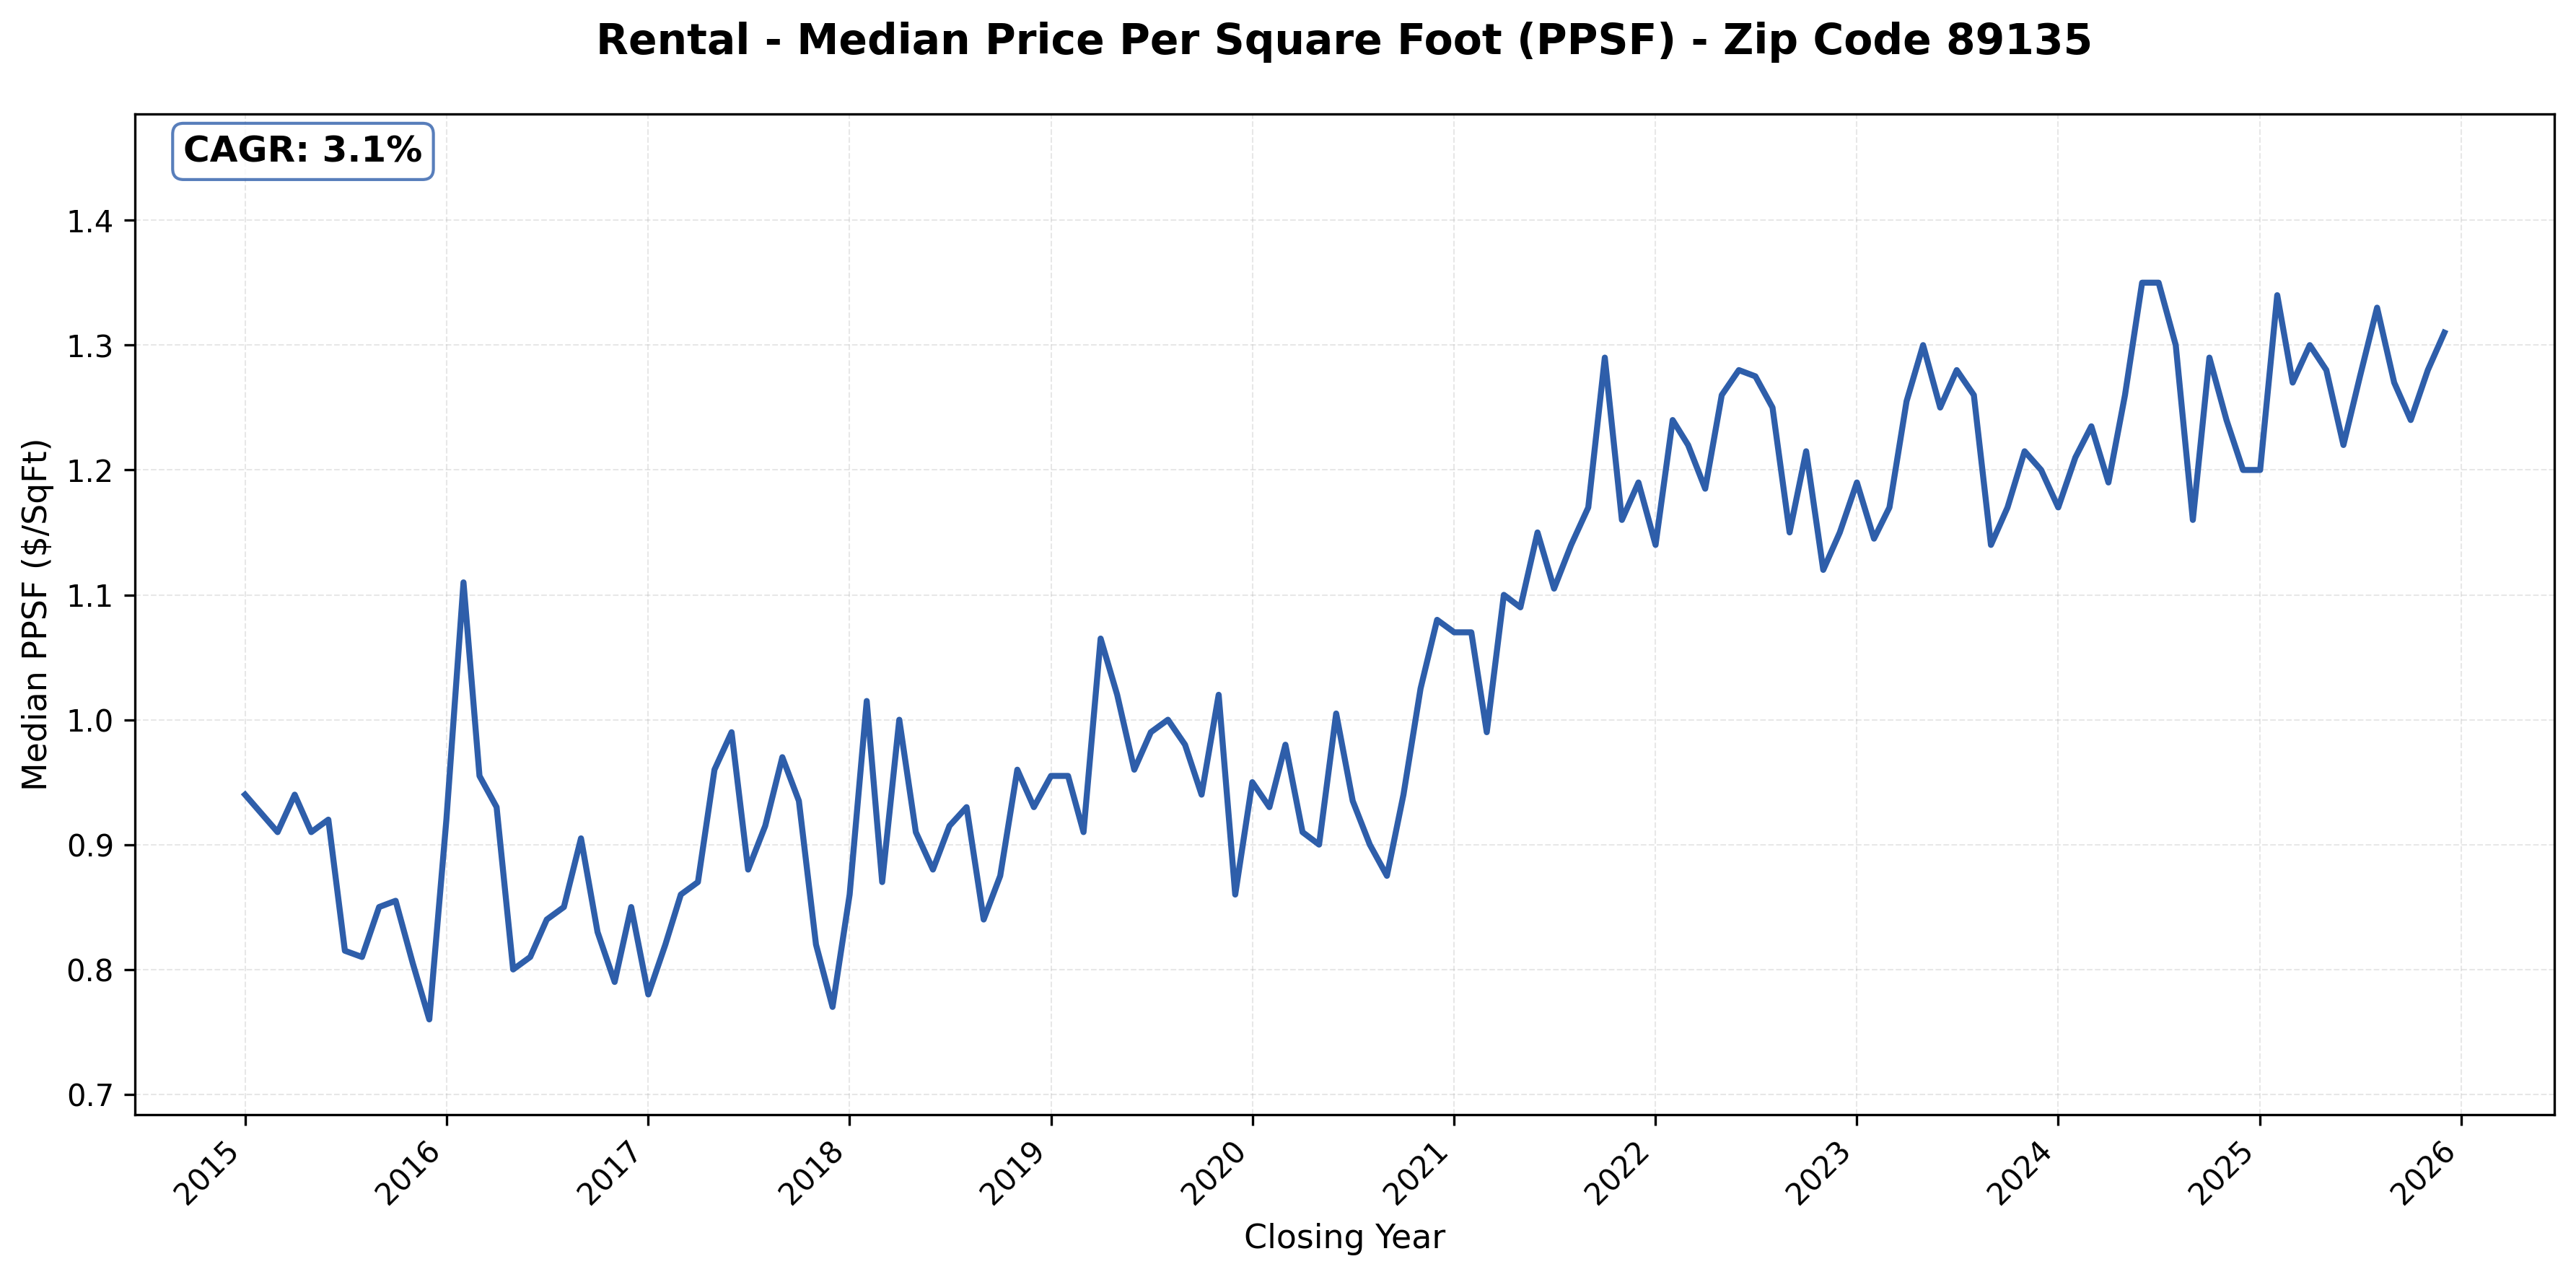
#29: 89135 (Summerlin), 3.1% CAGR
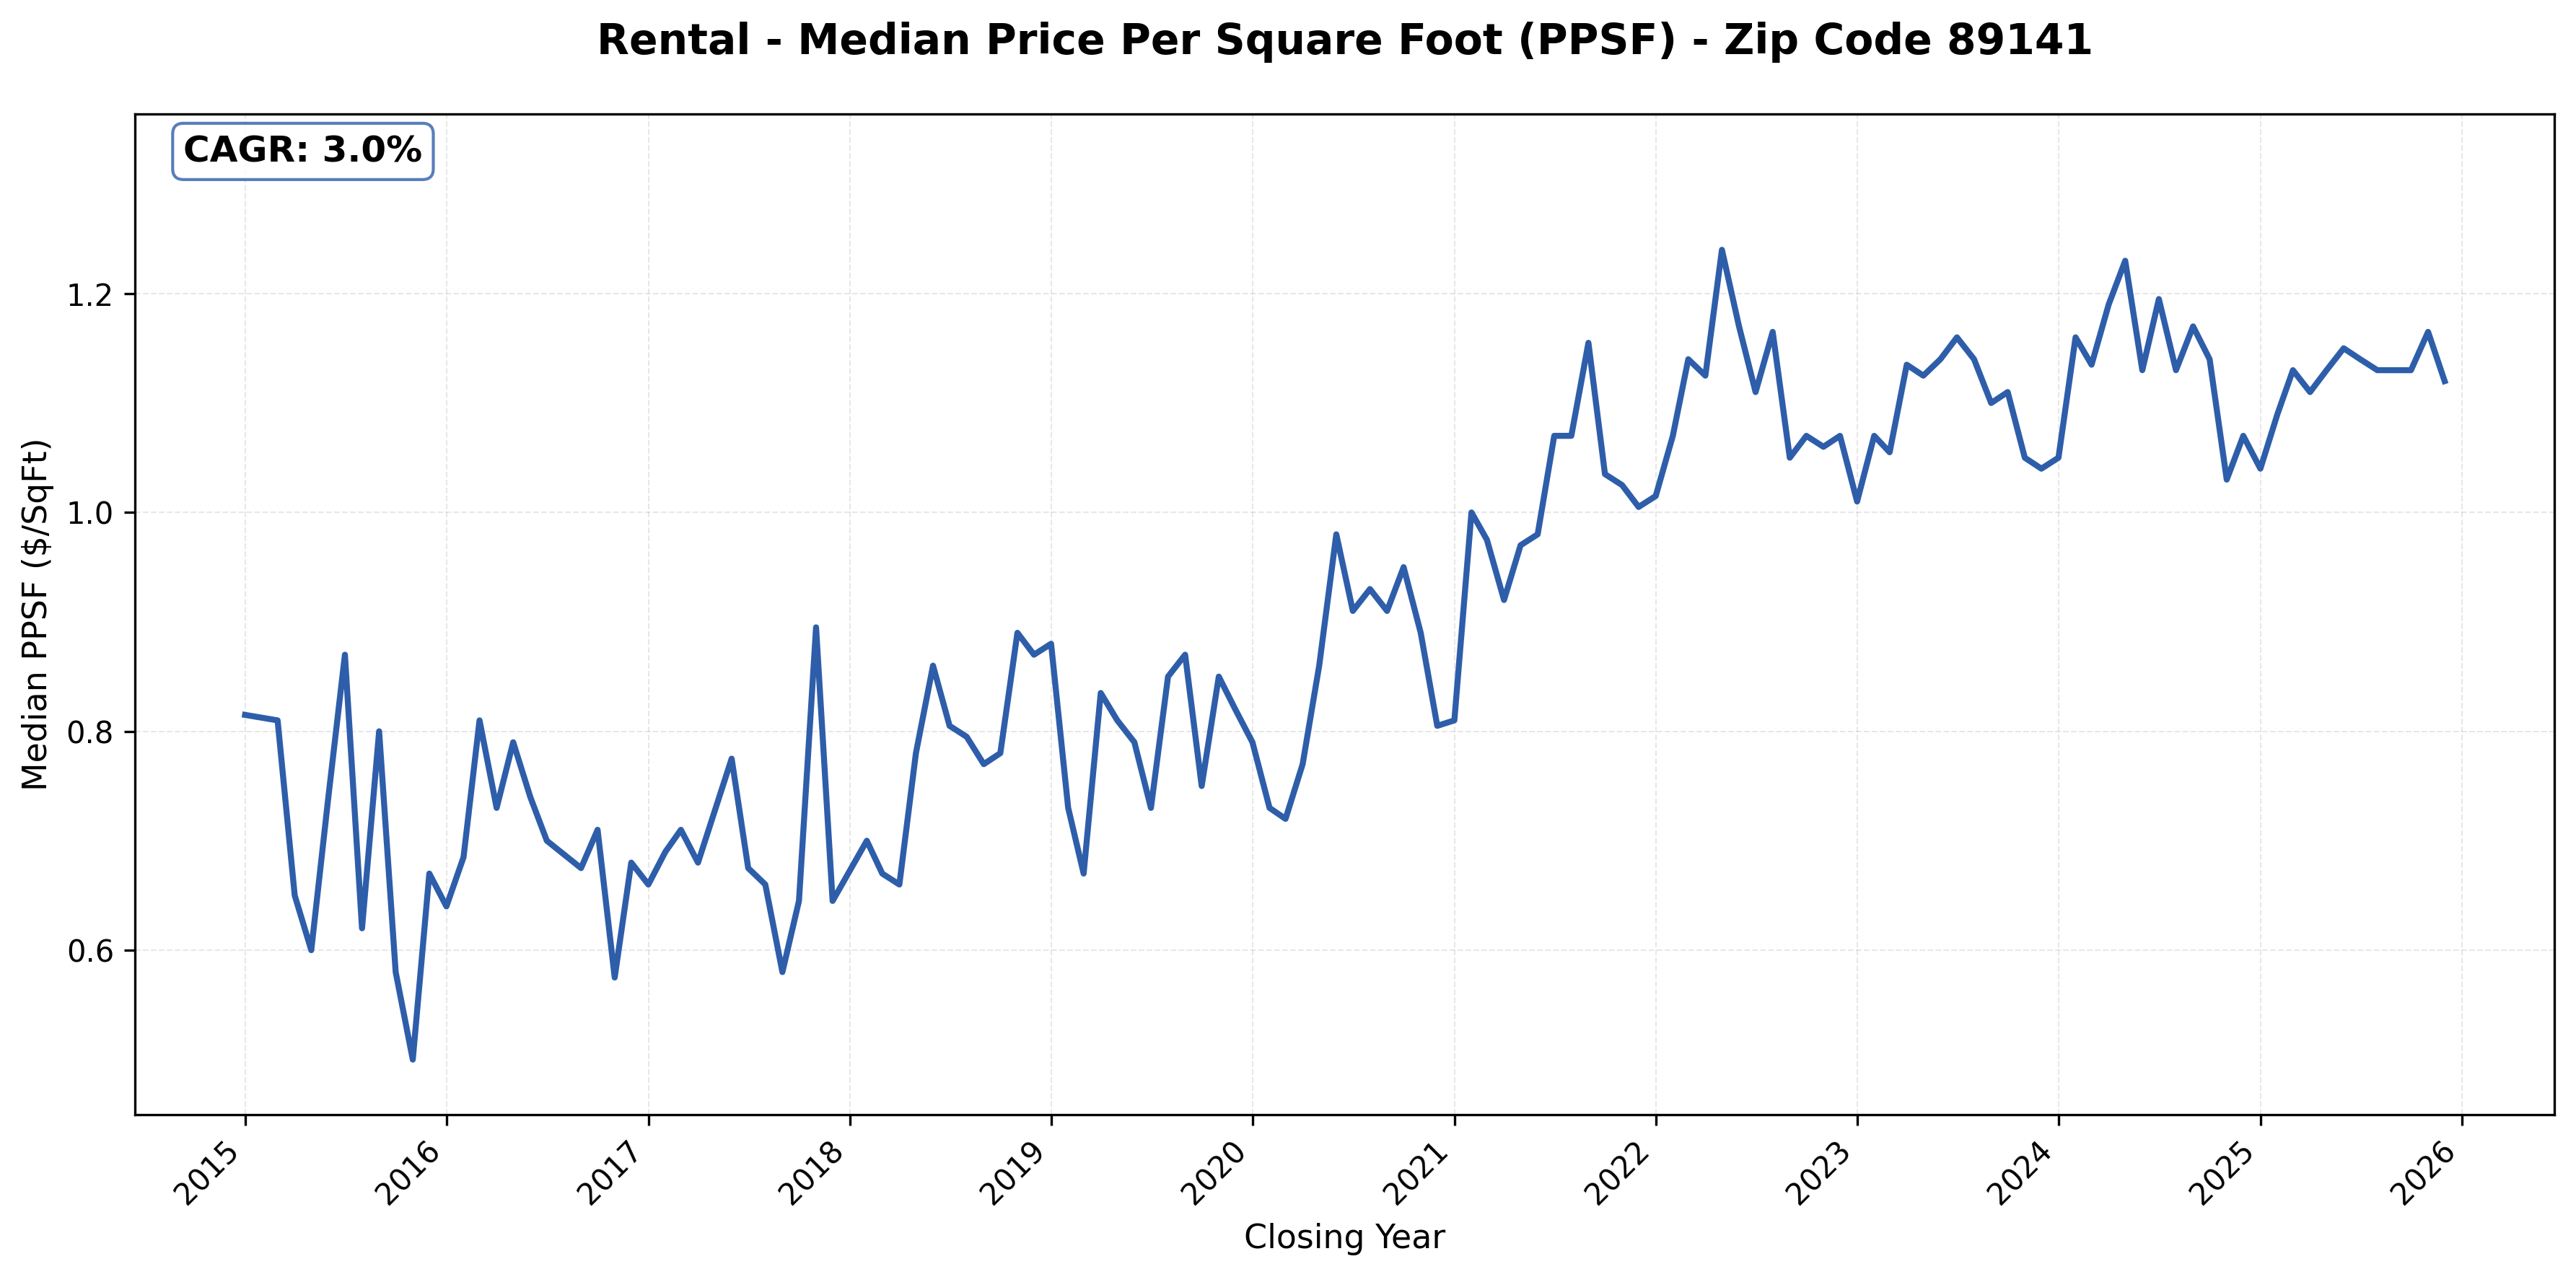
#30: 89141 (Southern Highland), 3.0% CAGR
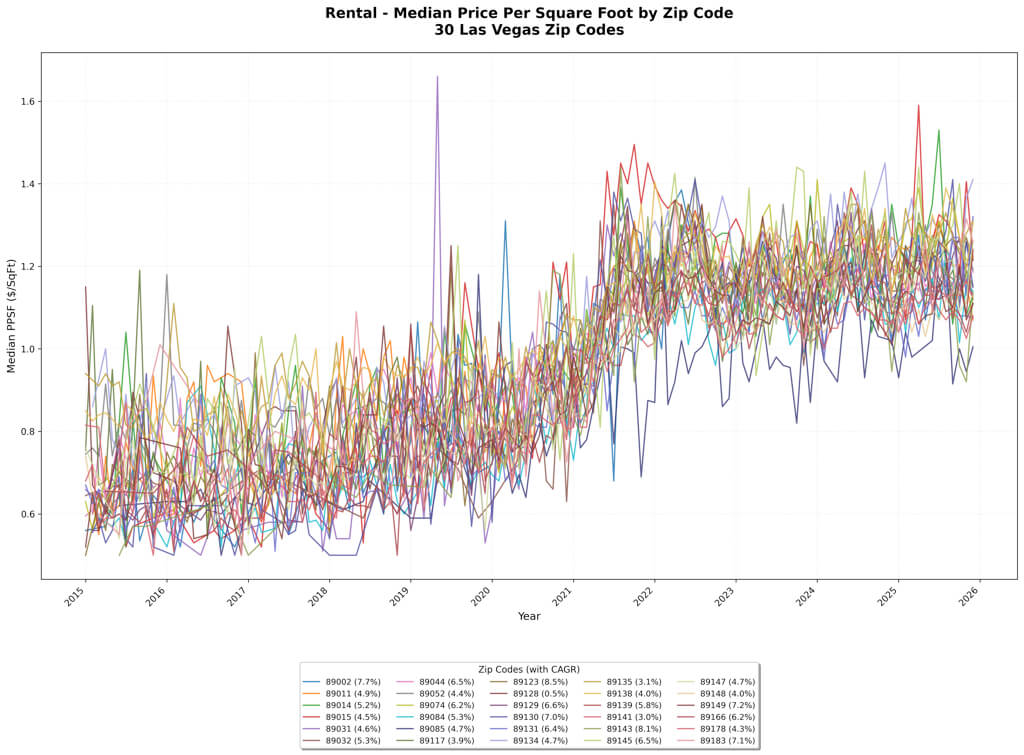
Below are all the zip code rent growth lines on a single chart.
Combined Rental Market – All Zip Codes Comparison
Appreciation by Zip Code
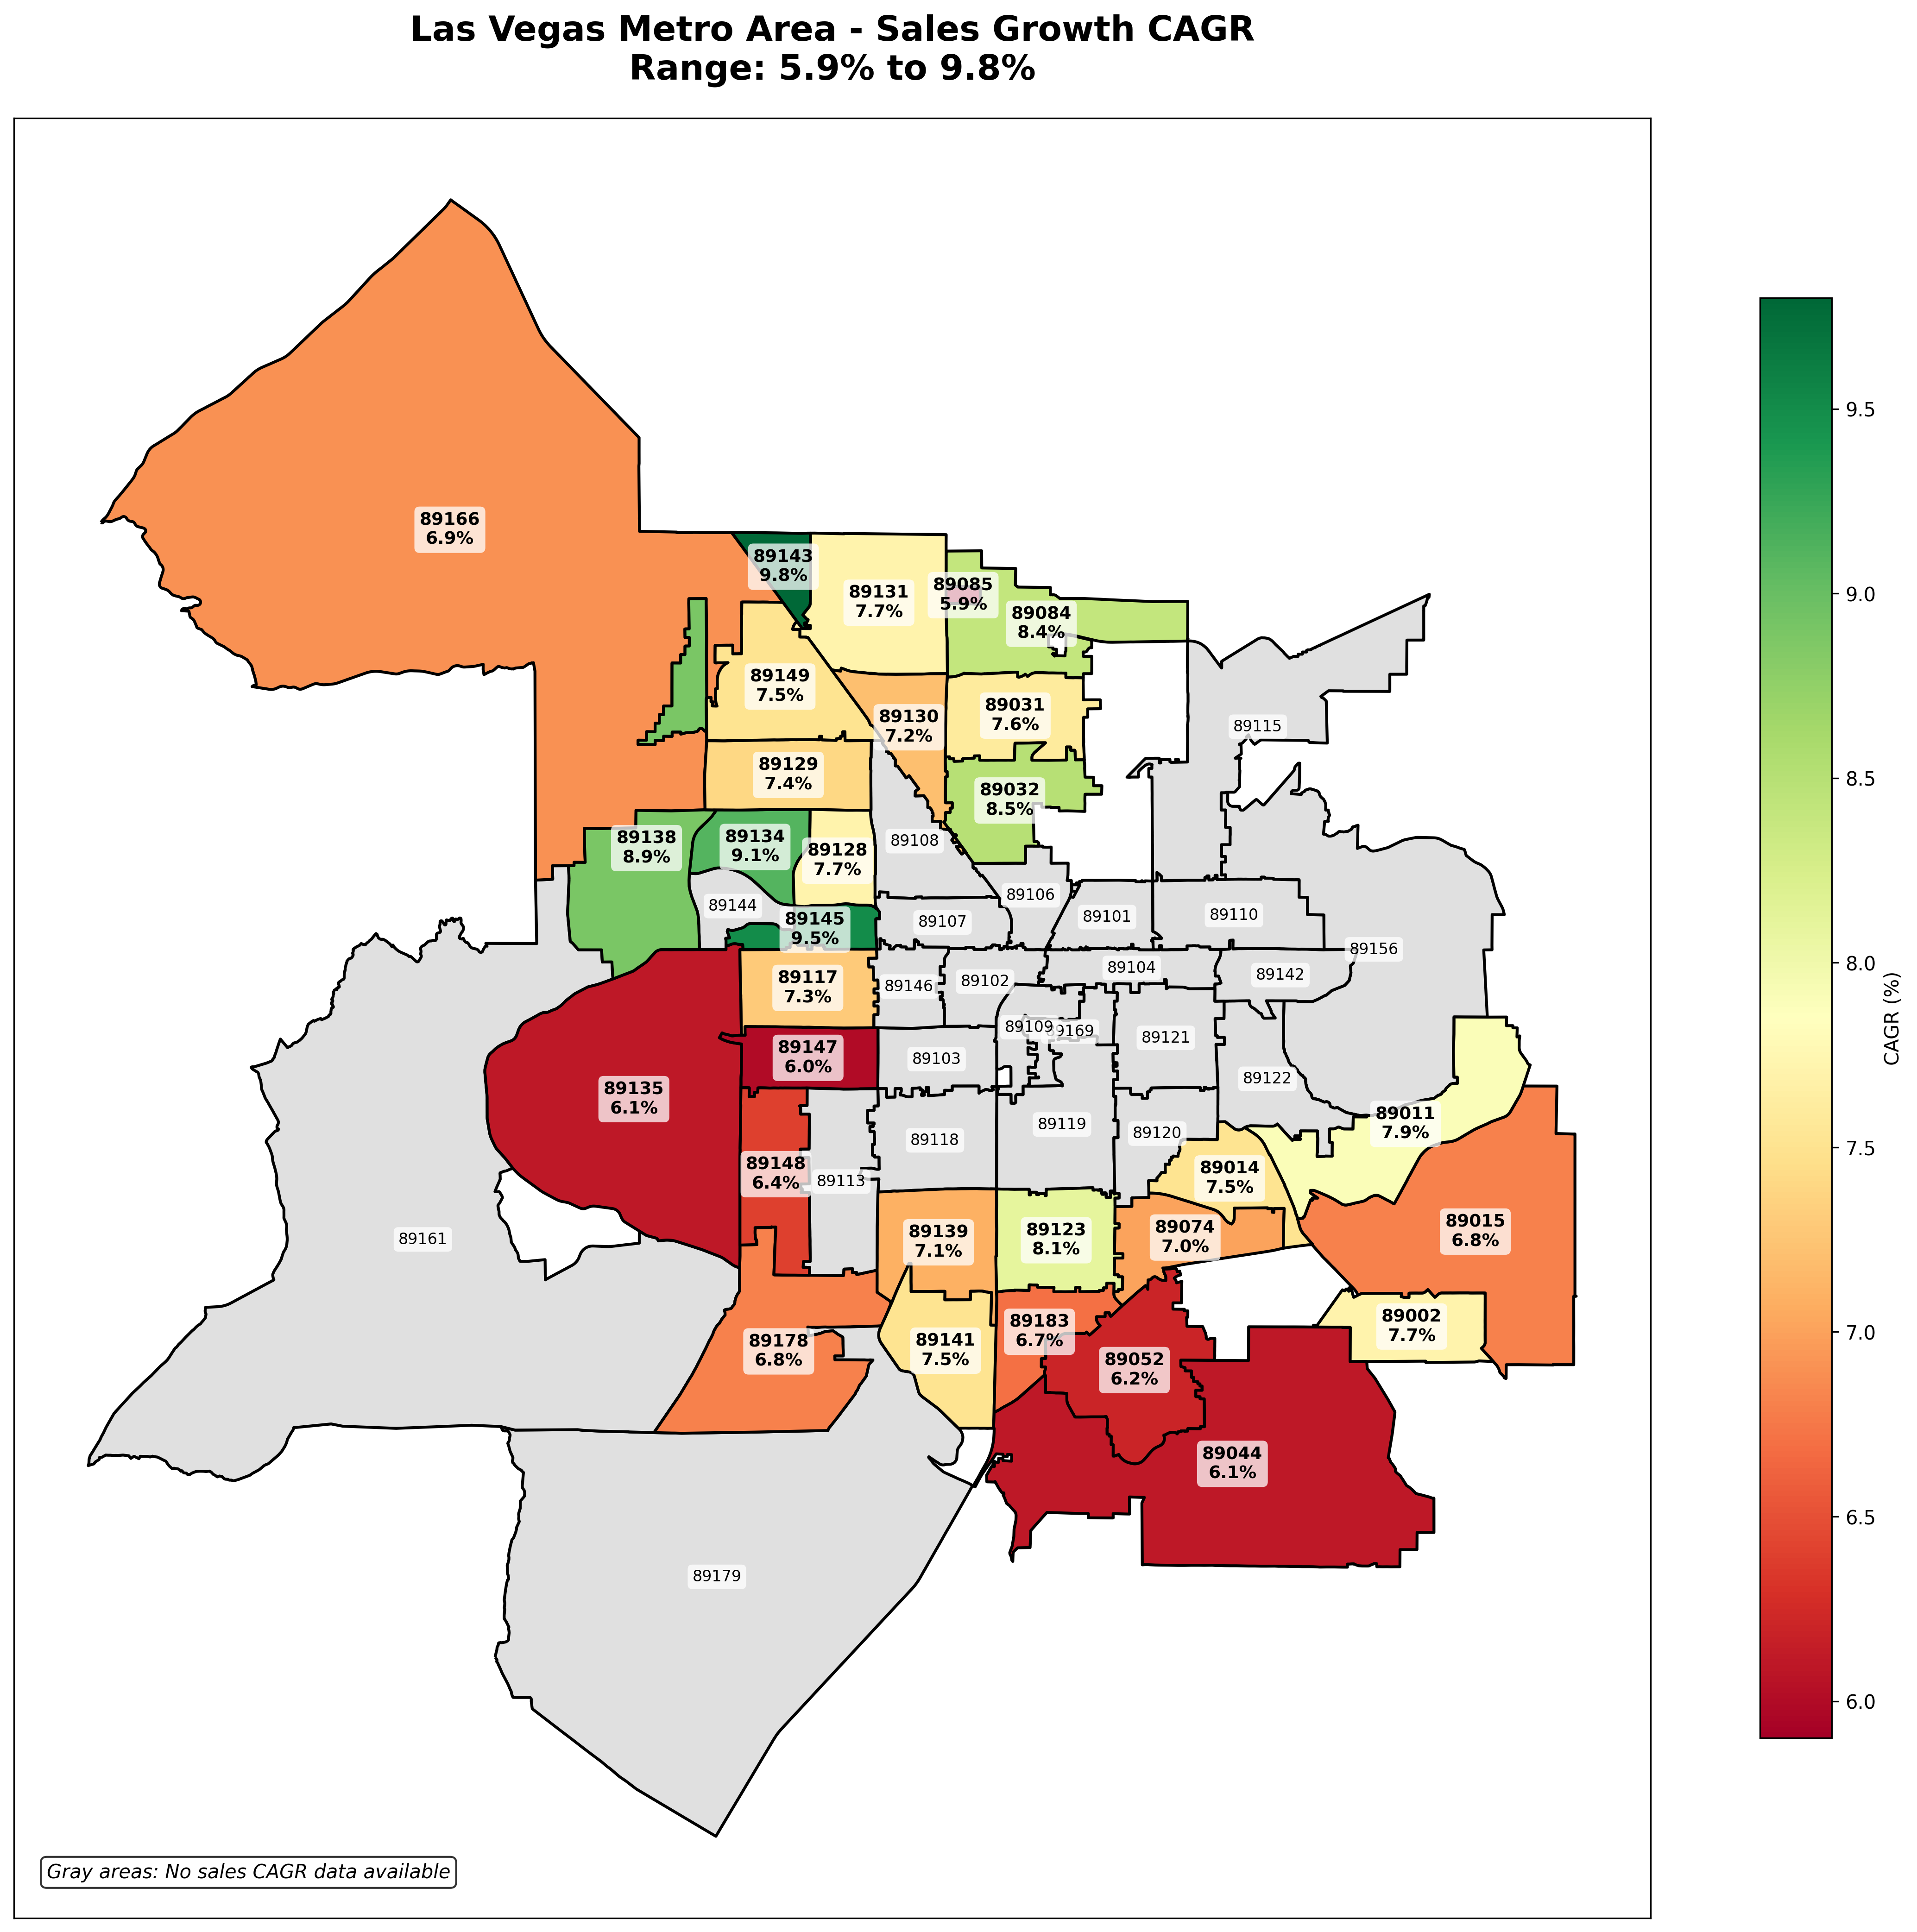
Below is a heat map overview of the 10-year appreciation rates for the listed zip codes.
Las Vegas Sales Market Heatmap – CAGR by Zip Code
Below are individual zip code appreciation charts sorted from highest to lowest.
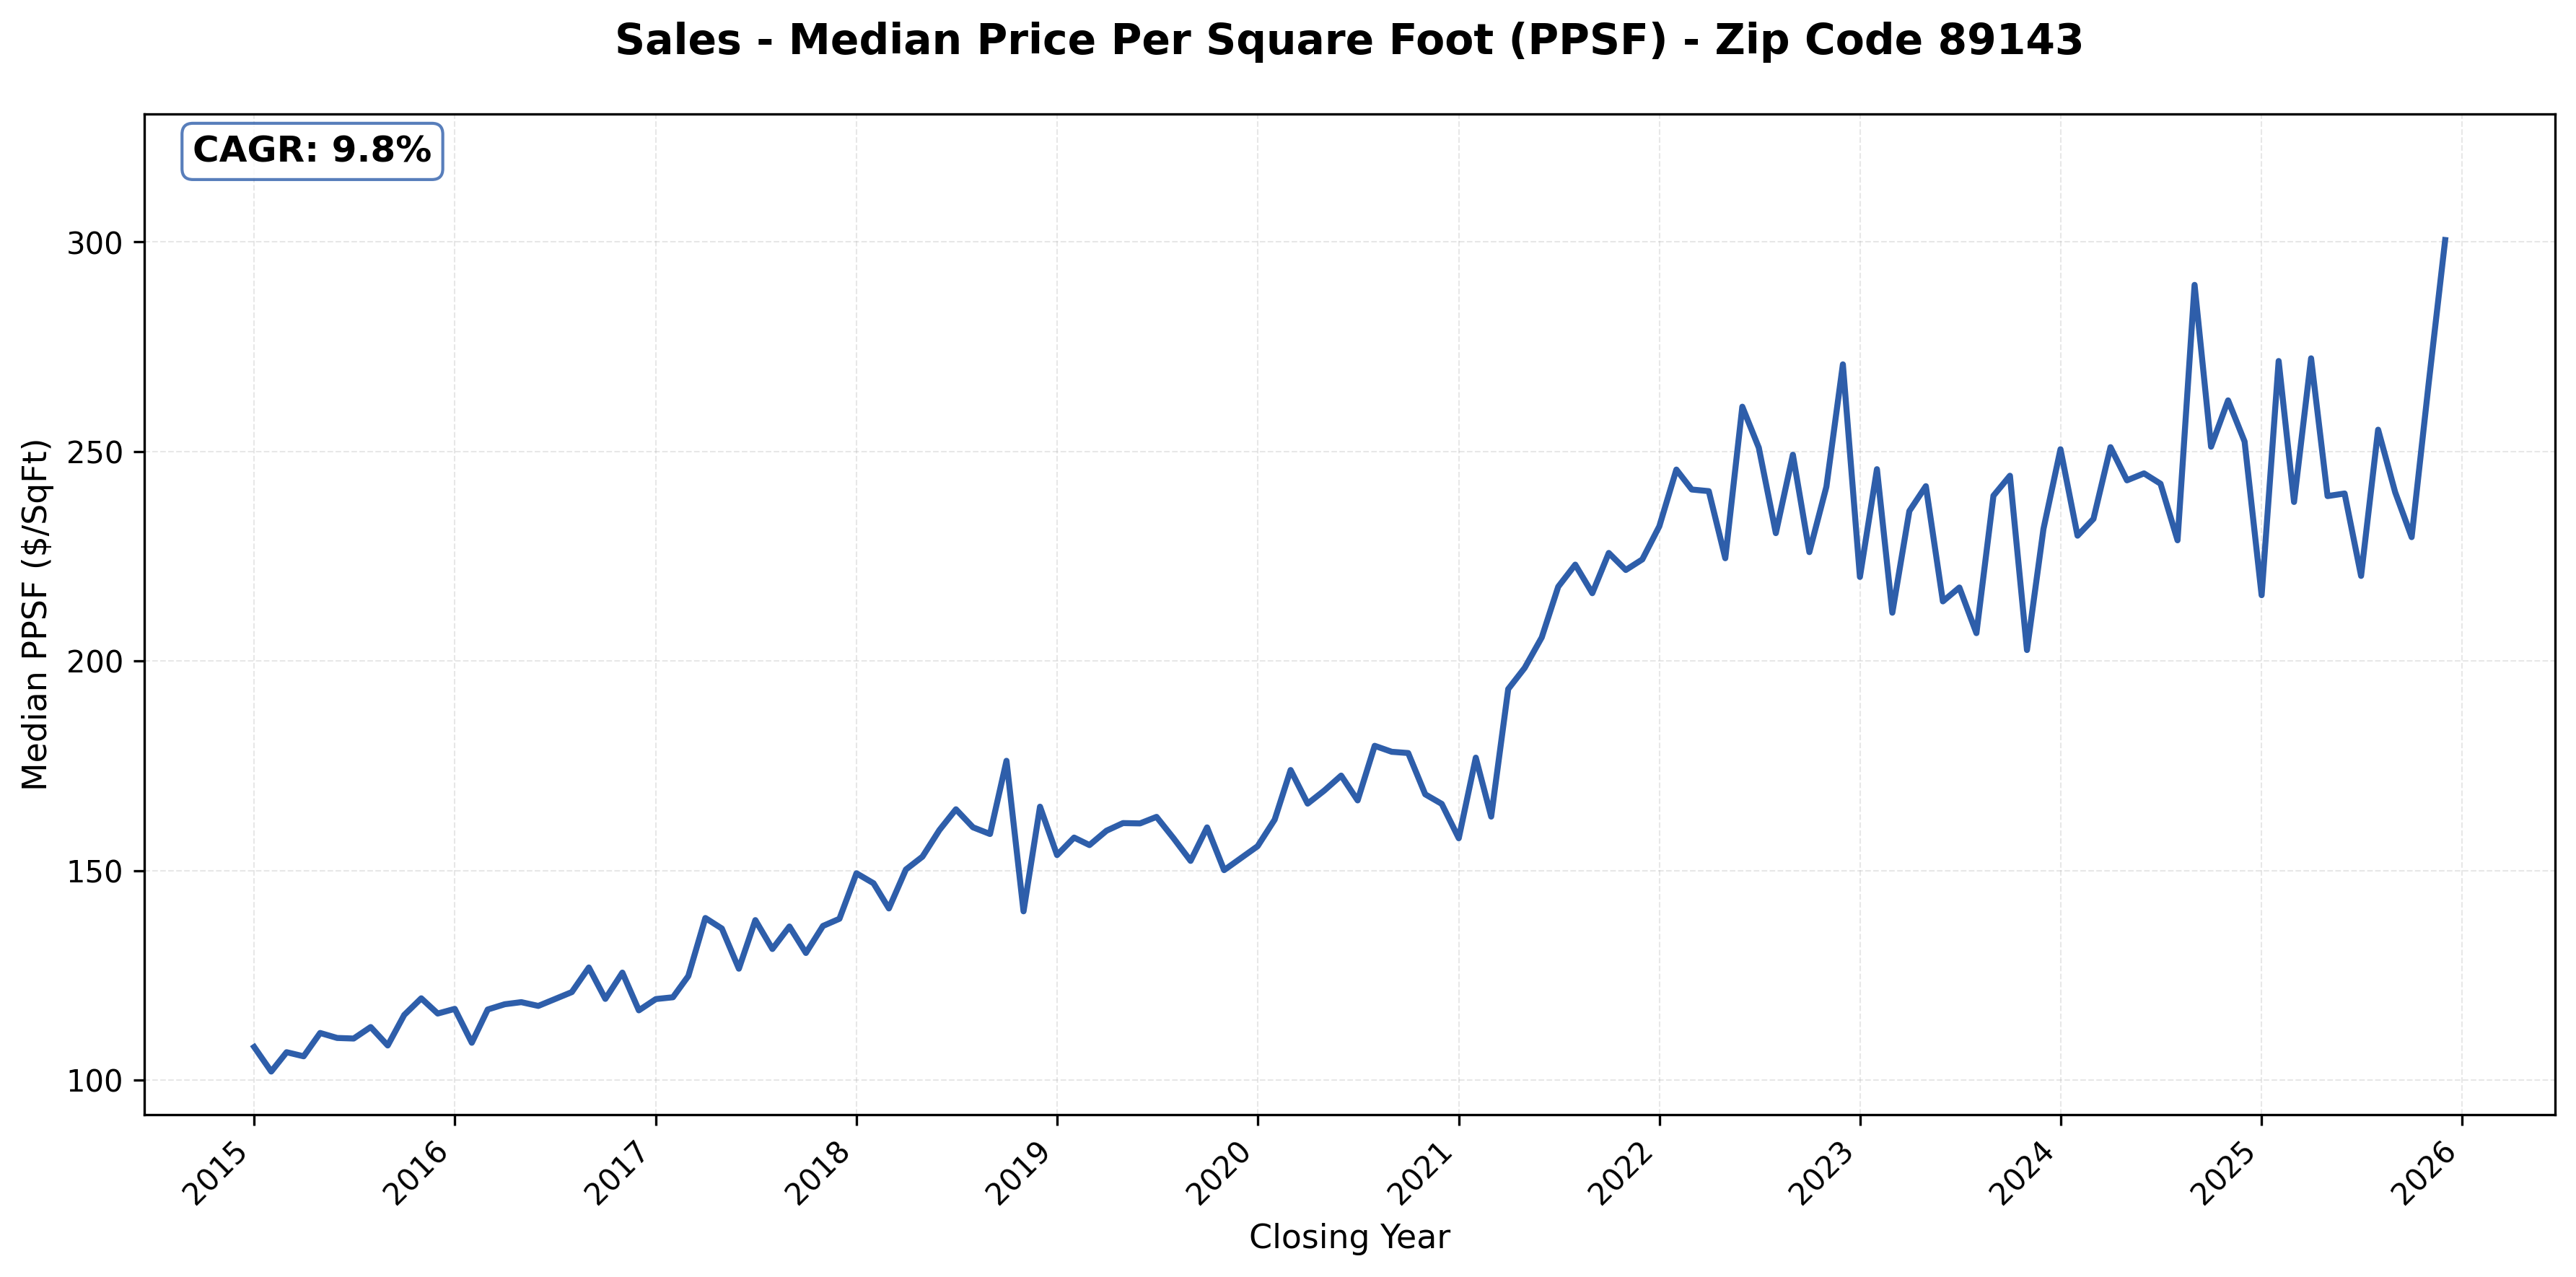
#1: 89143 (Centennial Hills), 9.8% CAGR
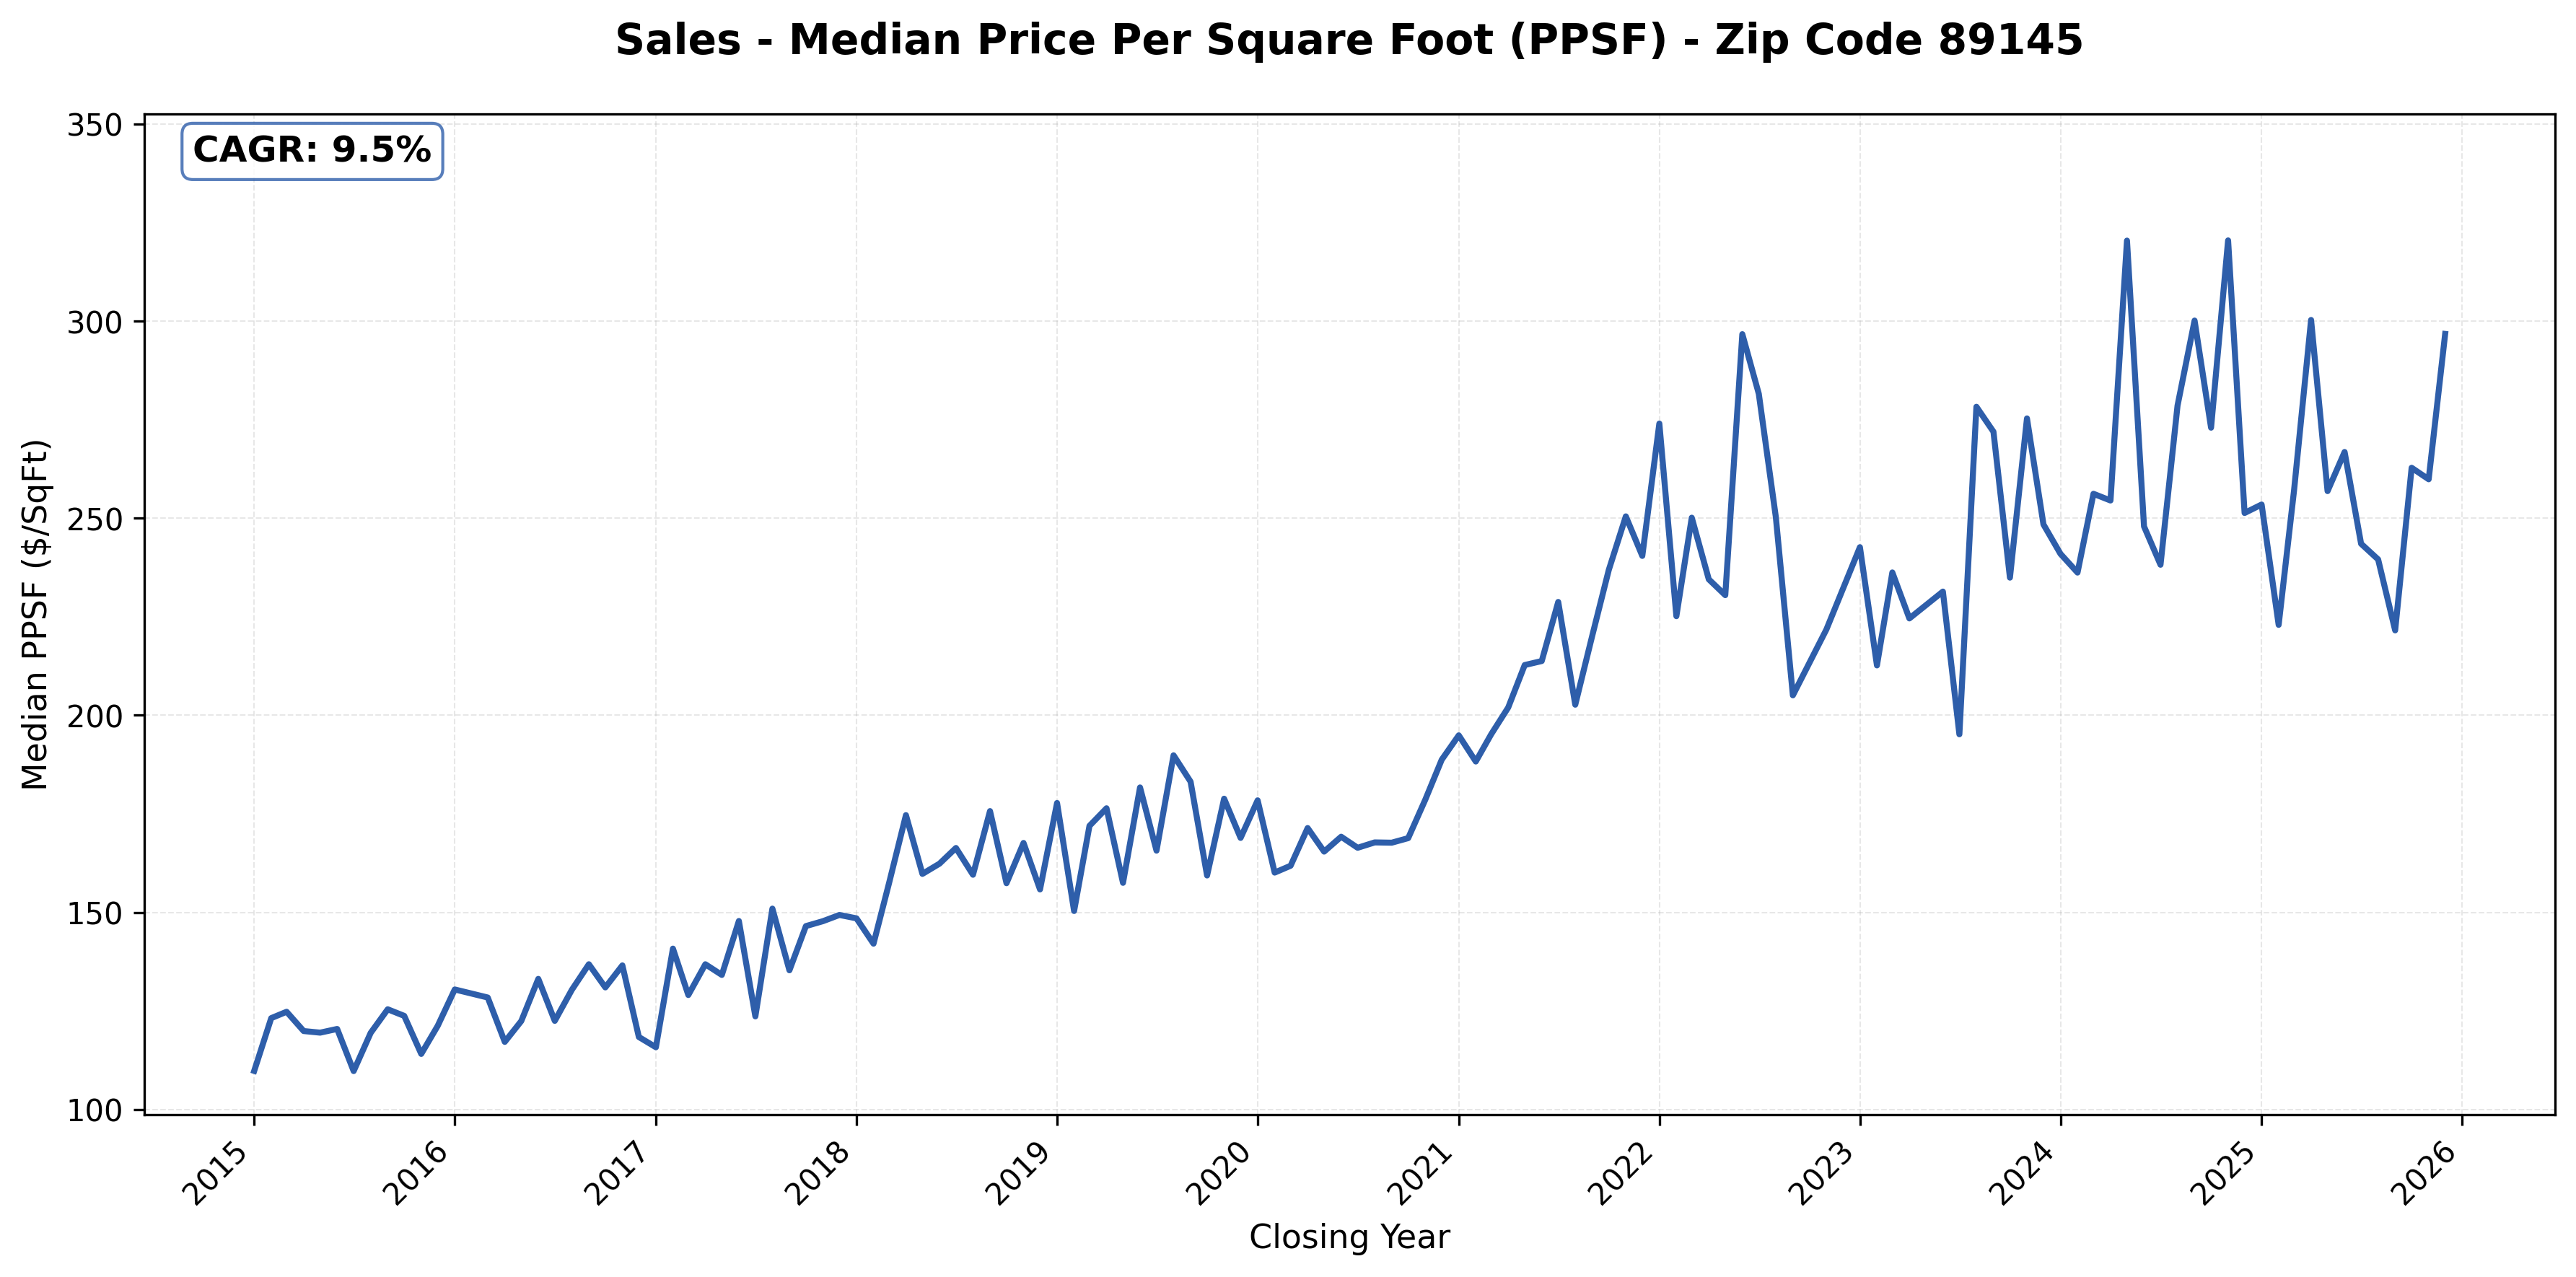
#2: 89145 (West, Summerlin adjacent), 9.5% CAGR
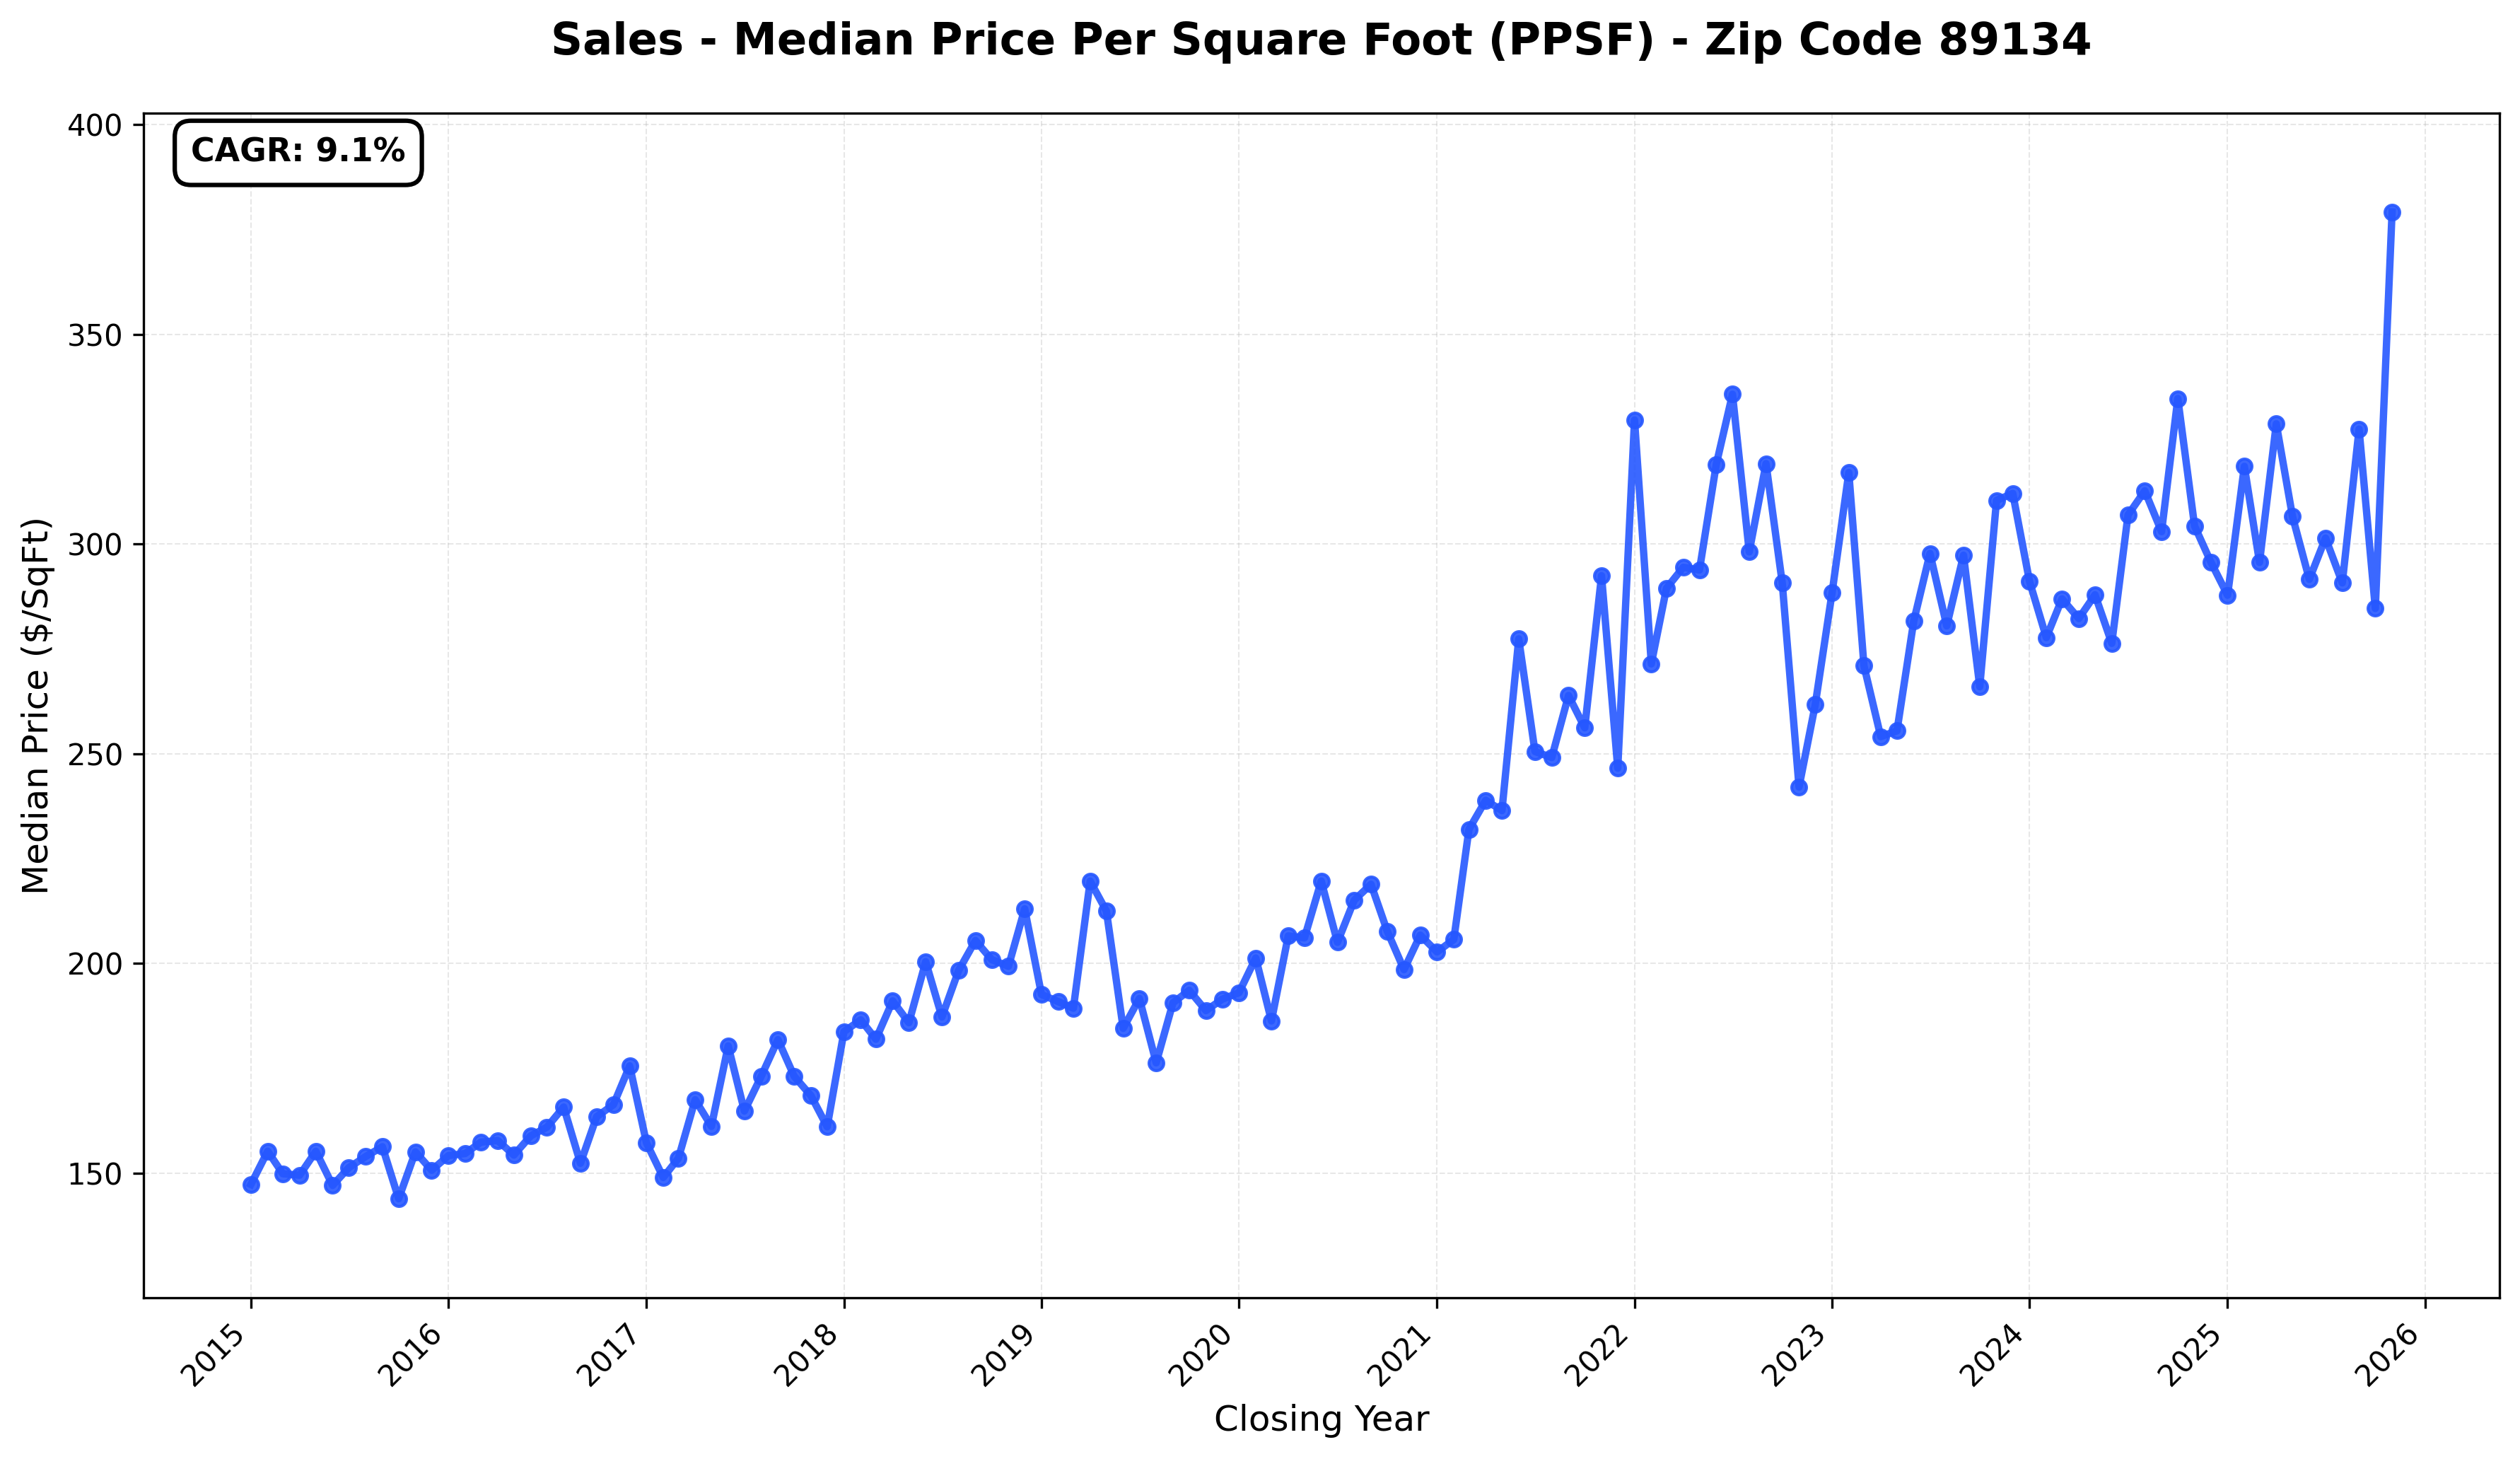
#3: 89134 (Summerlin), 9.1% CAGR
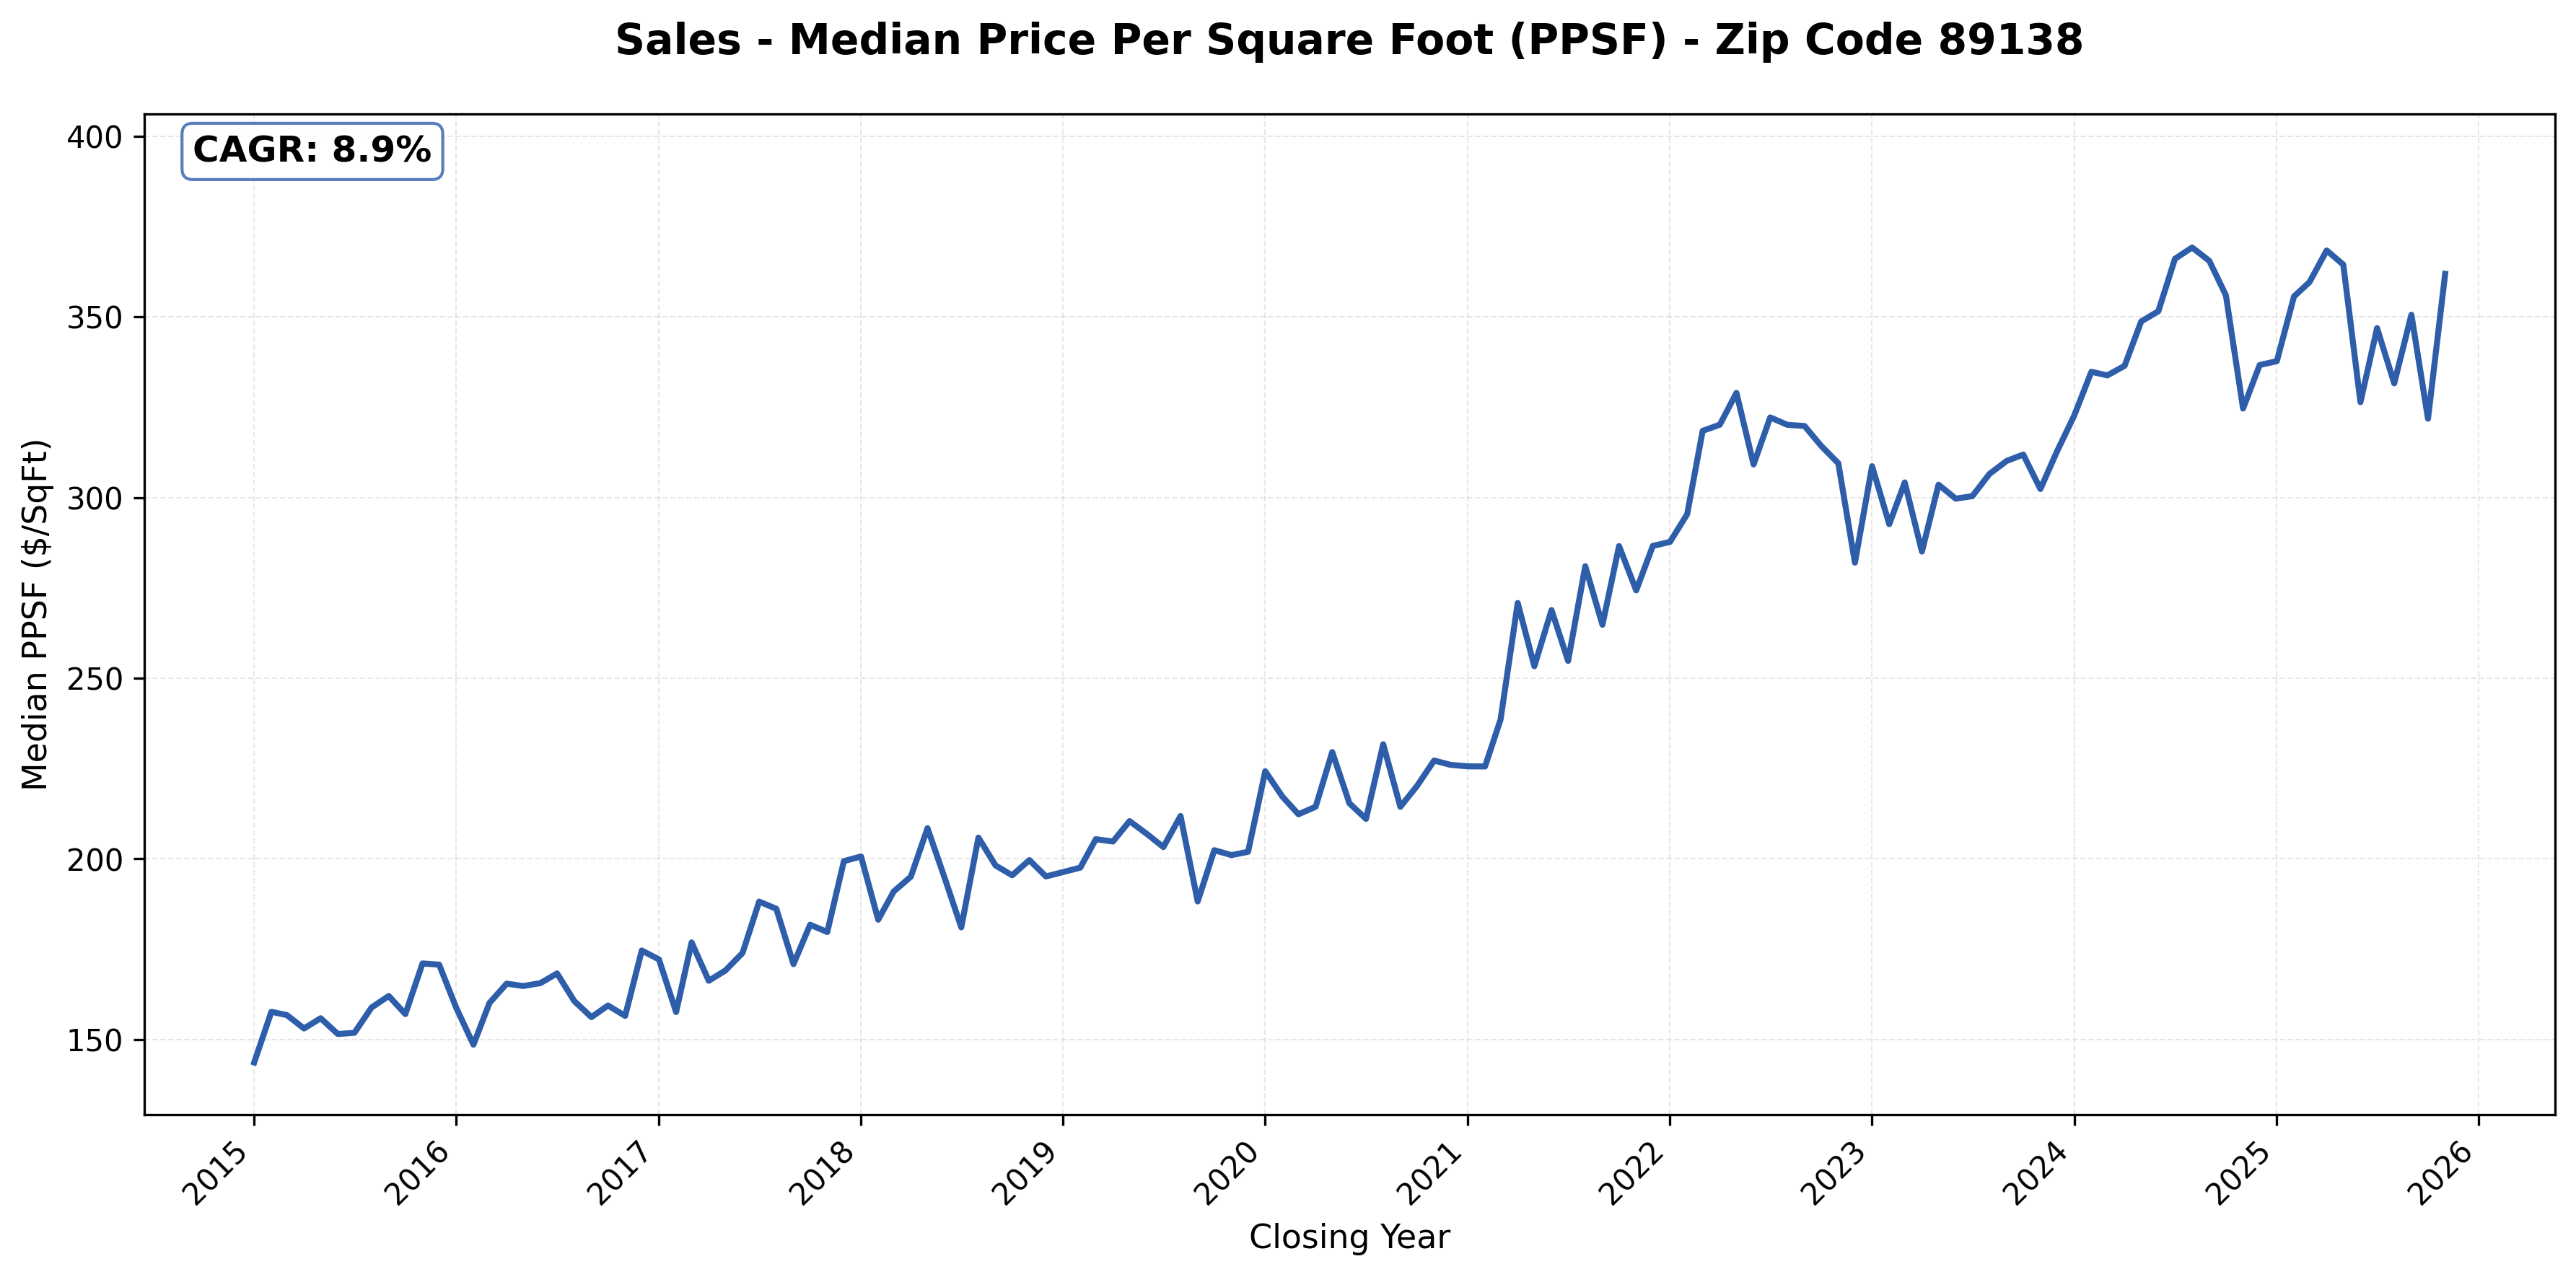
#4: 89138 (Summerlin), 8.9% CAGR
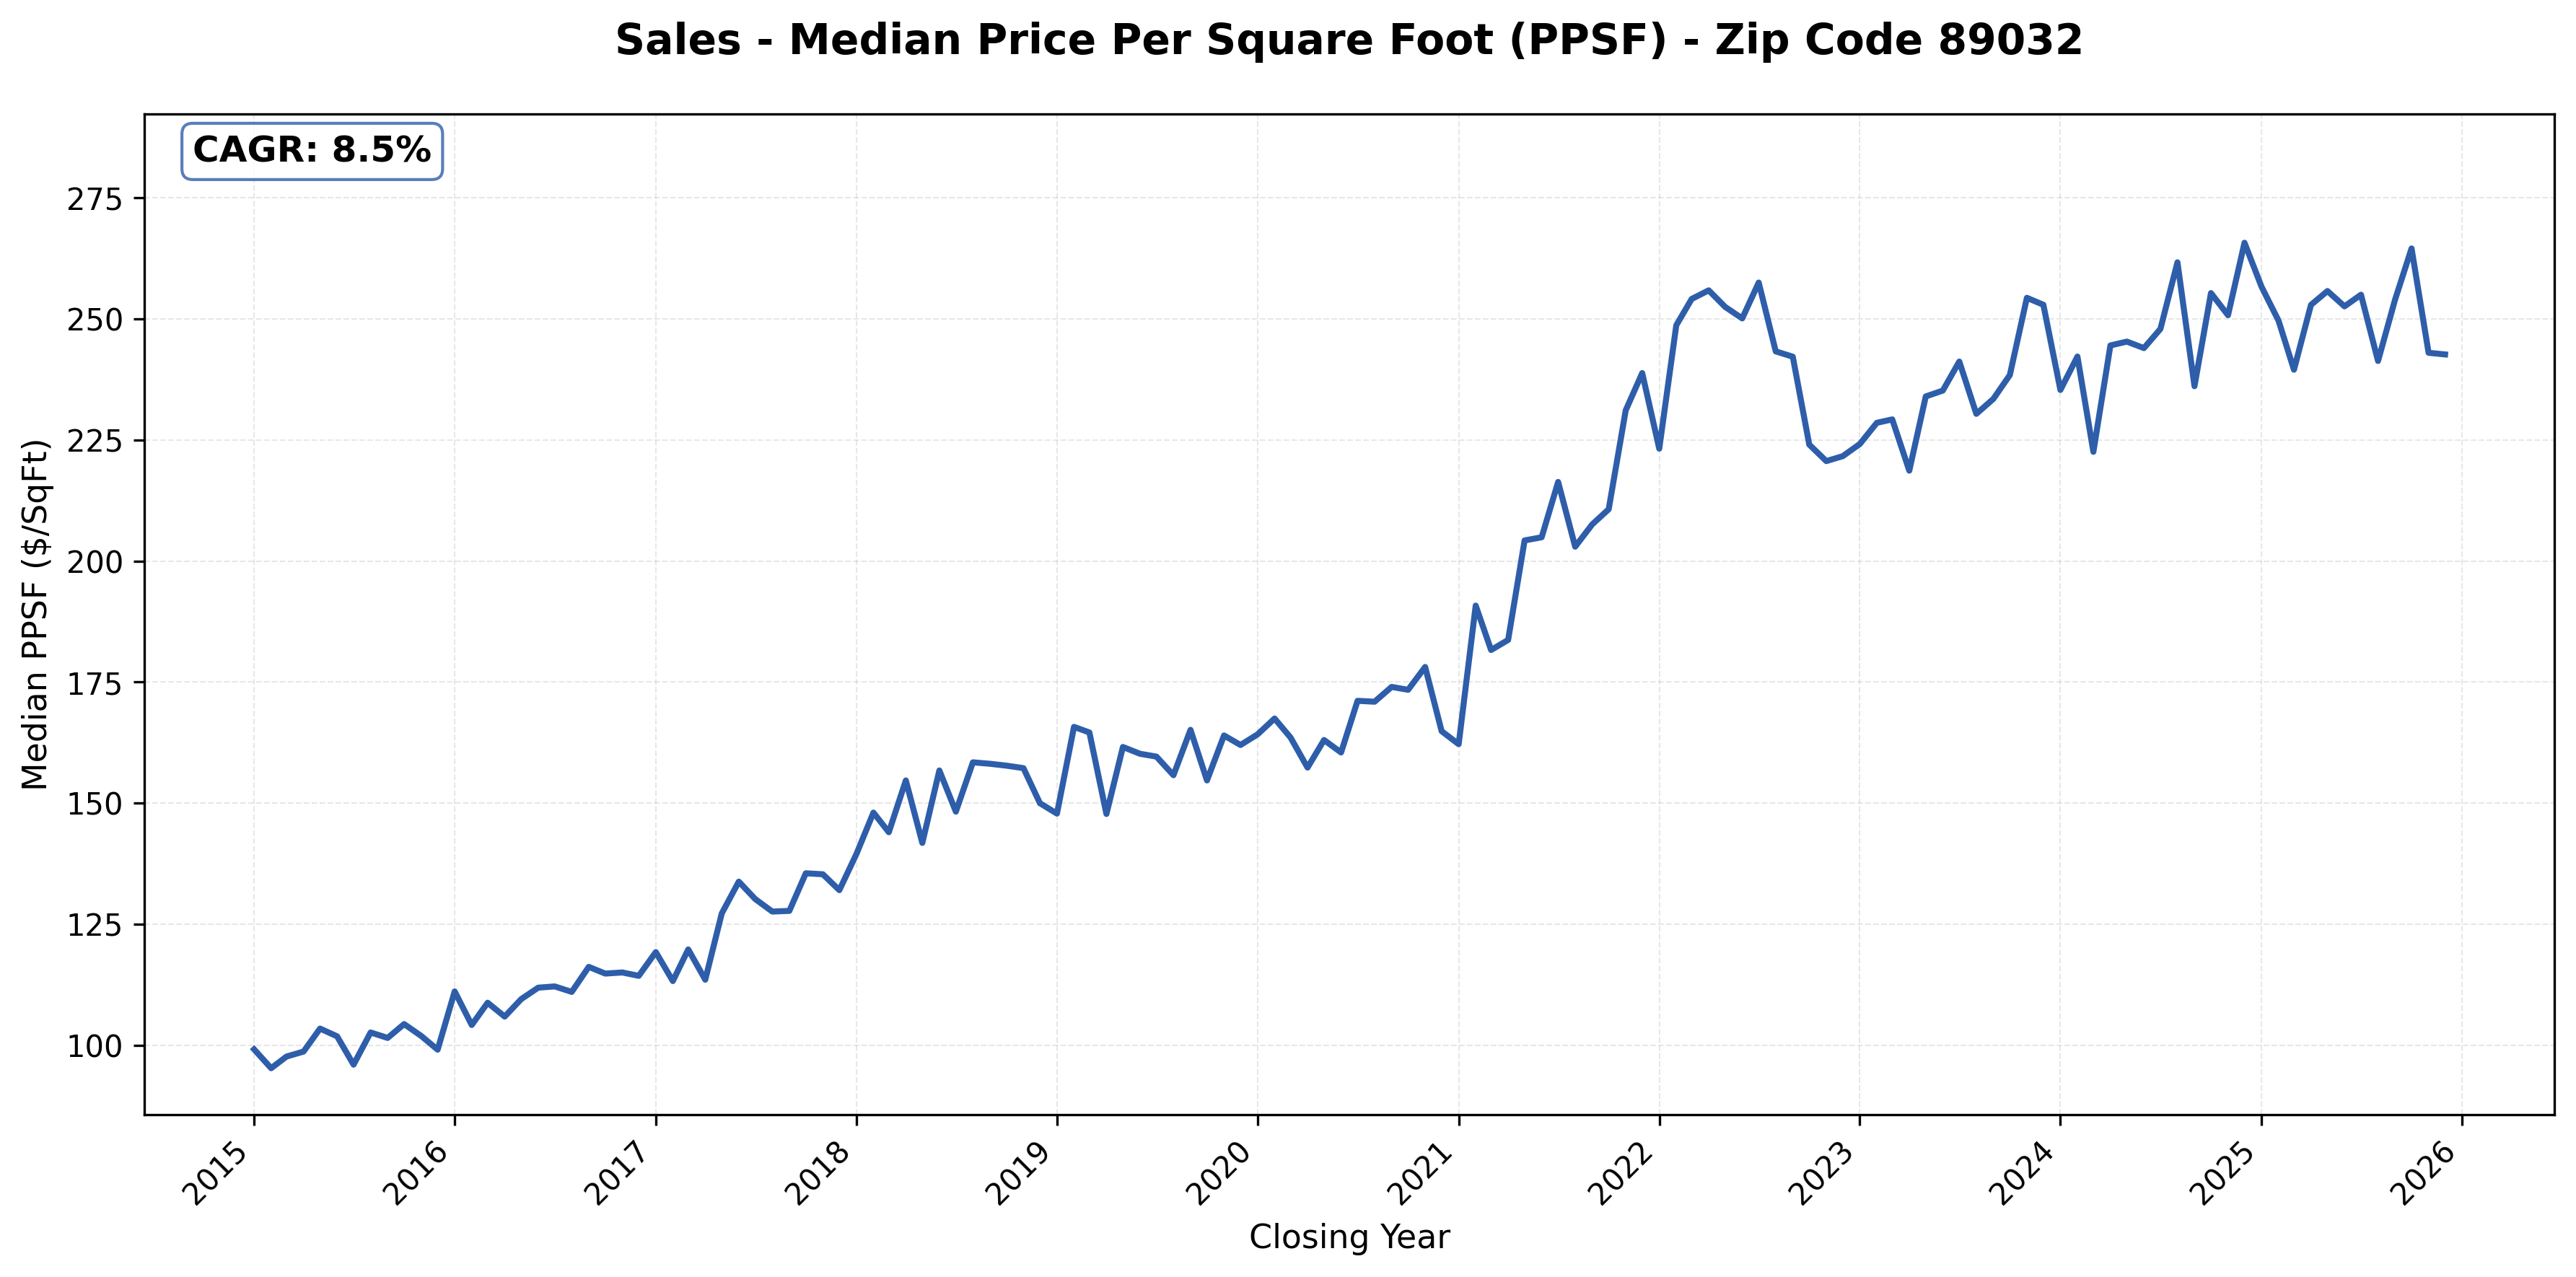
#5: 89032 (North Las Vegas), 8.5% CAGR
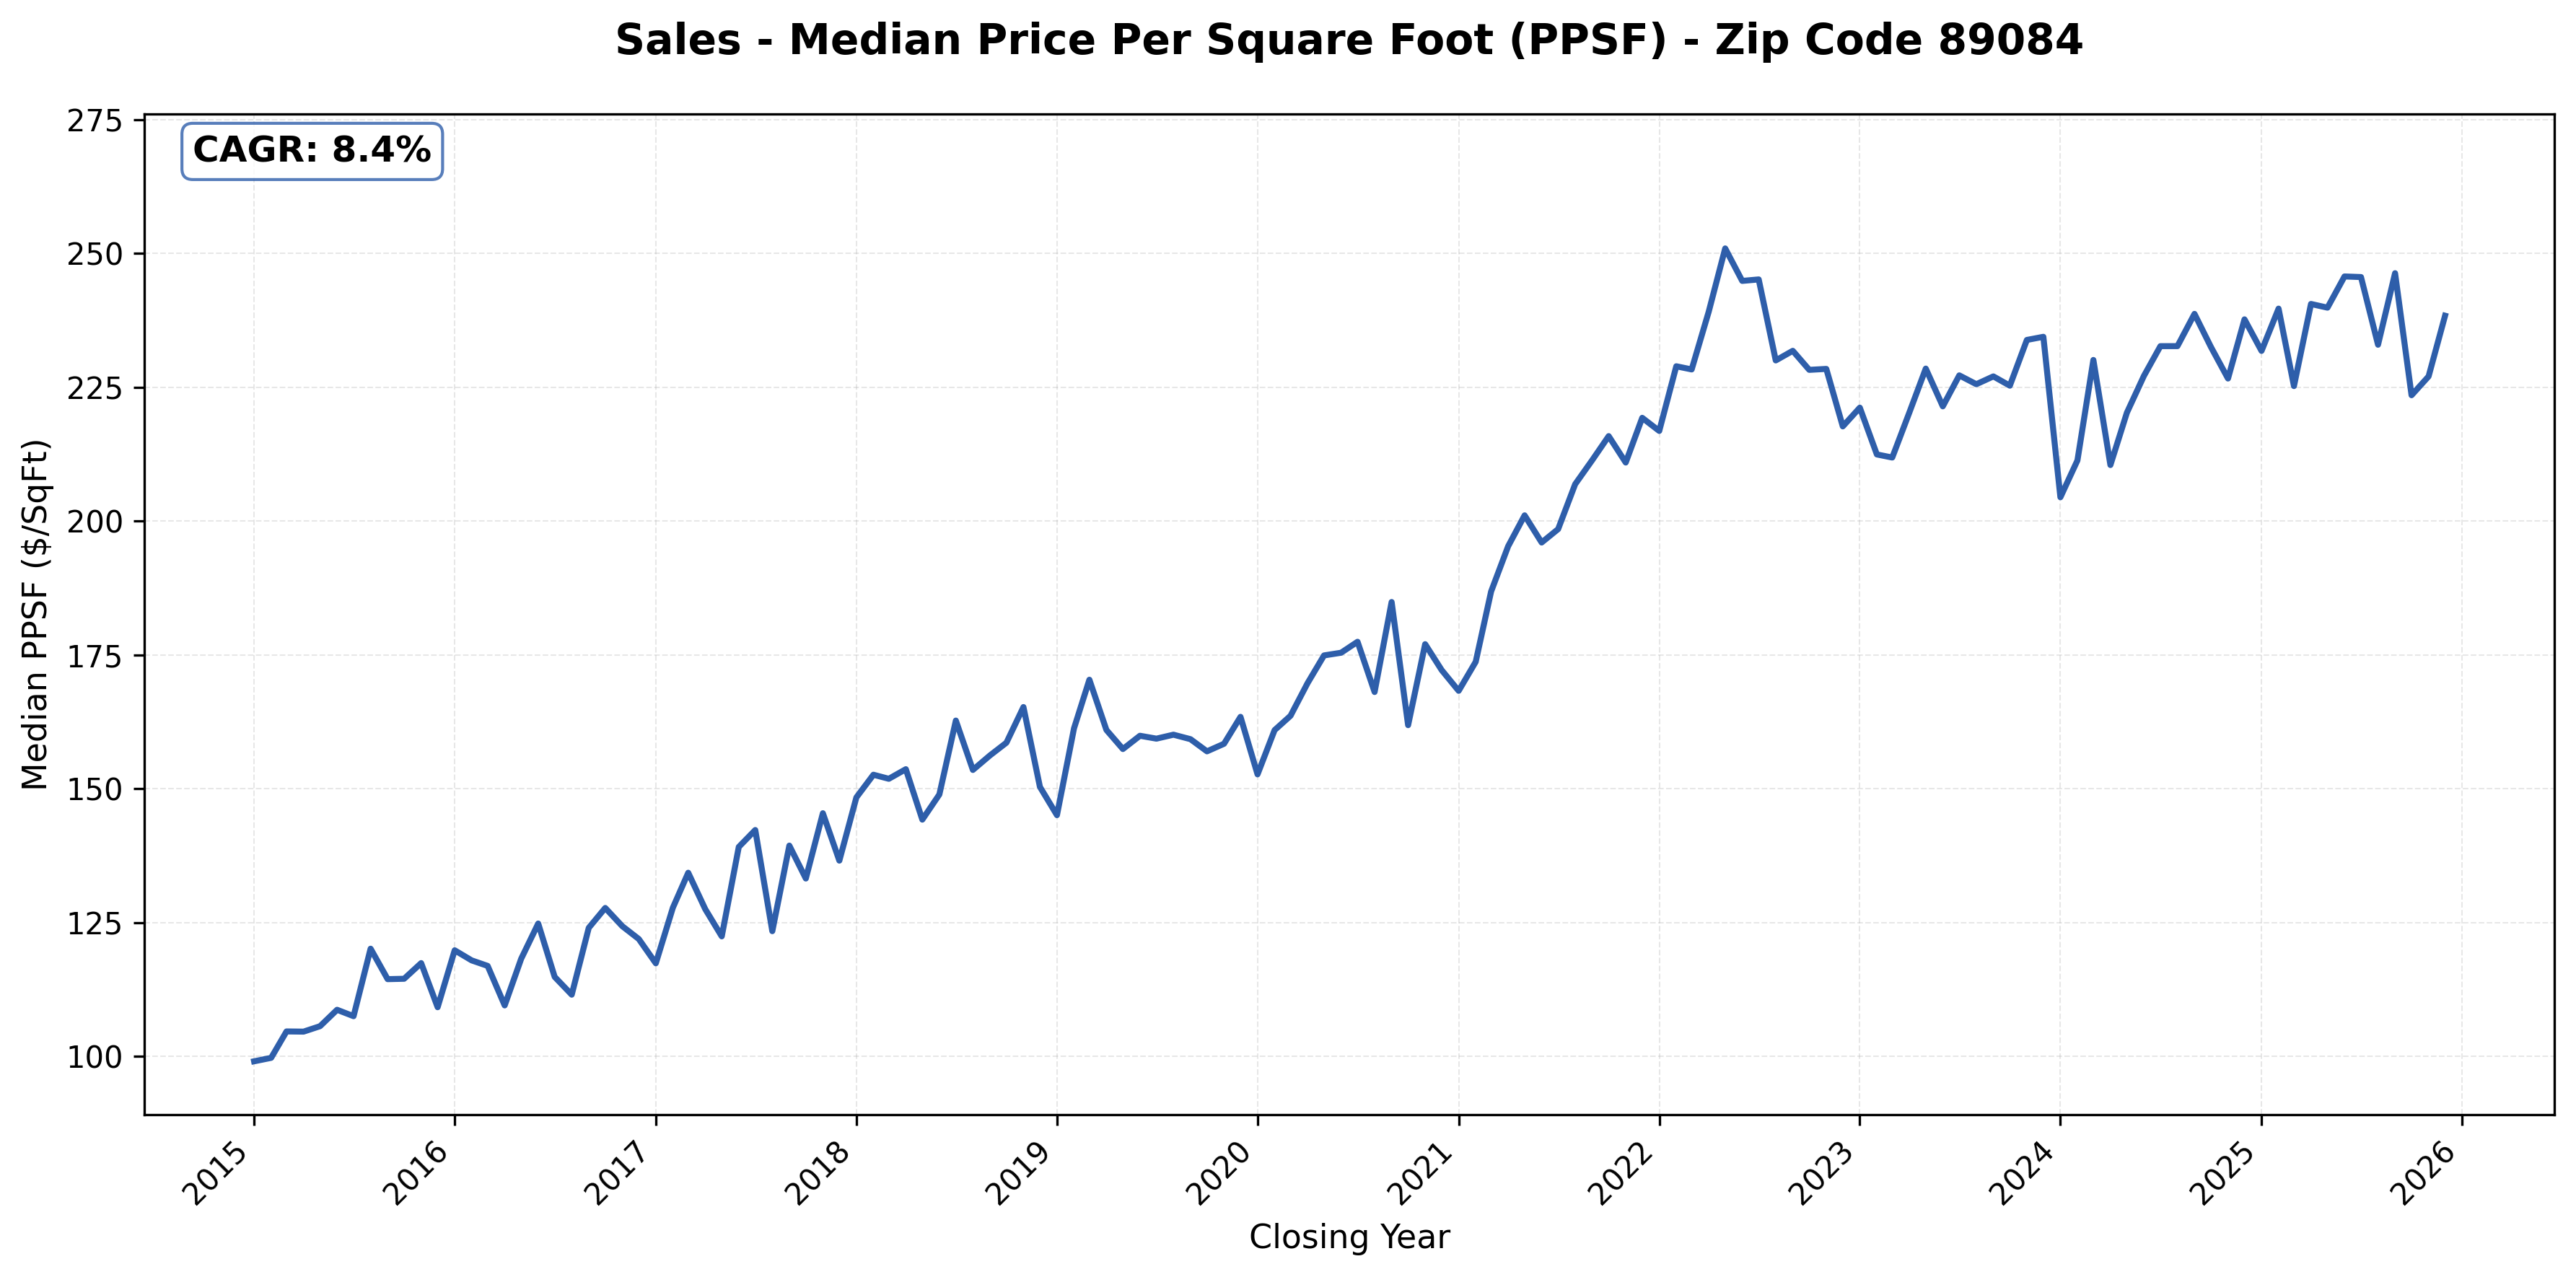
#6: 89084 (Aliante, North Las Vegas), 8.4% CAGR
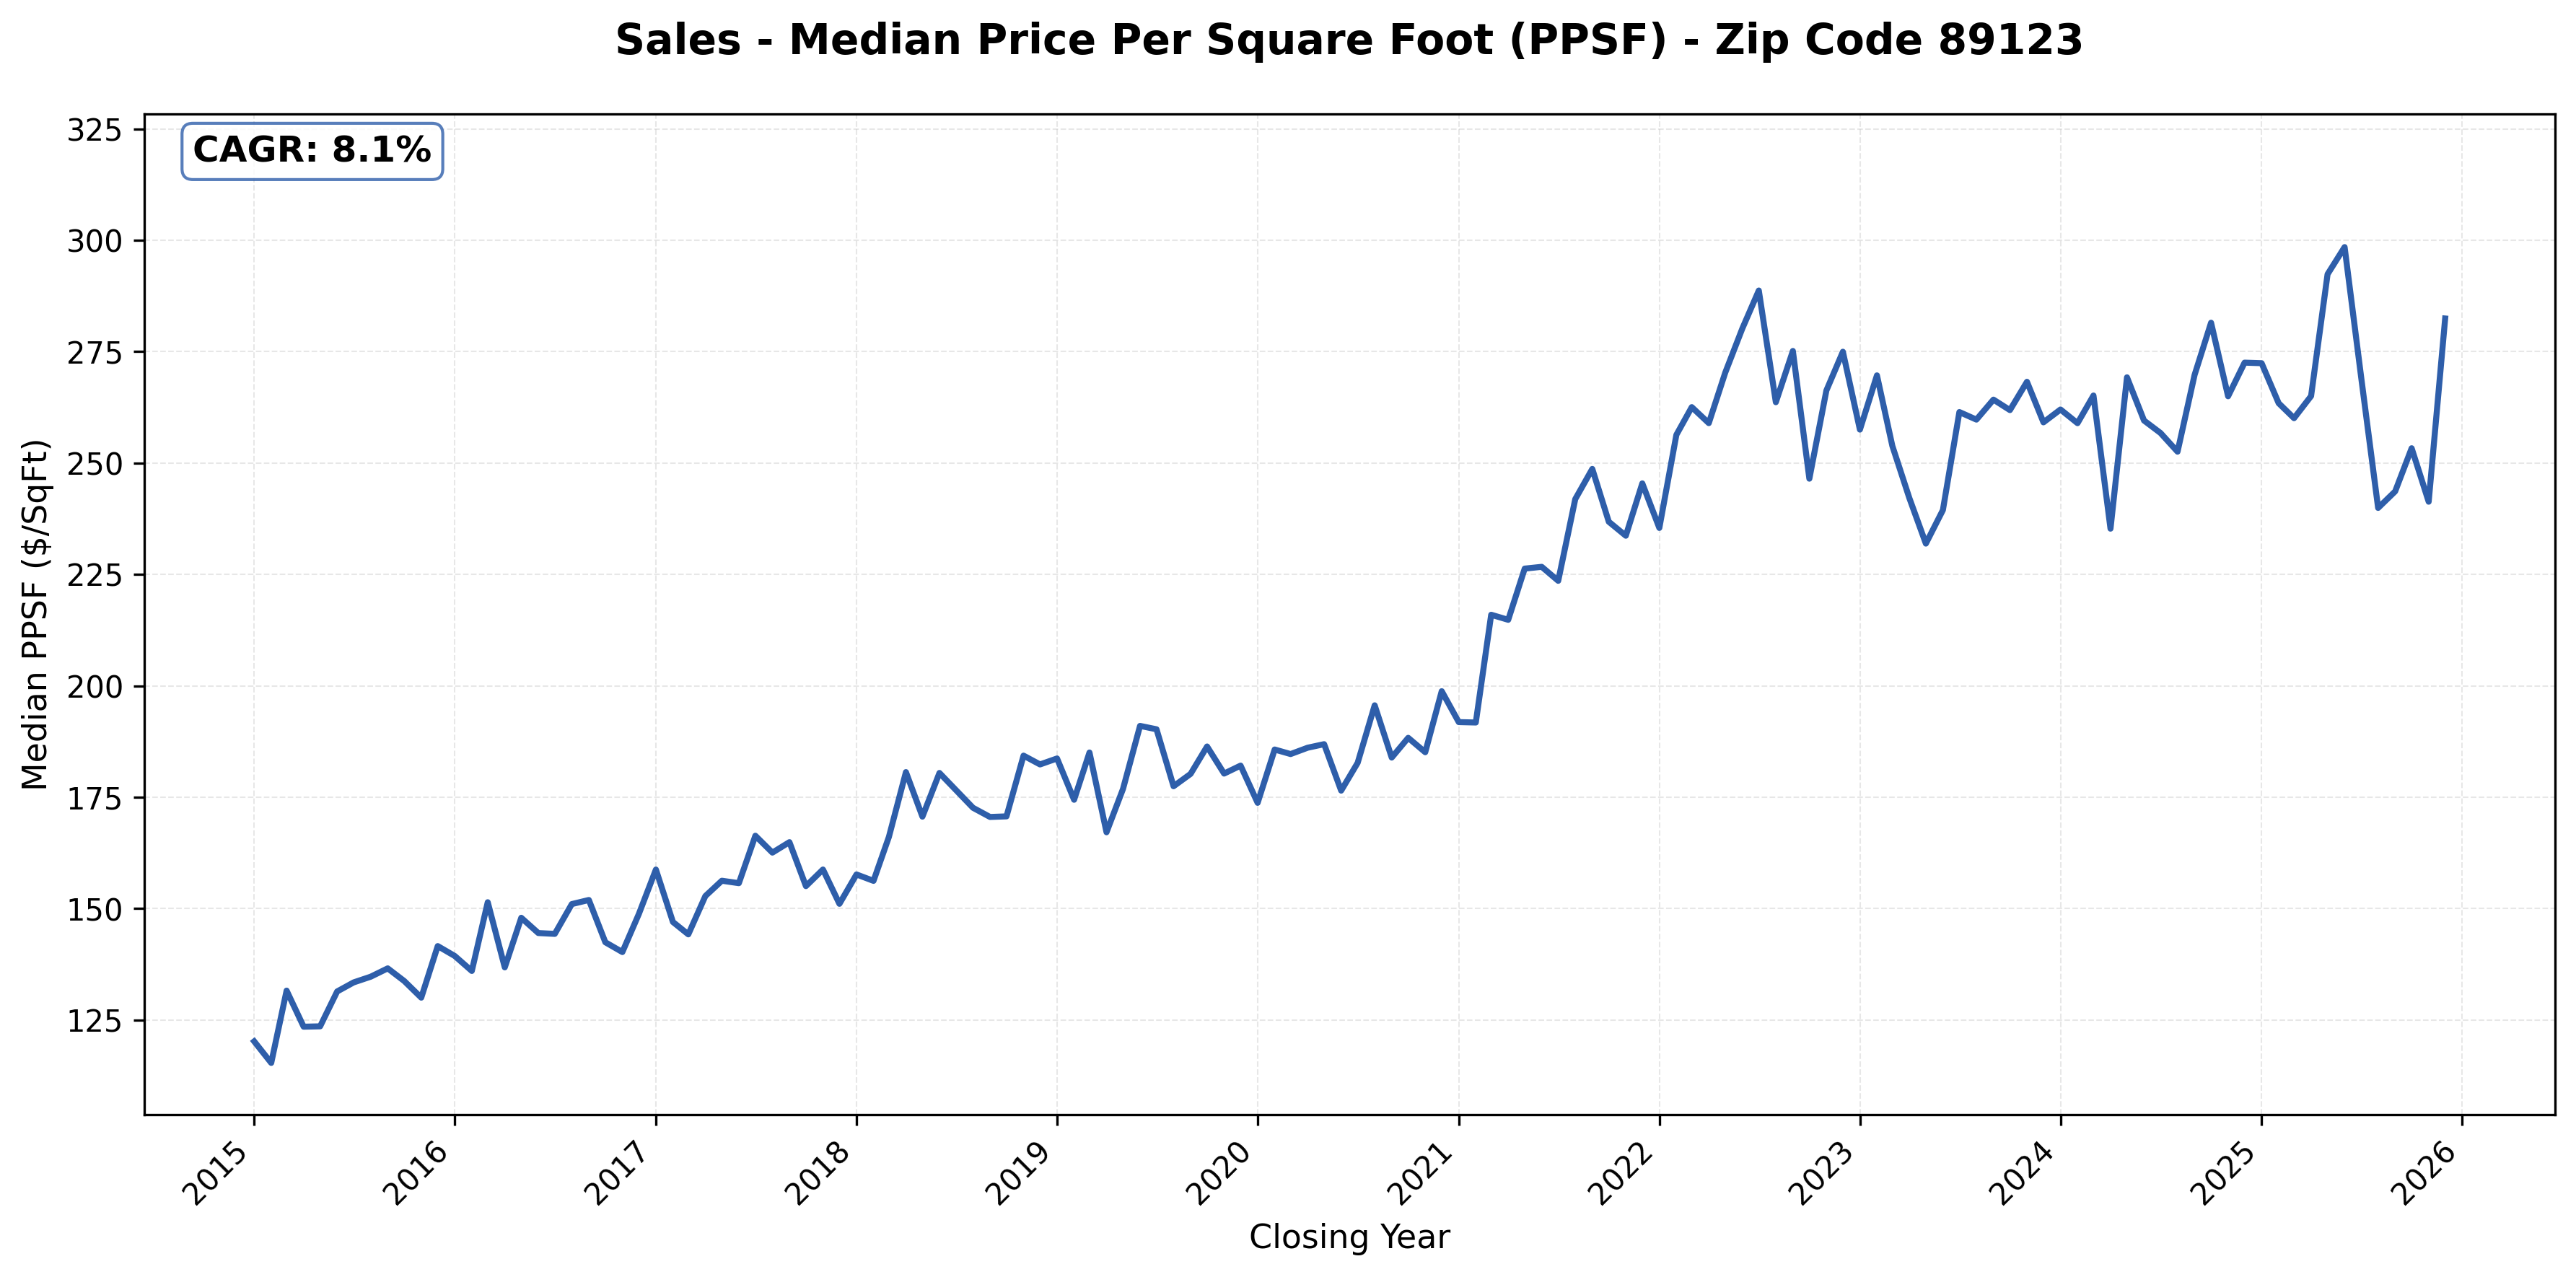
#7: 89123 (Silverado Ranch), 8.1% CAGR
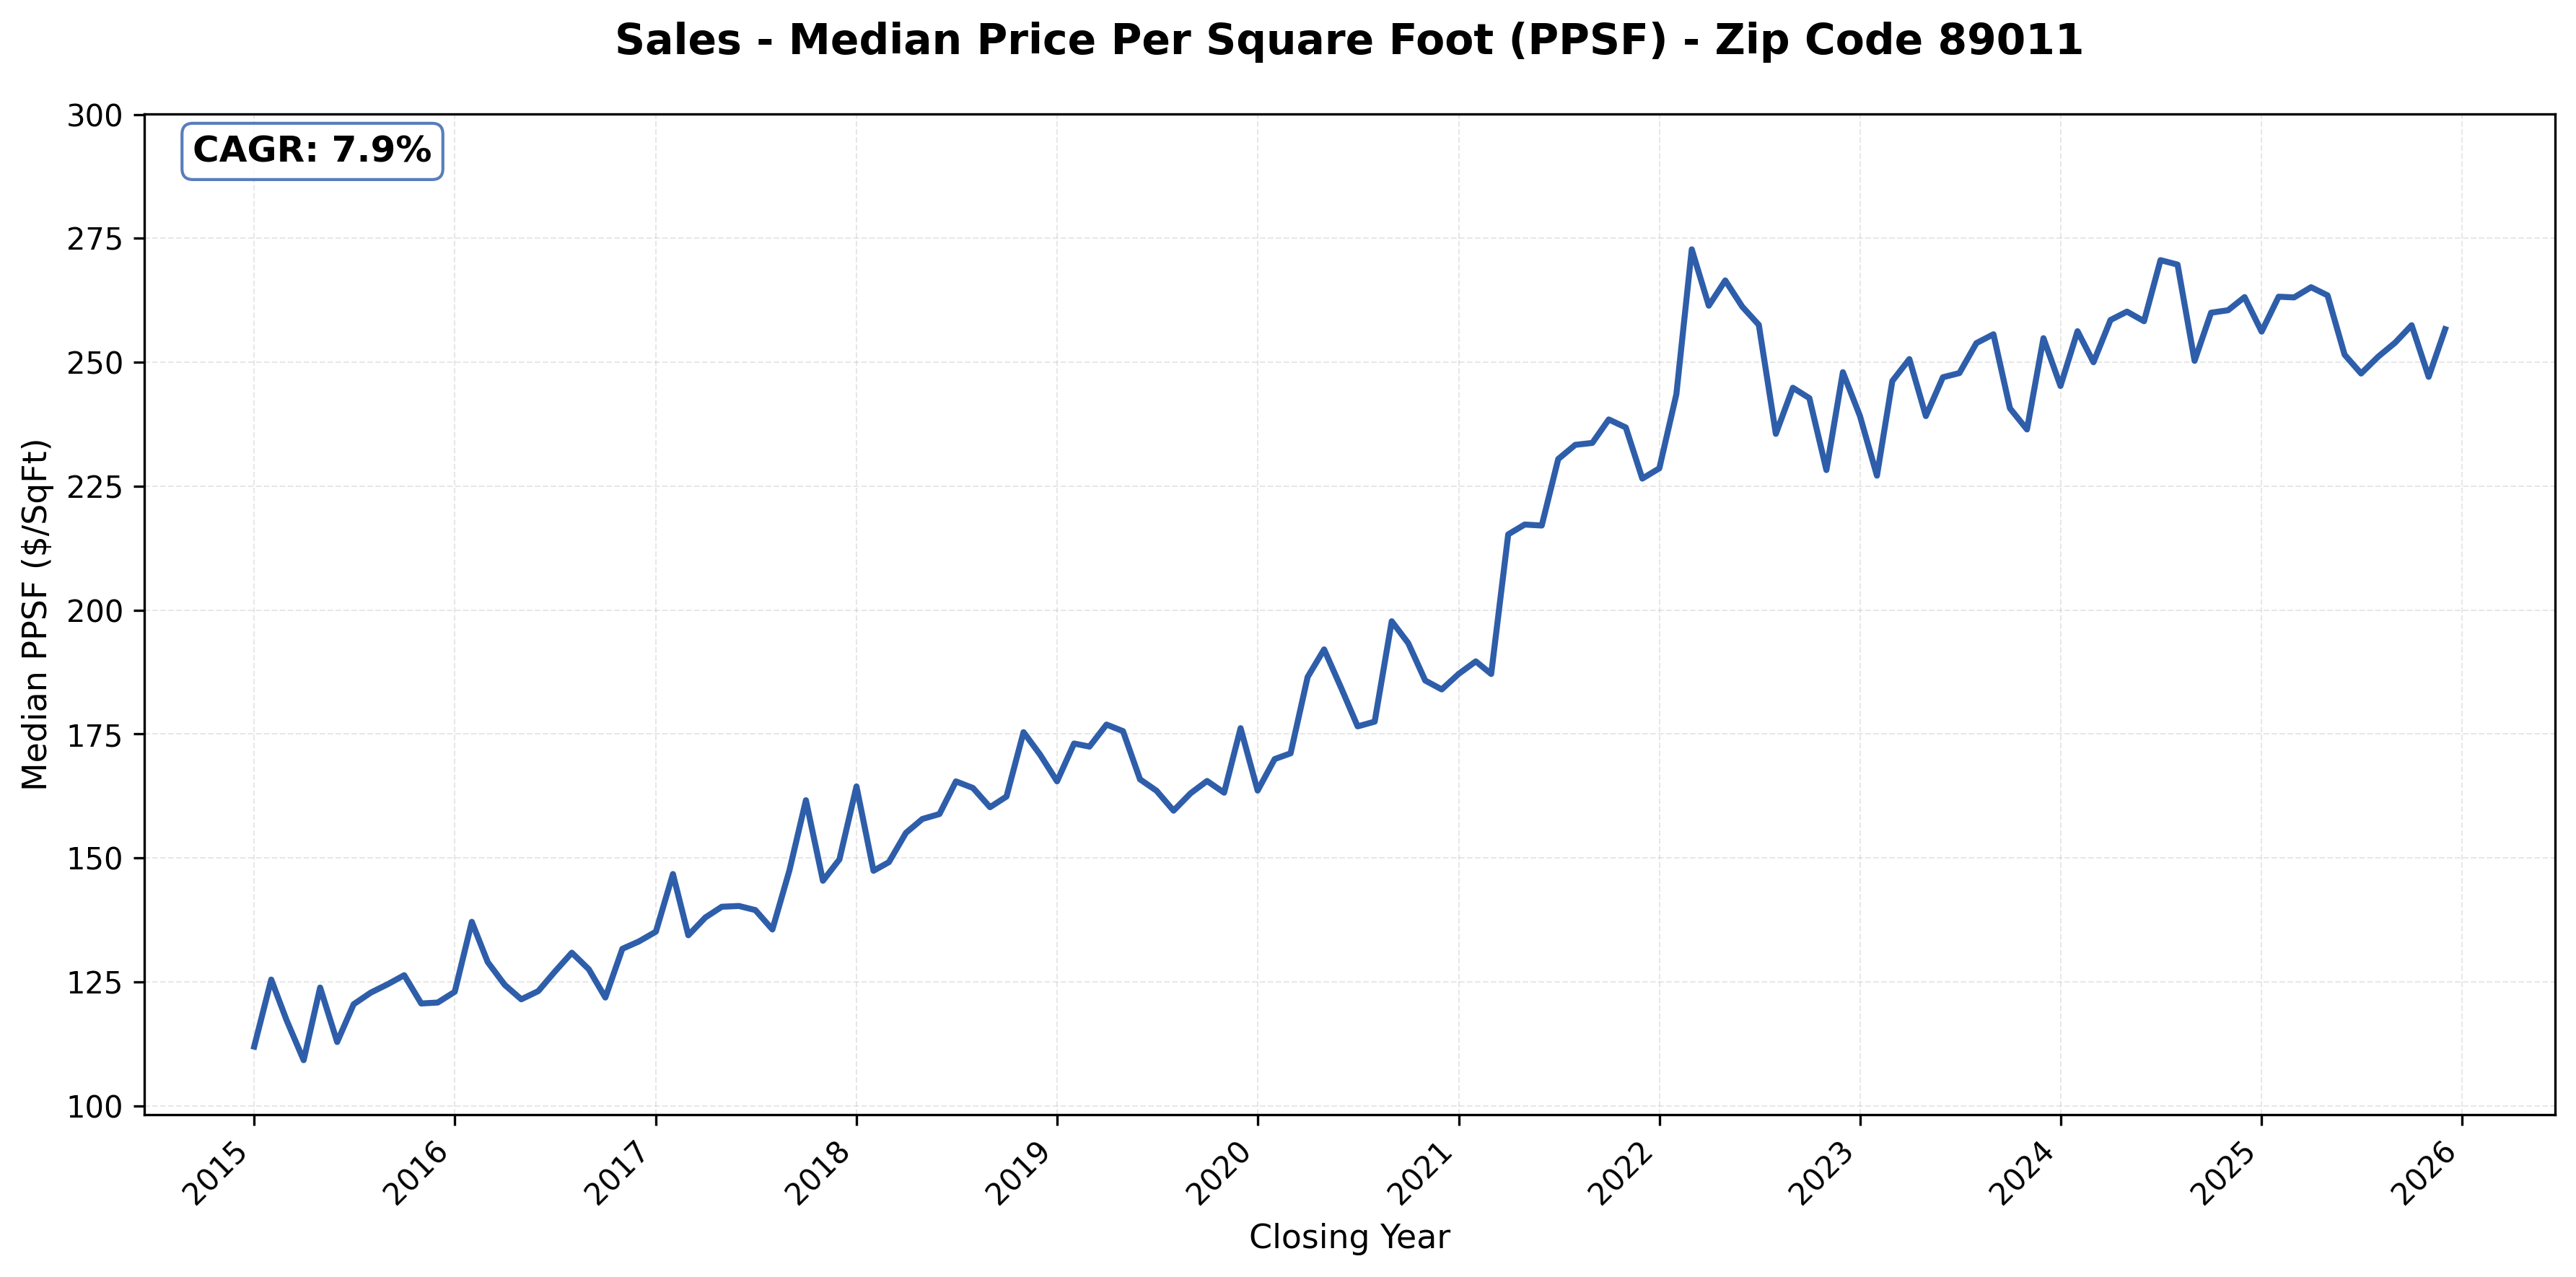
#8: 89011 (Cadence, Henderson), 7.9% CAGR
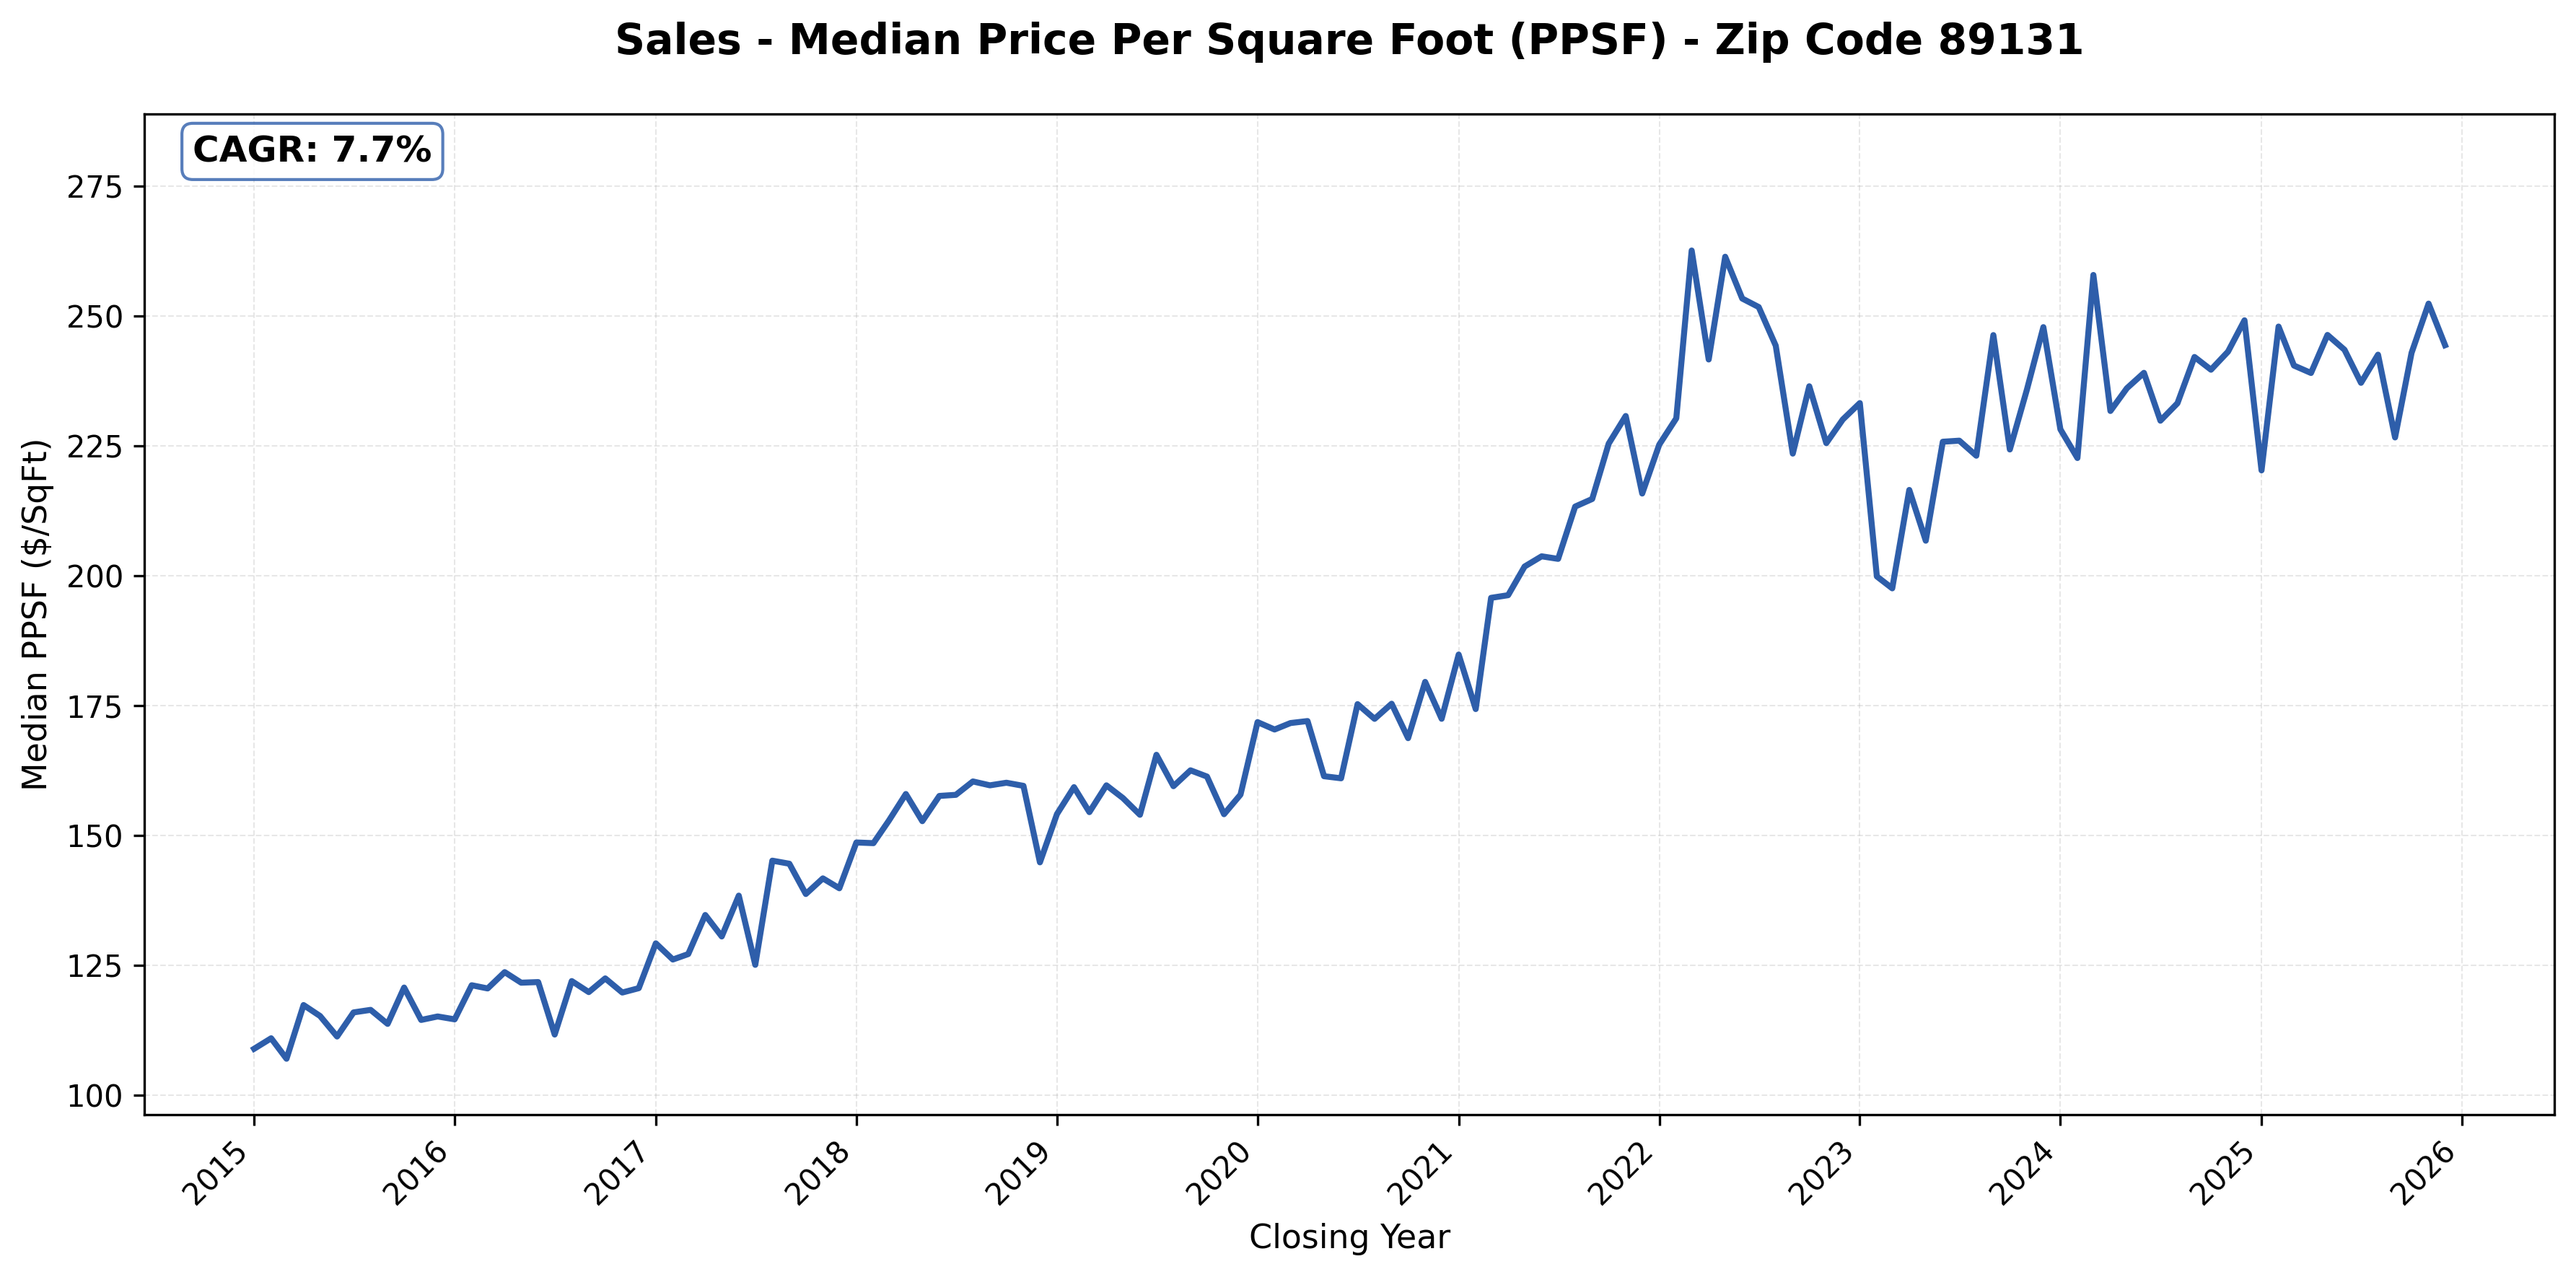
#9: 89131 (Centennial Hills, 7.7% CAGR
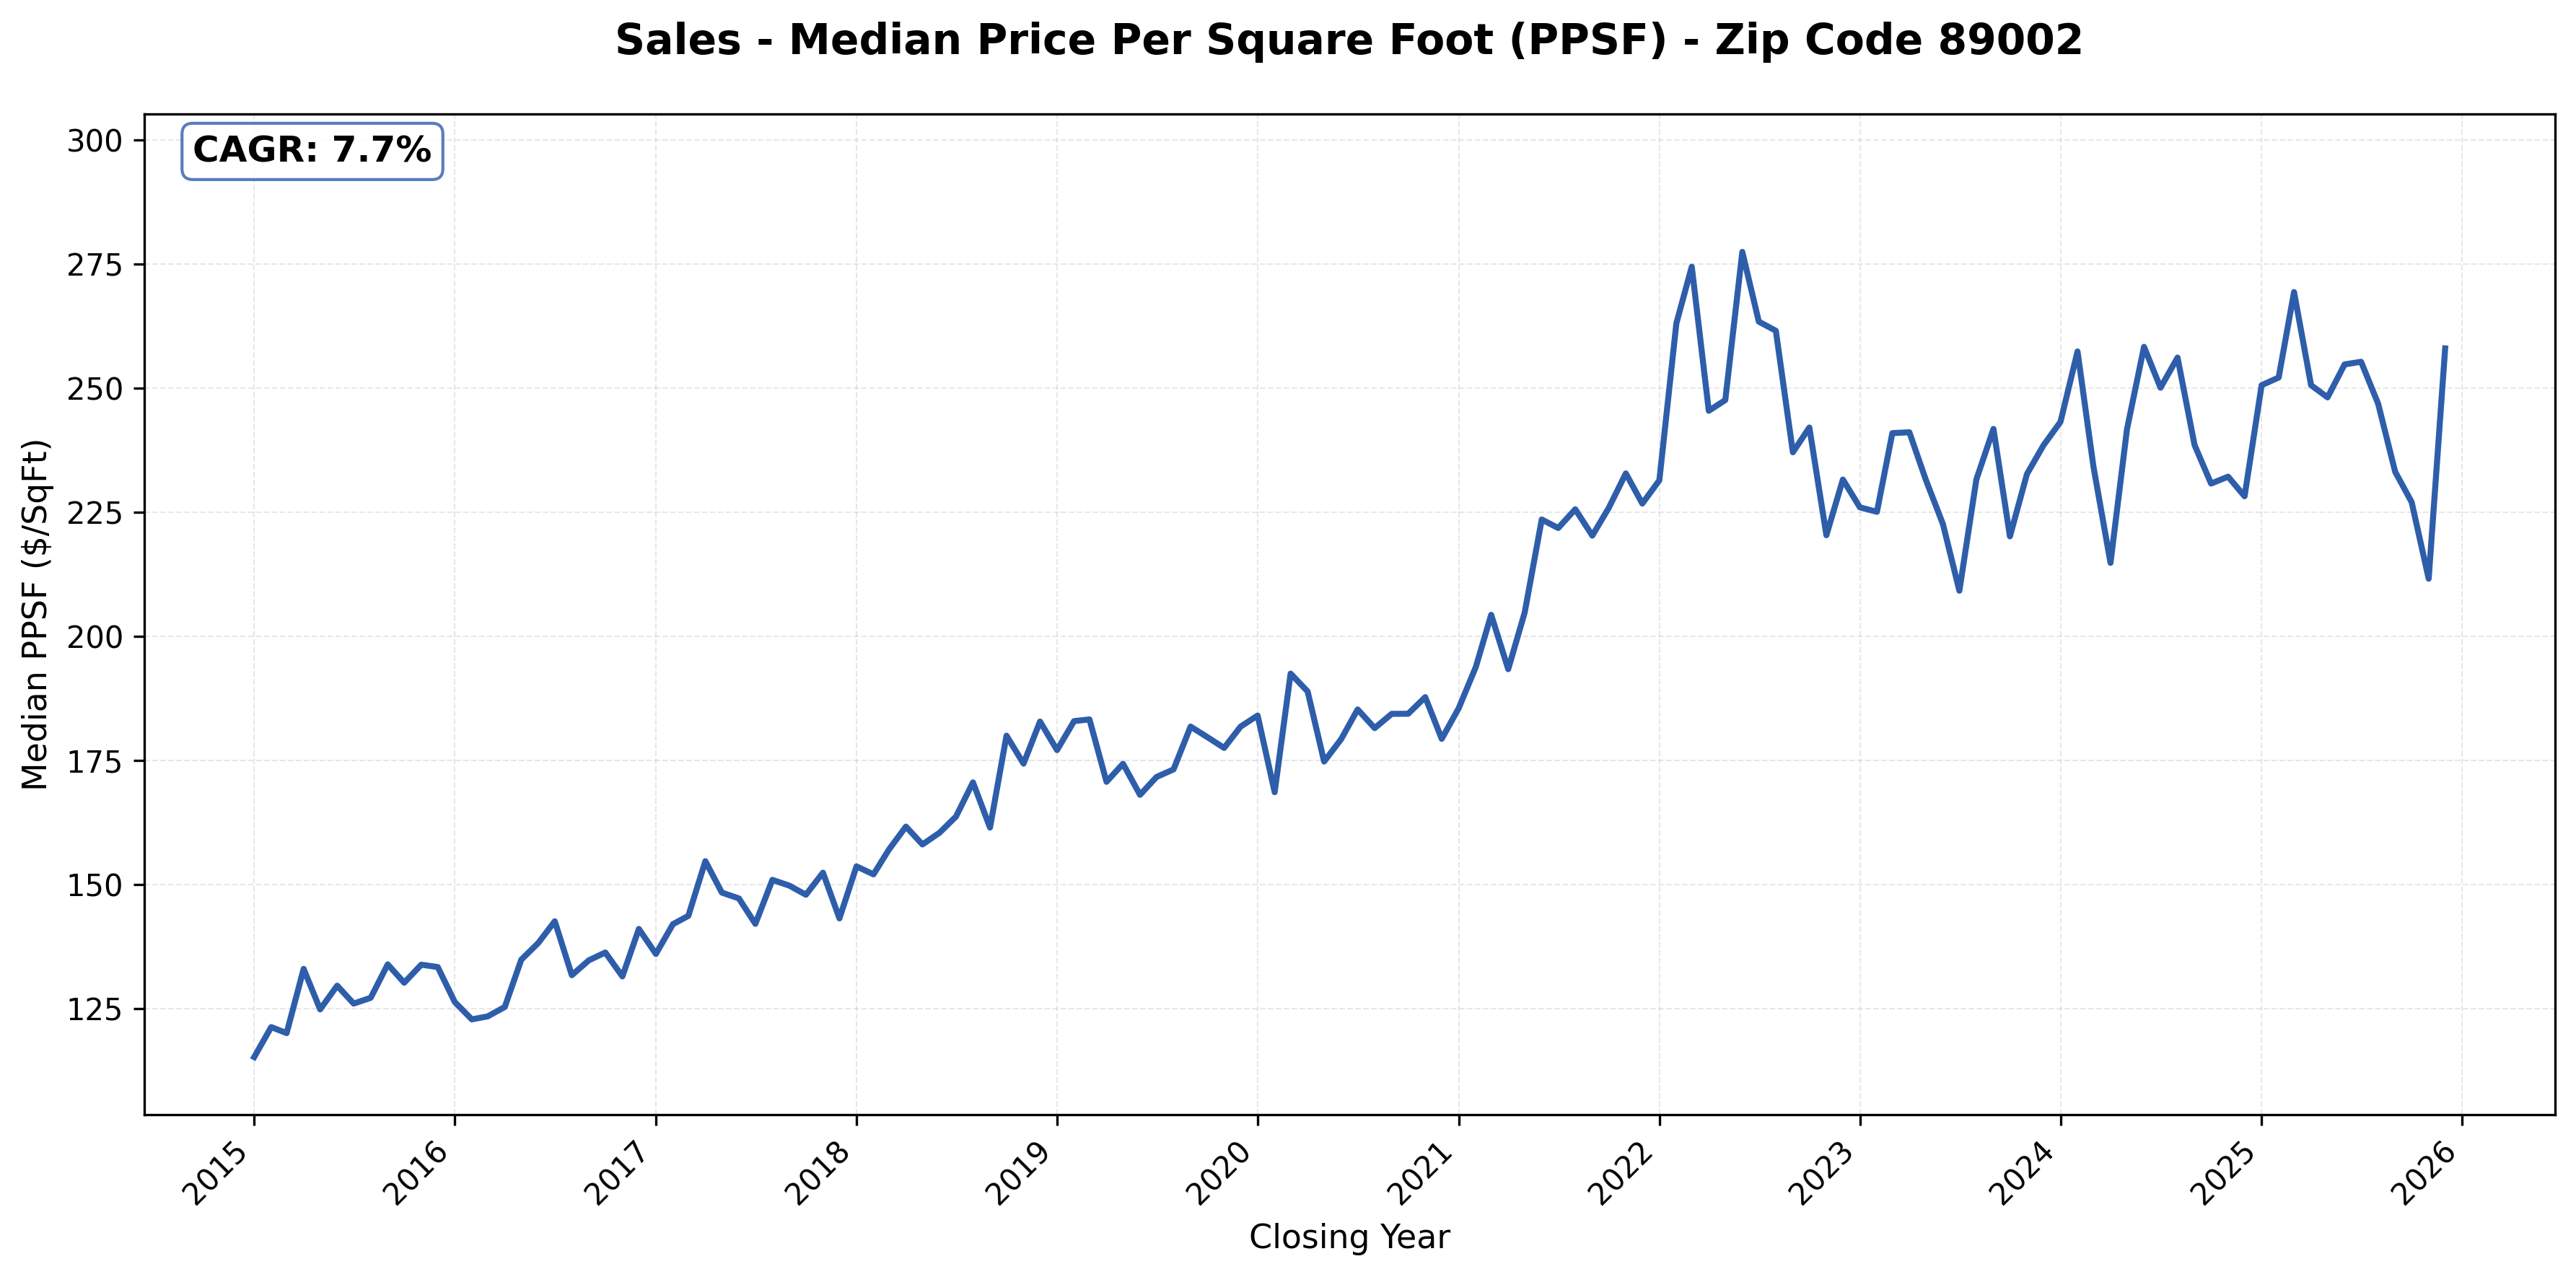
#10: 89002 (Black Mountain, Henderson), 7.7% CAGR
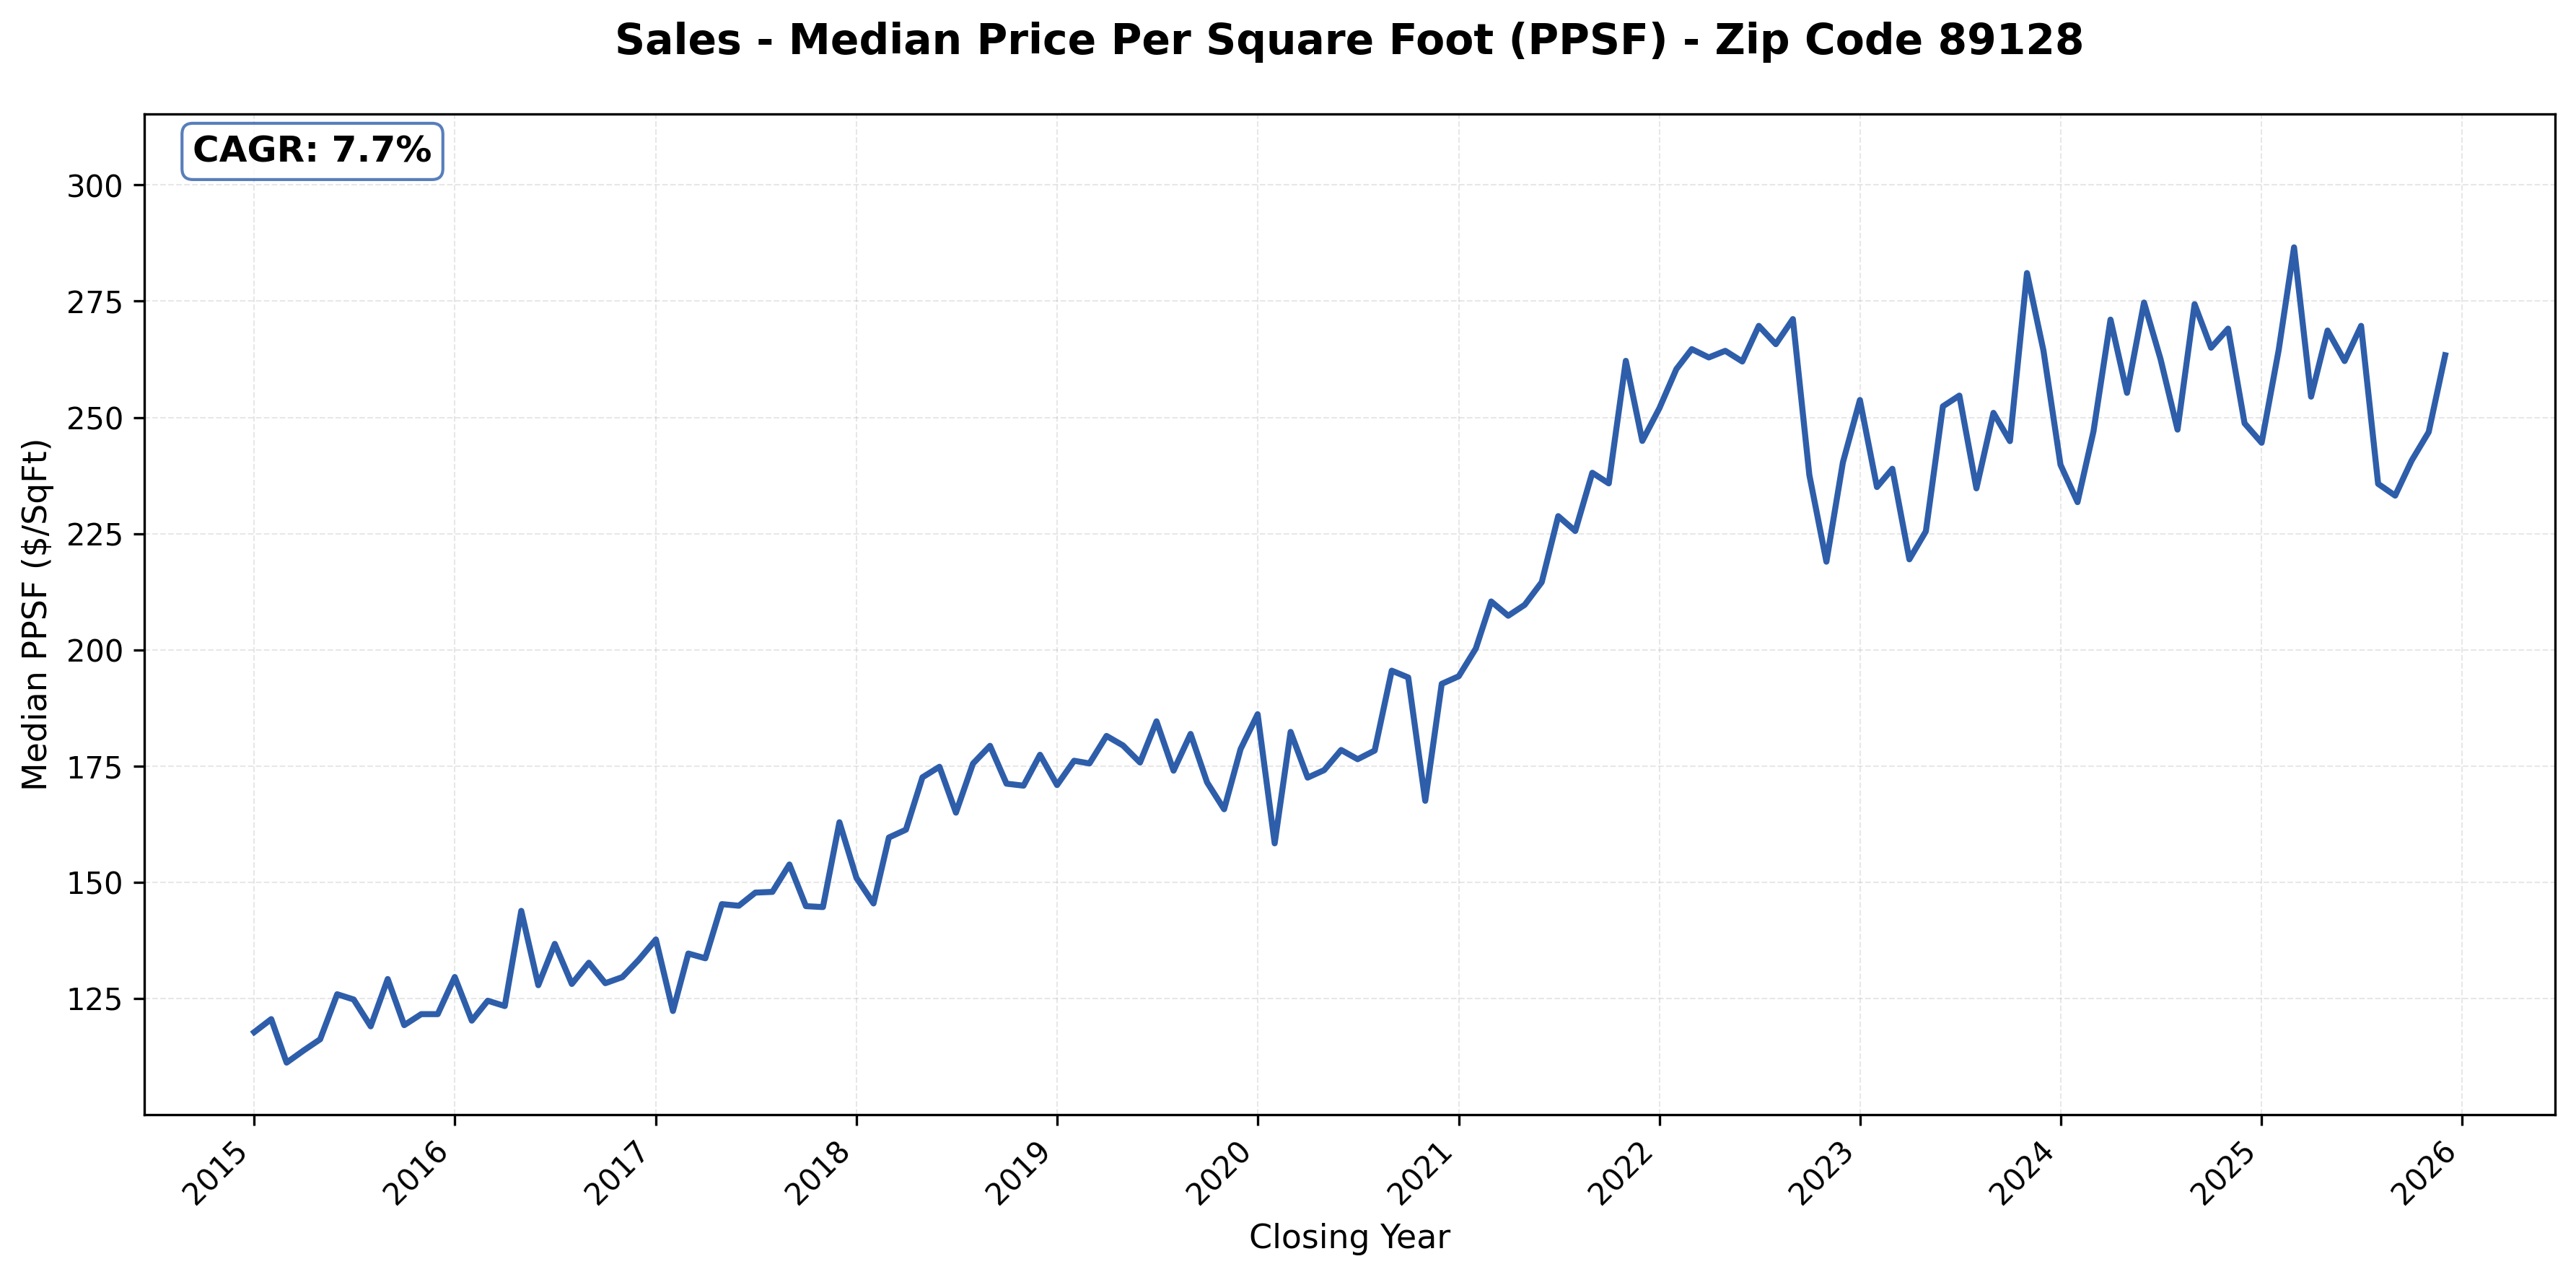
#11: 89128 (Northwest, Desert Shores), 7.7% CAGR
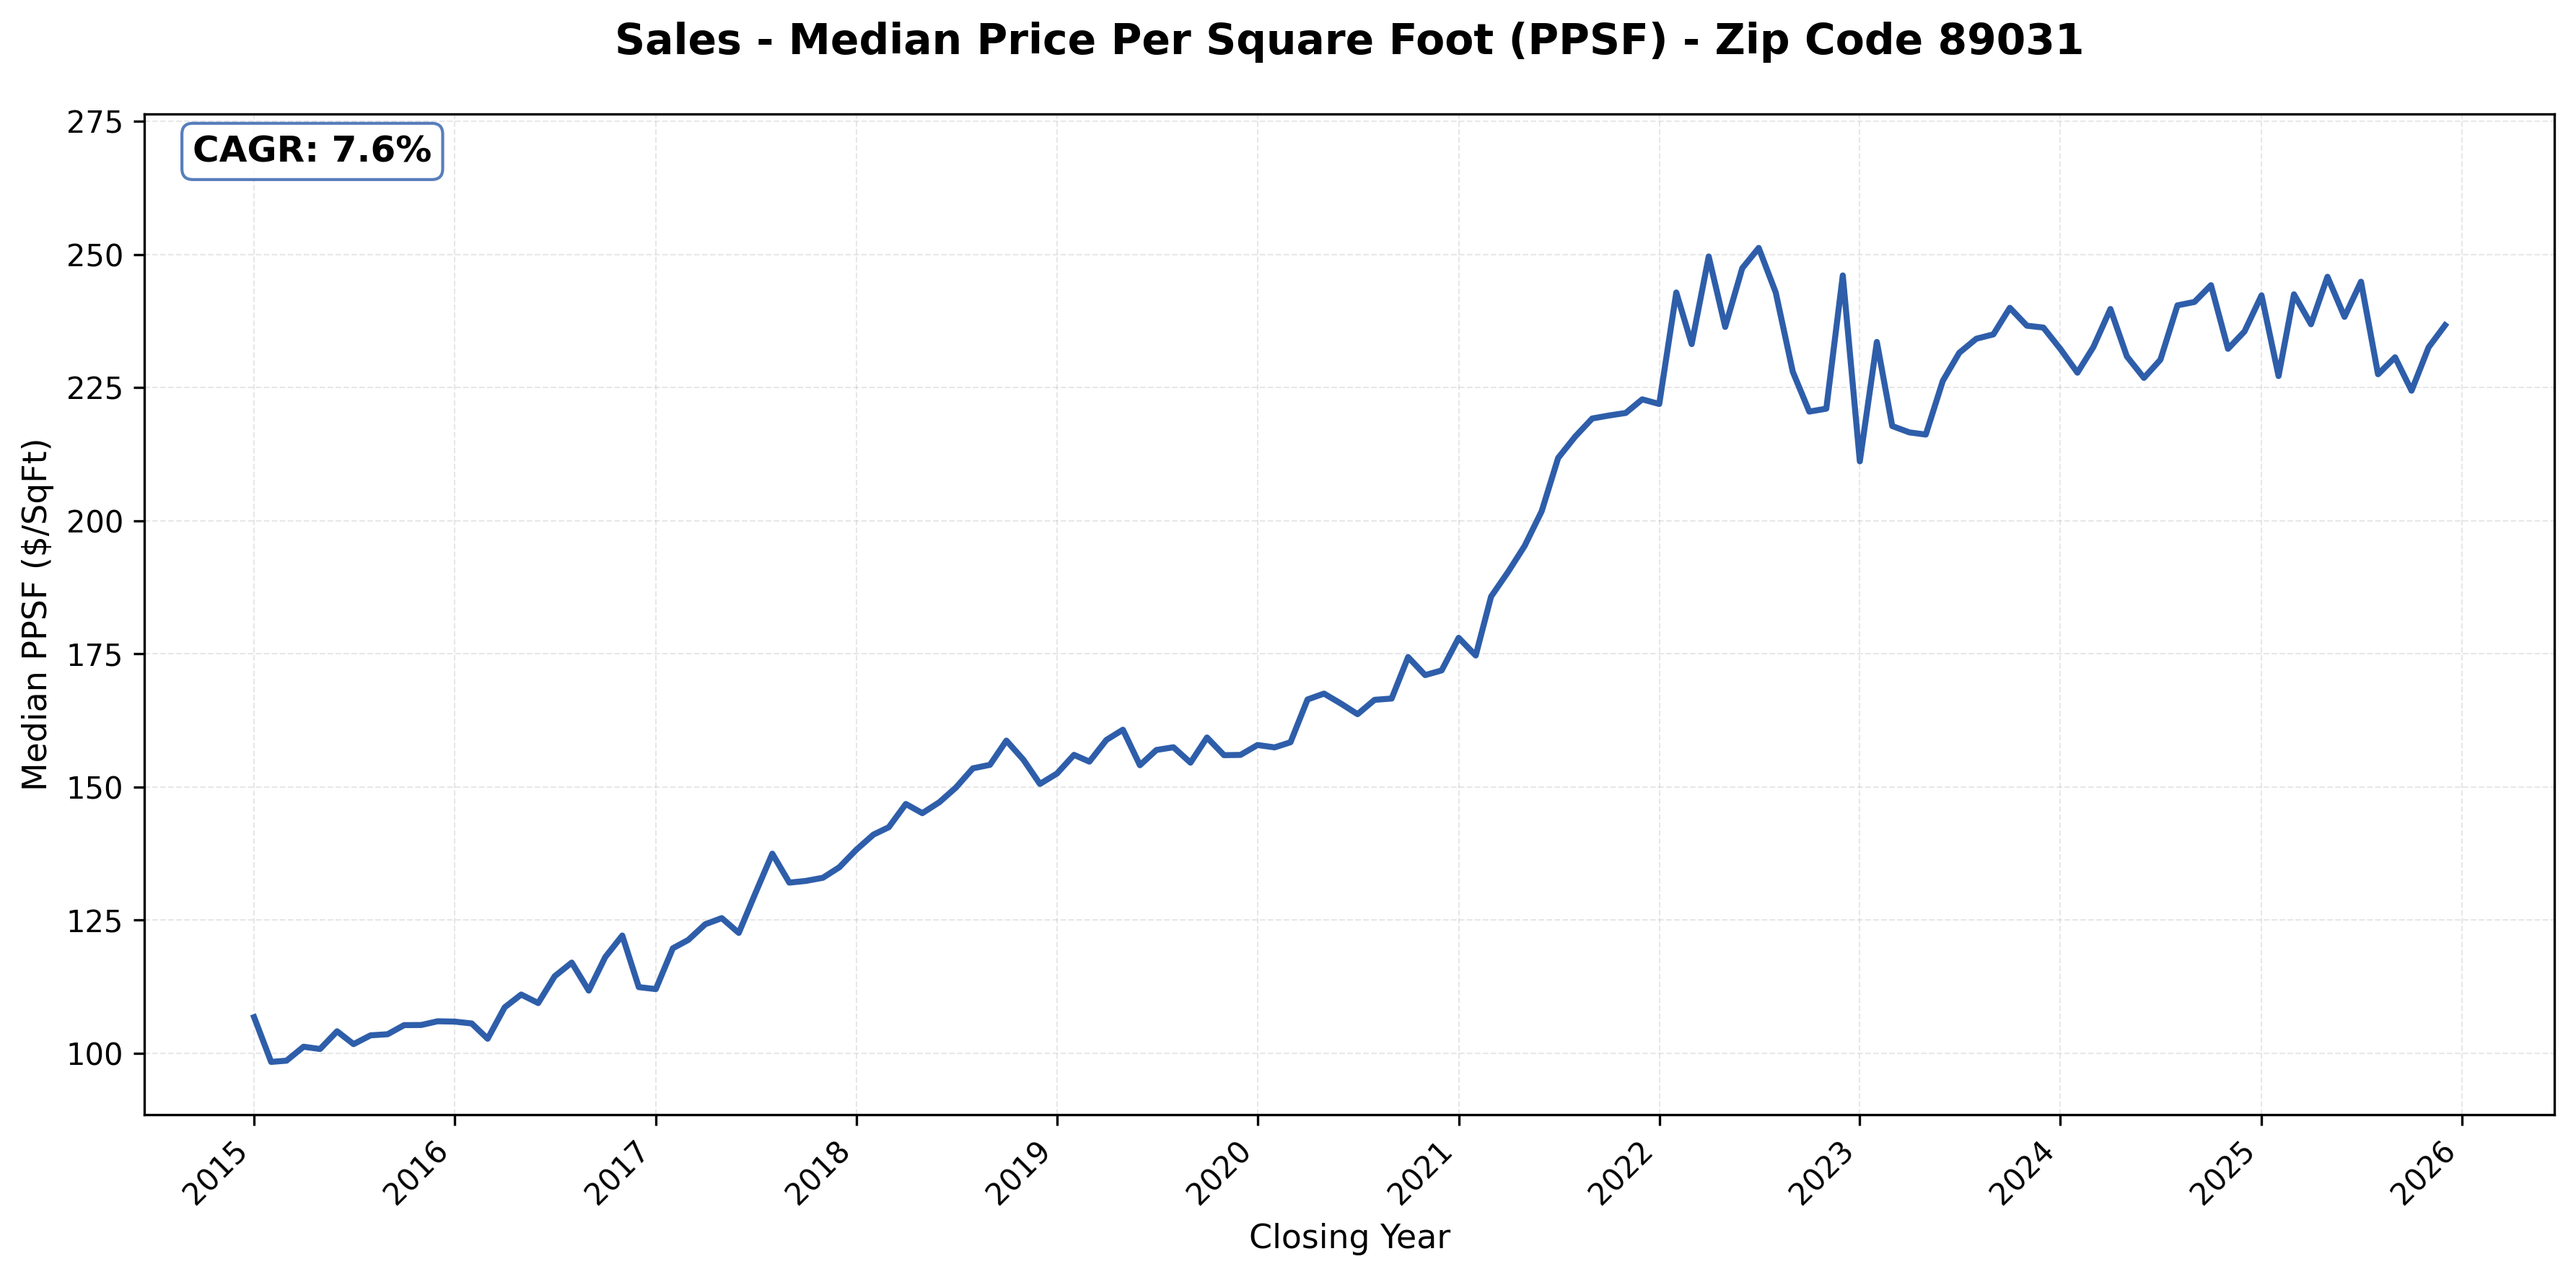
#12: 89031 (Eldorado, North Las Vegas), 7.6% CAGR
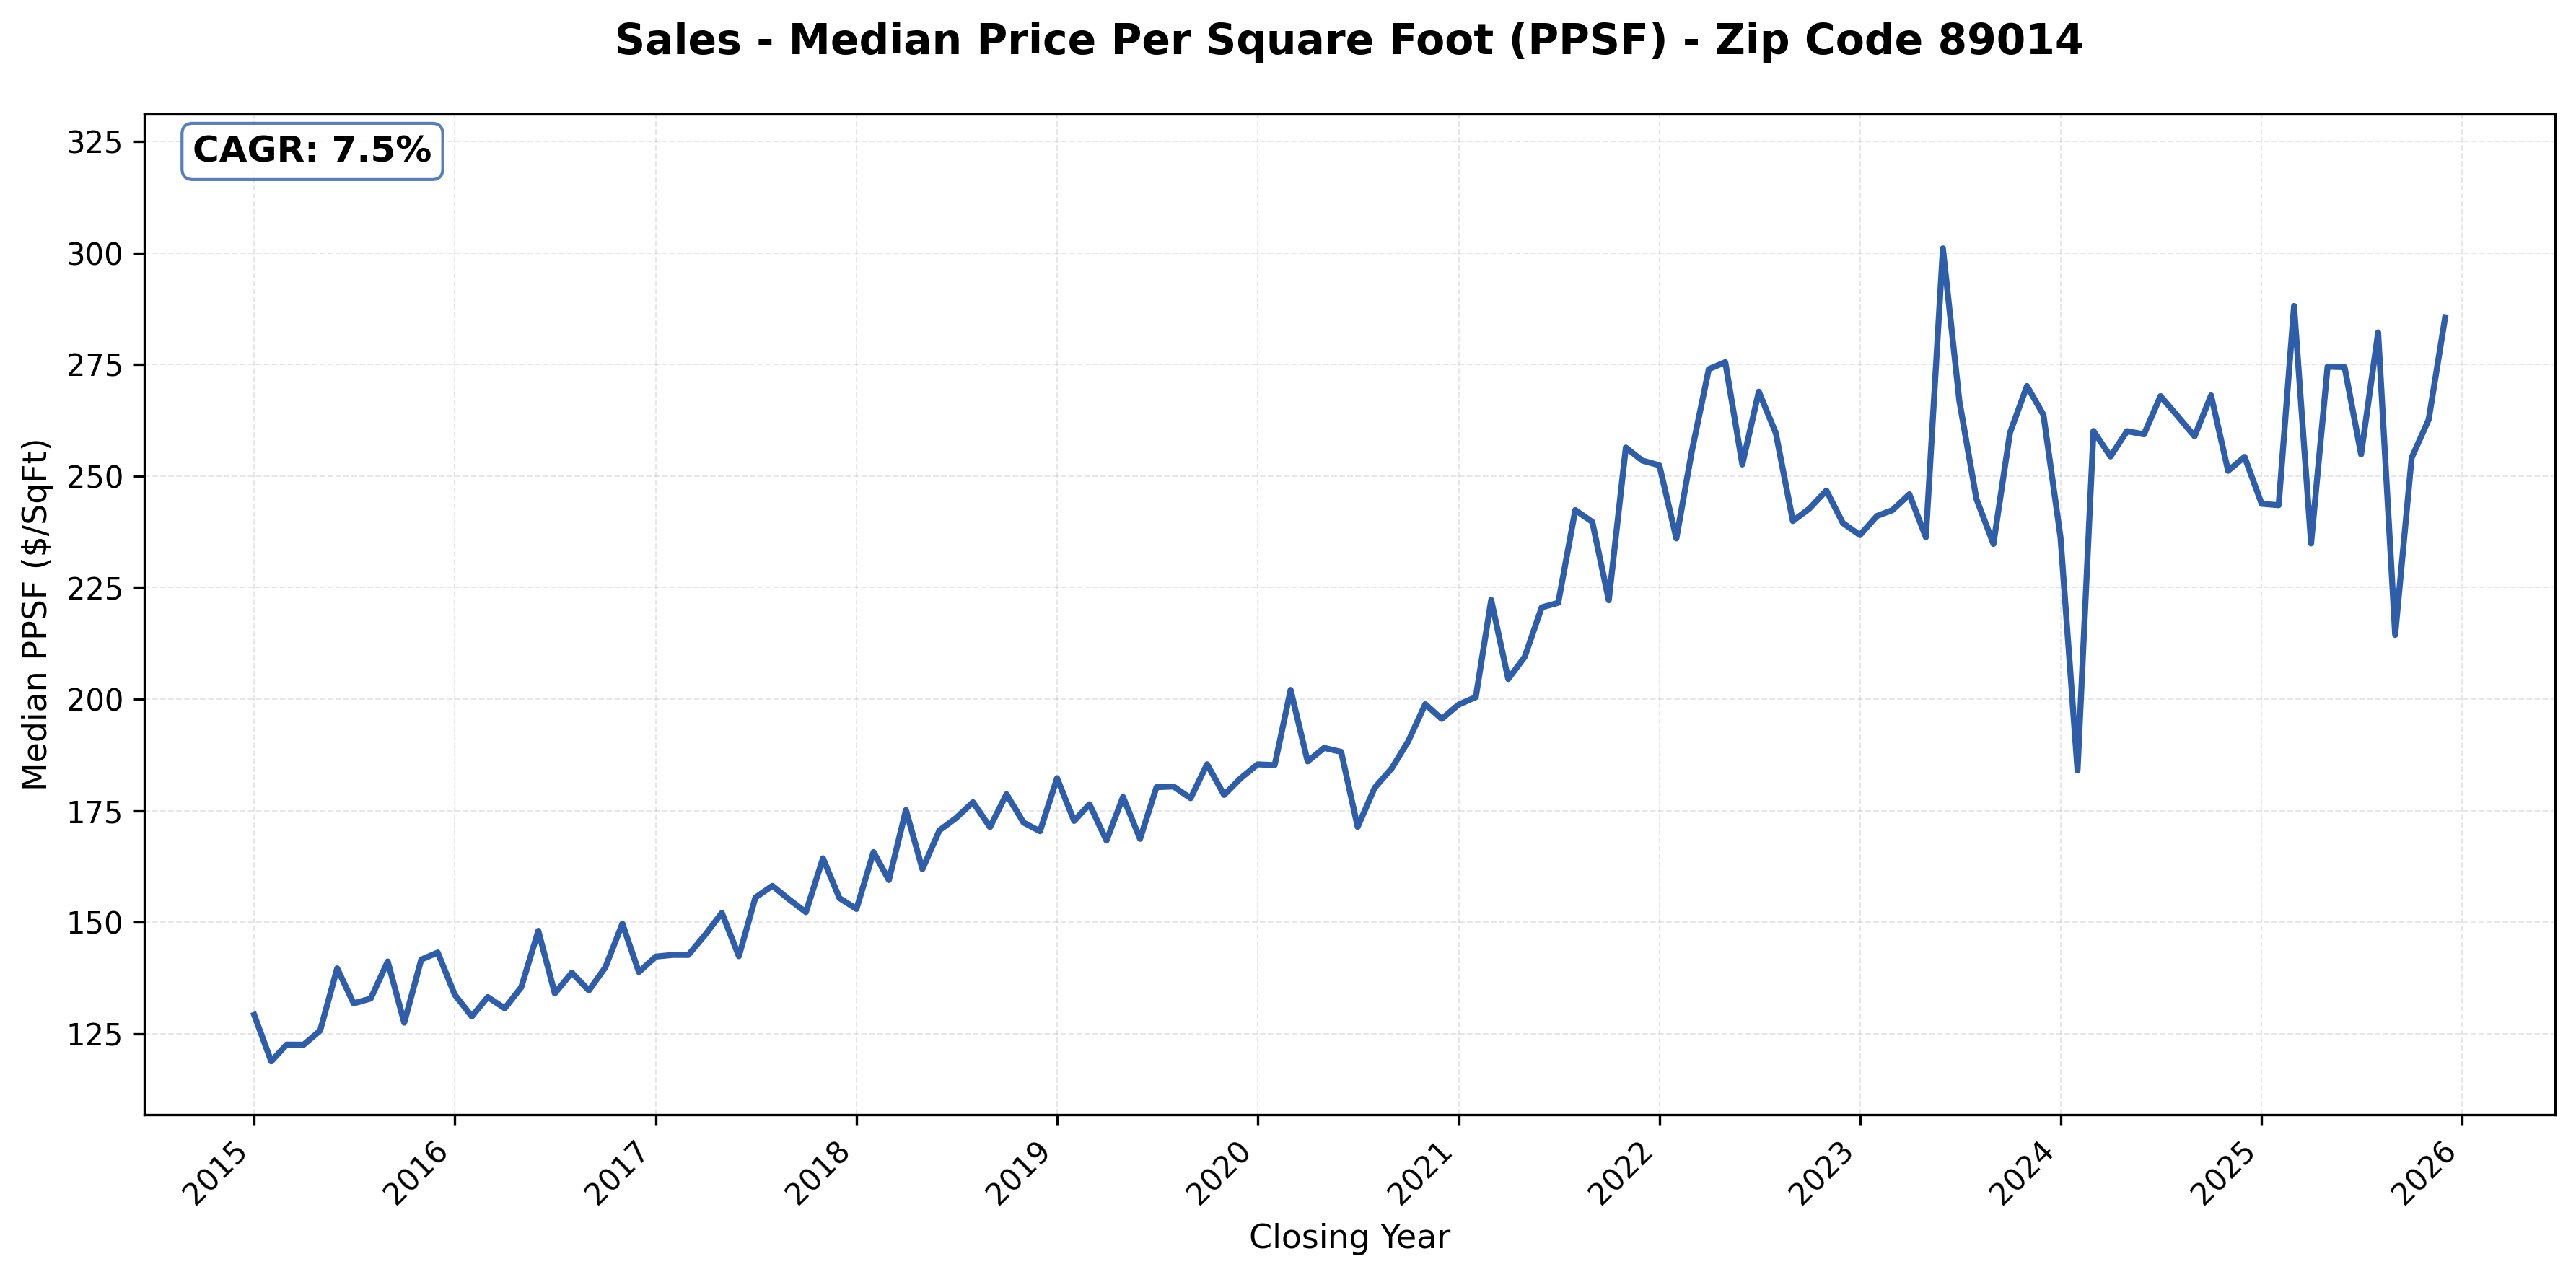
#13: 89014 (Green Valley North, Whitney Ranch, Henderson), 7.5% CAGR
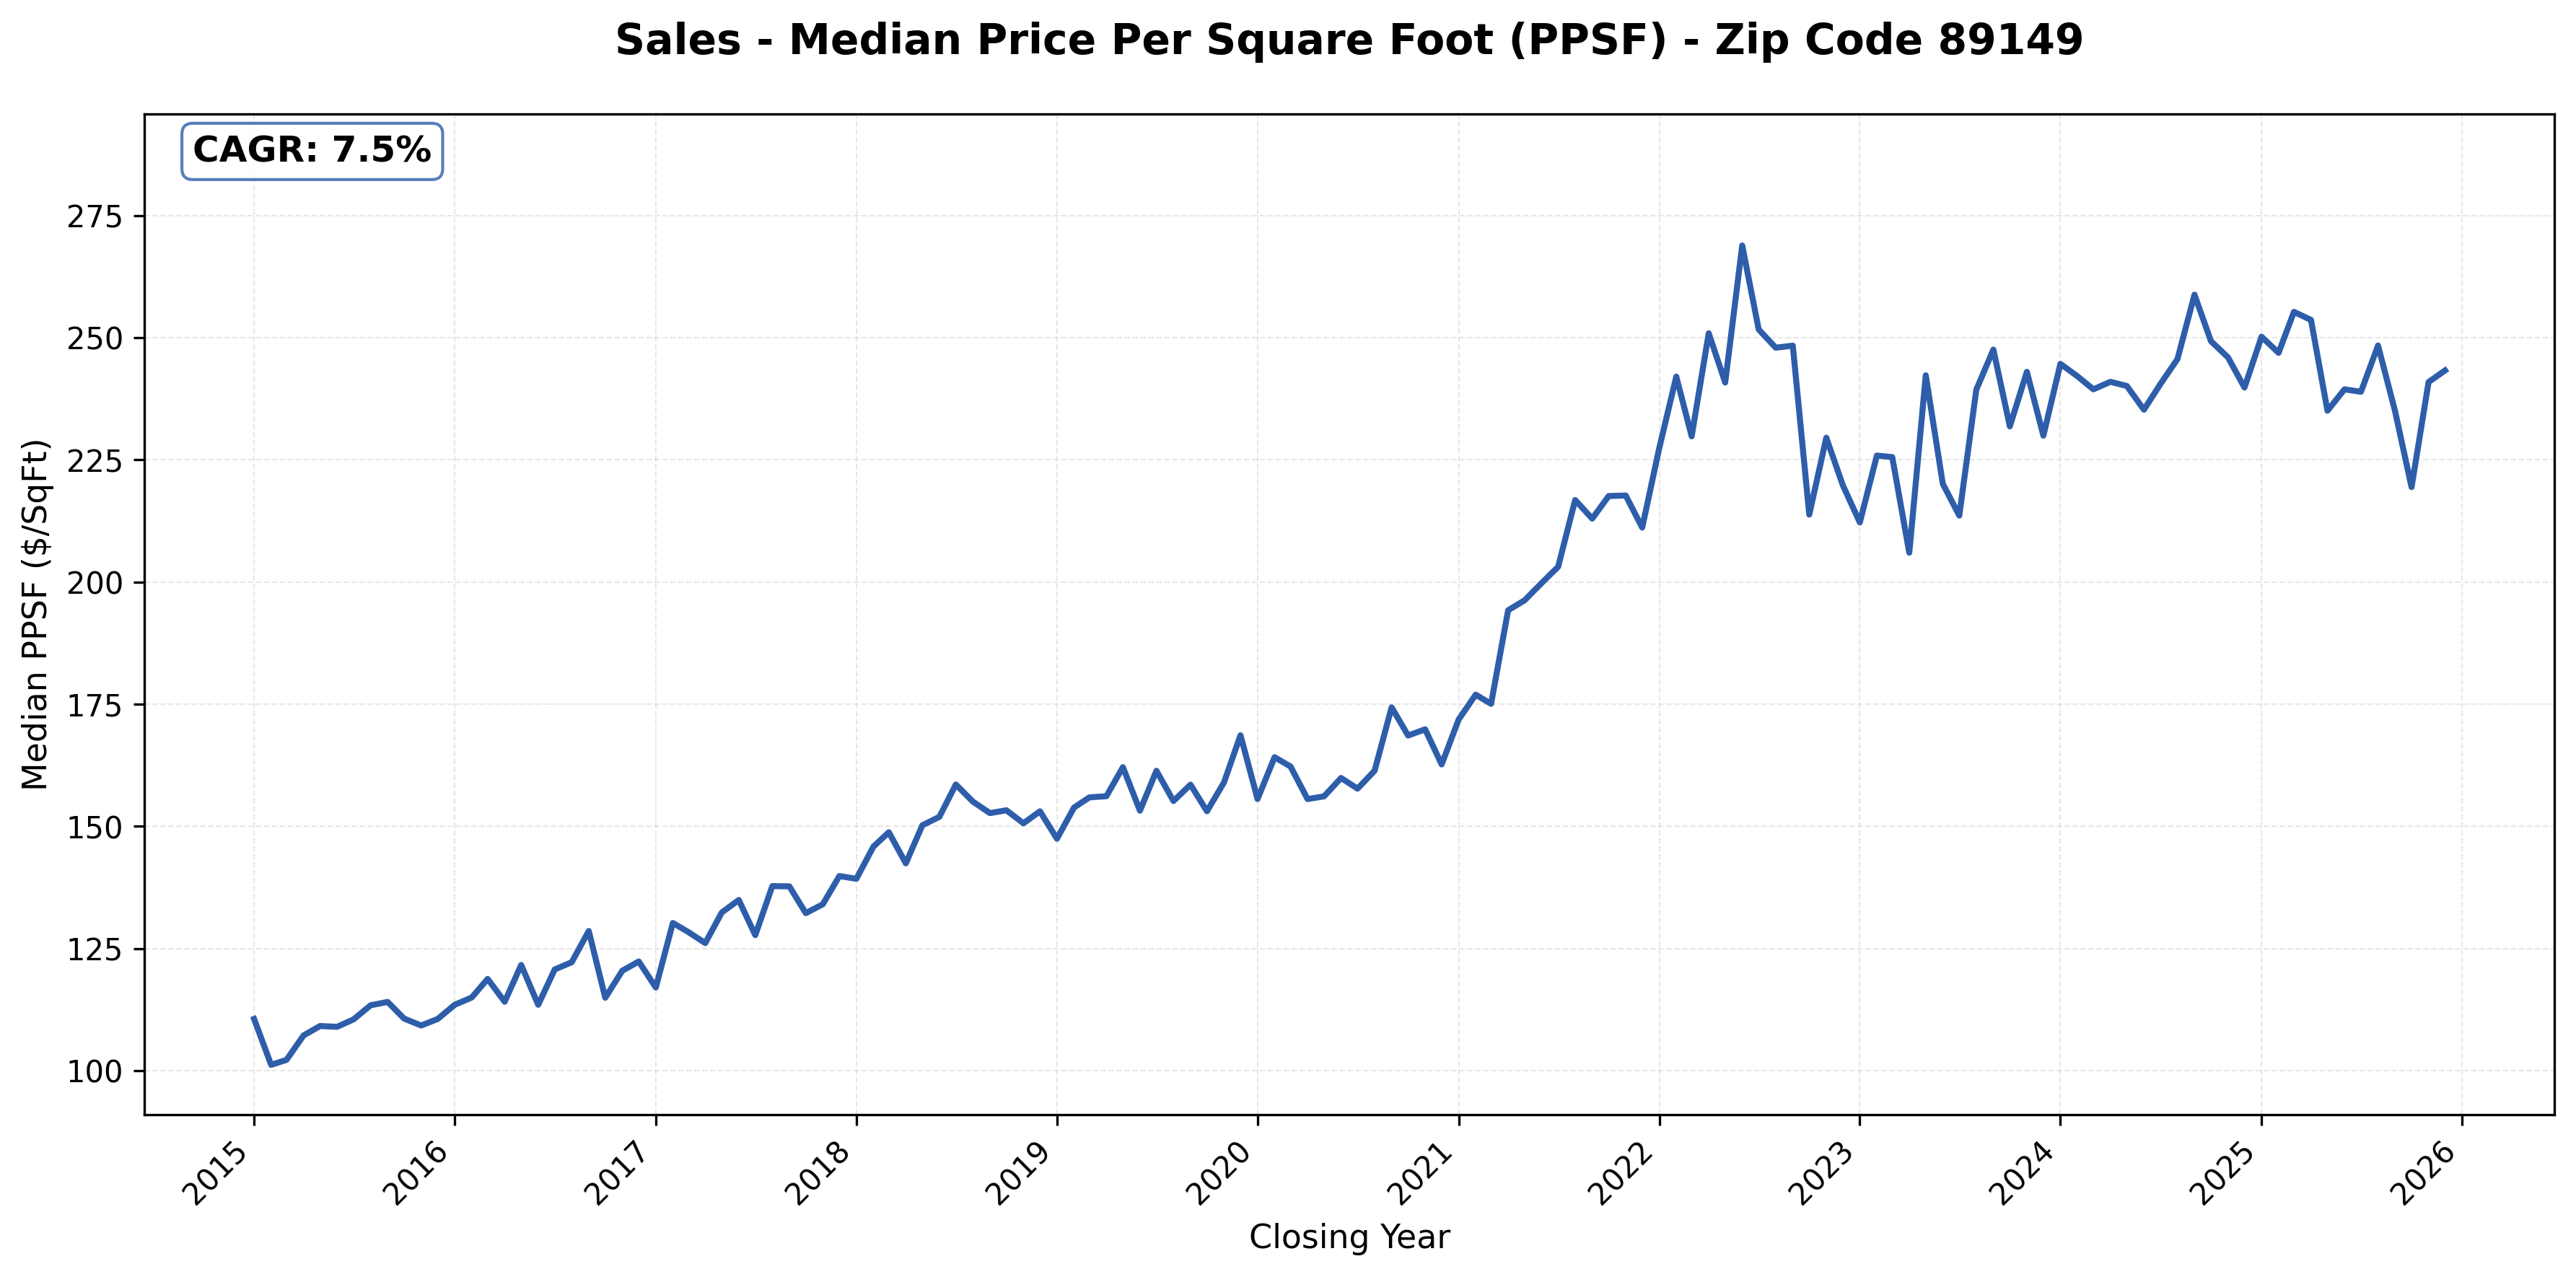
#14: 89149 (Northwest, Centennial Hills), (CAGR: 7.5%)
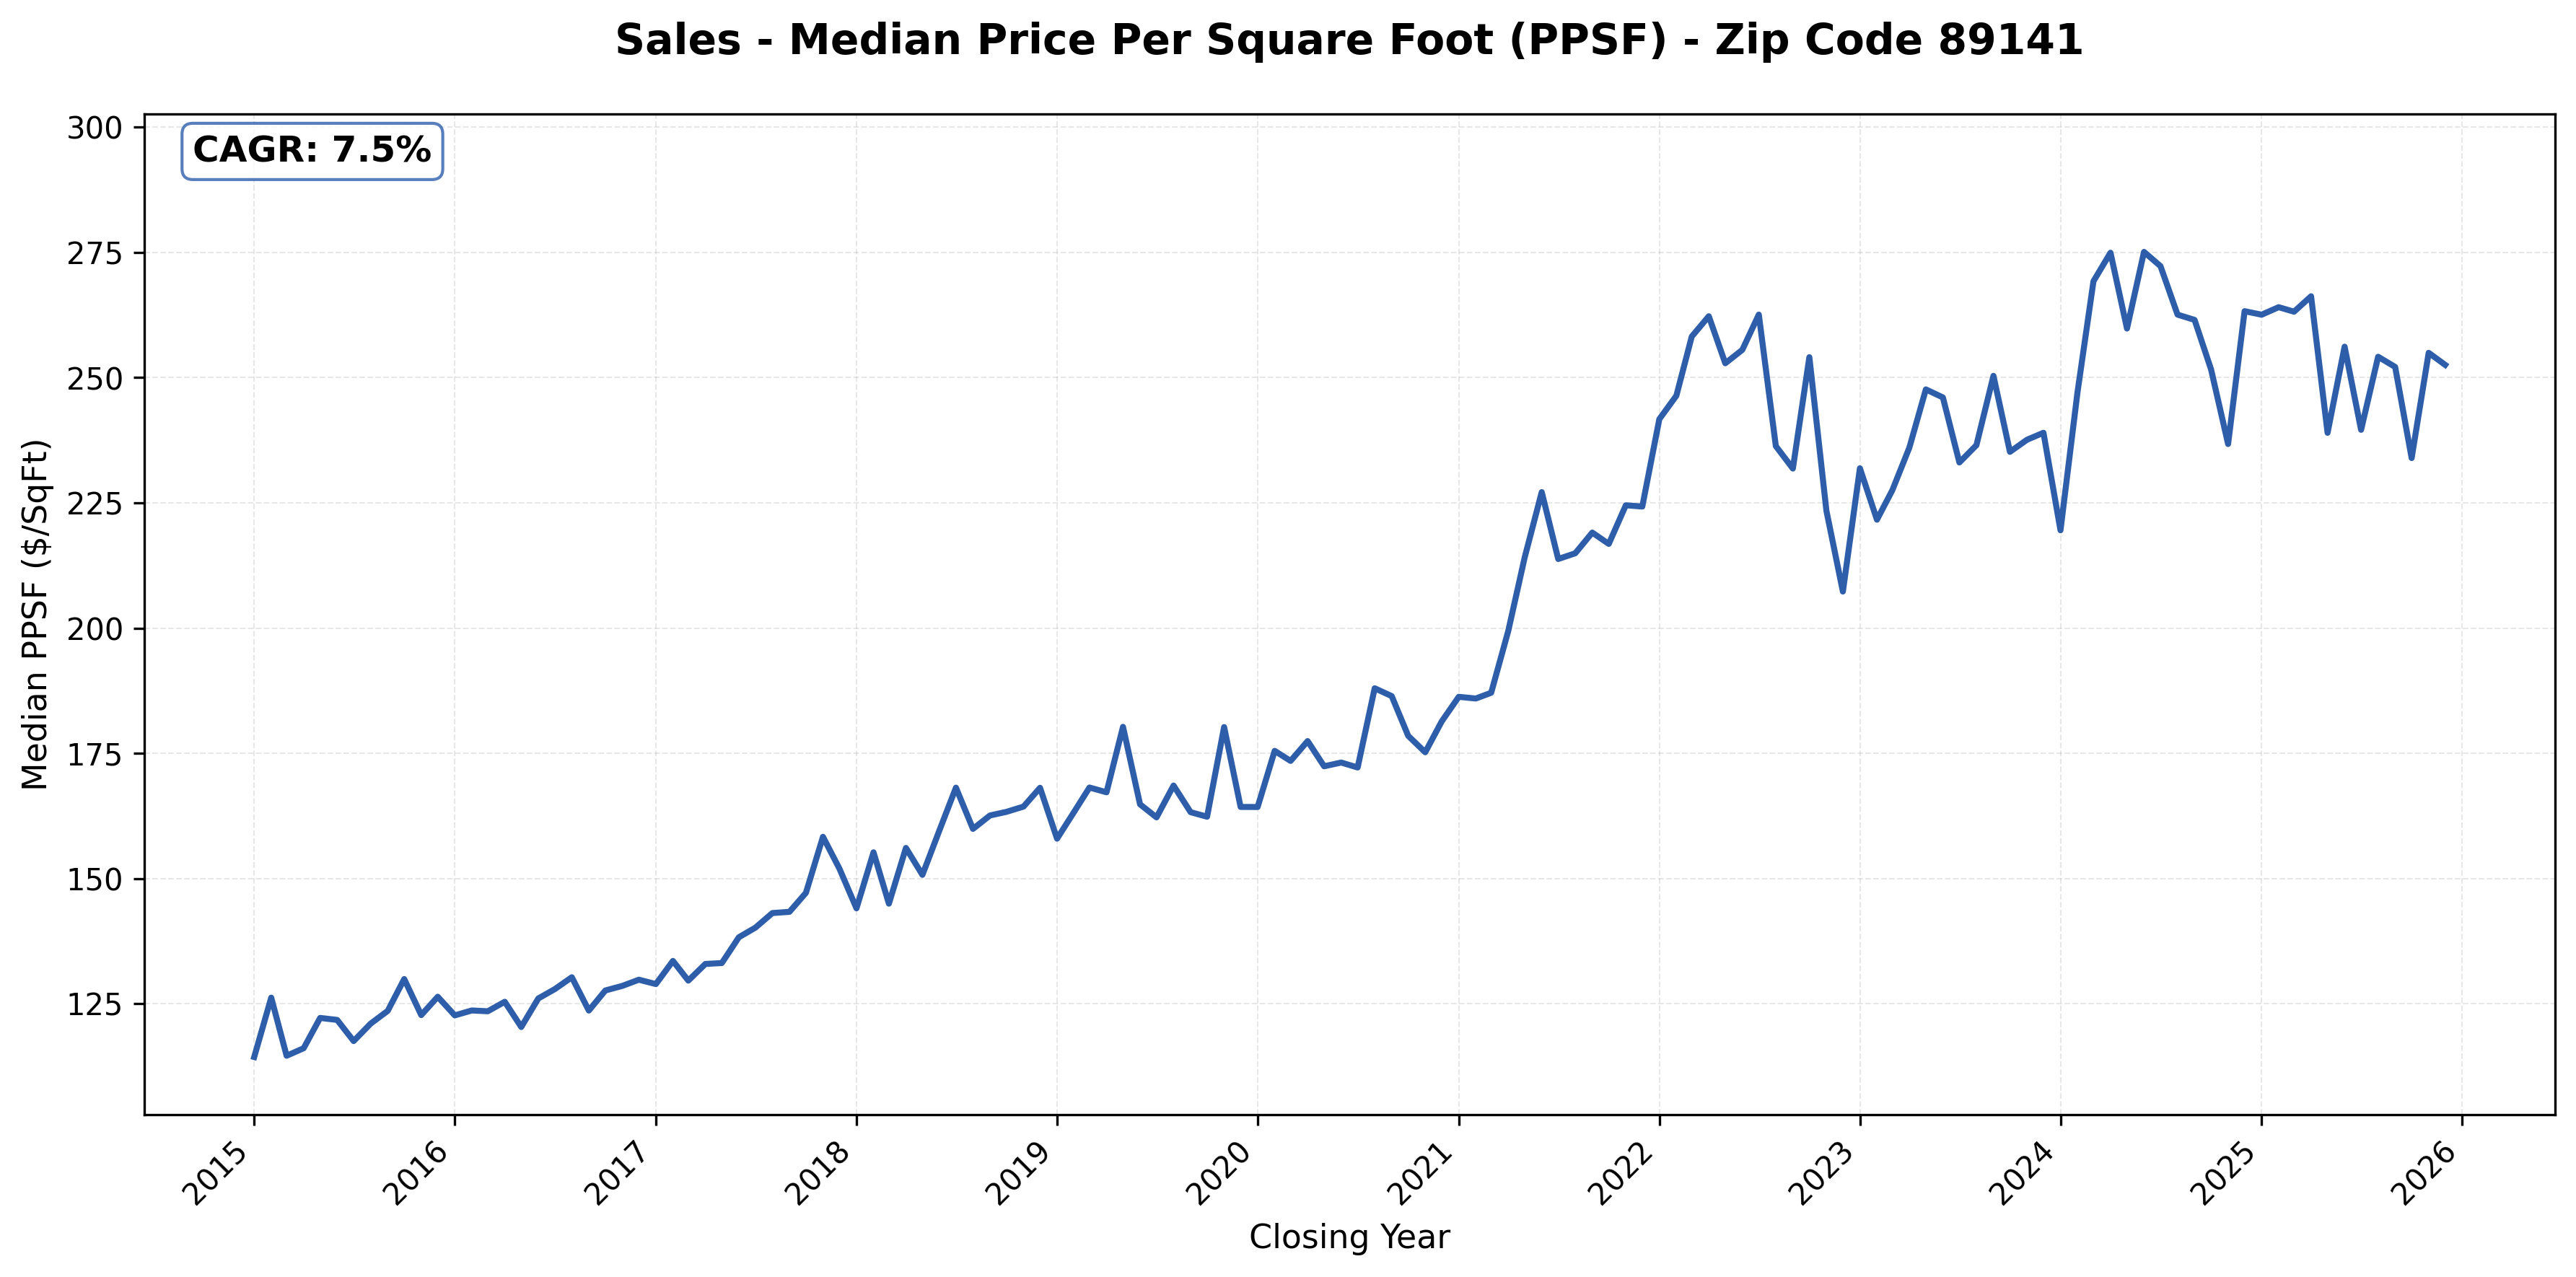
#15: 89141 (Southern Highland), 7.5% CAGR
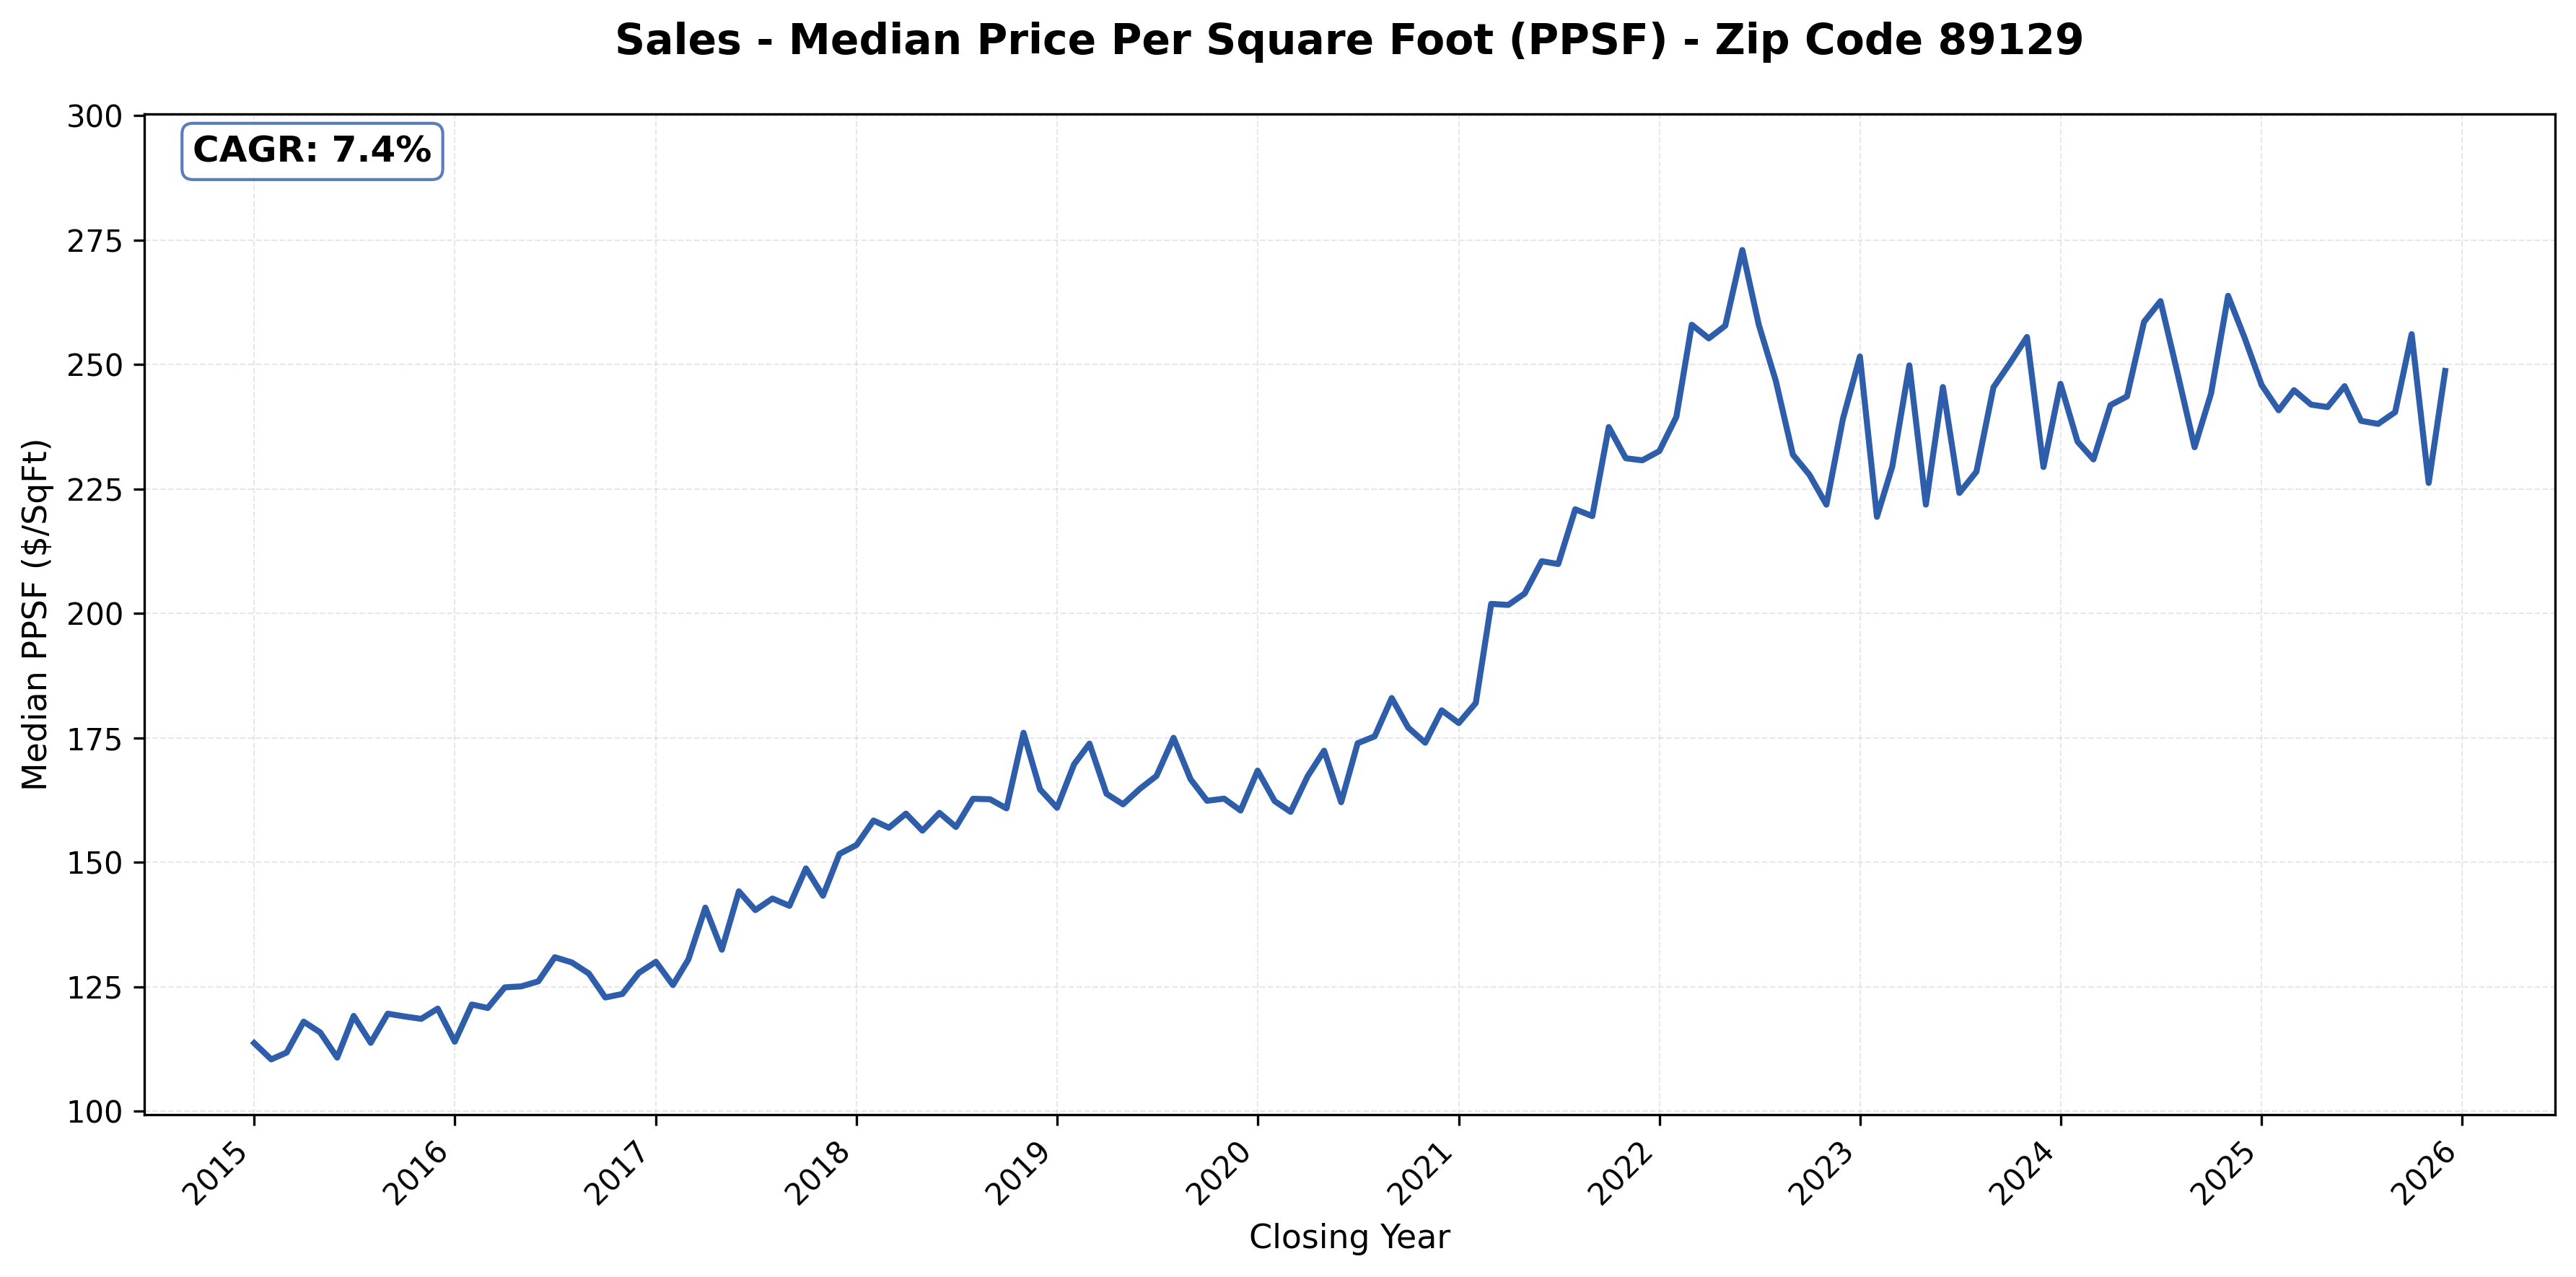
#16: 89129 (Northwest, Lone Mountain), 7.4% CAGR
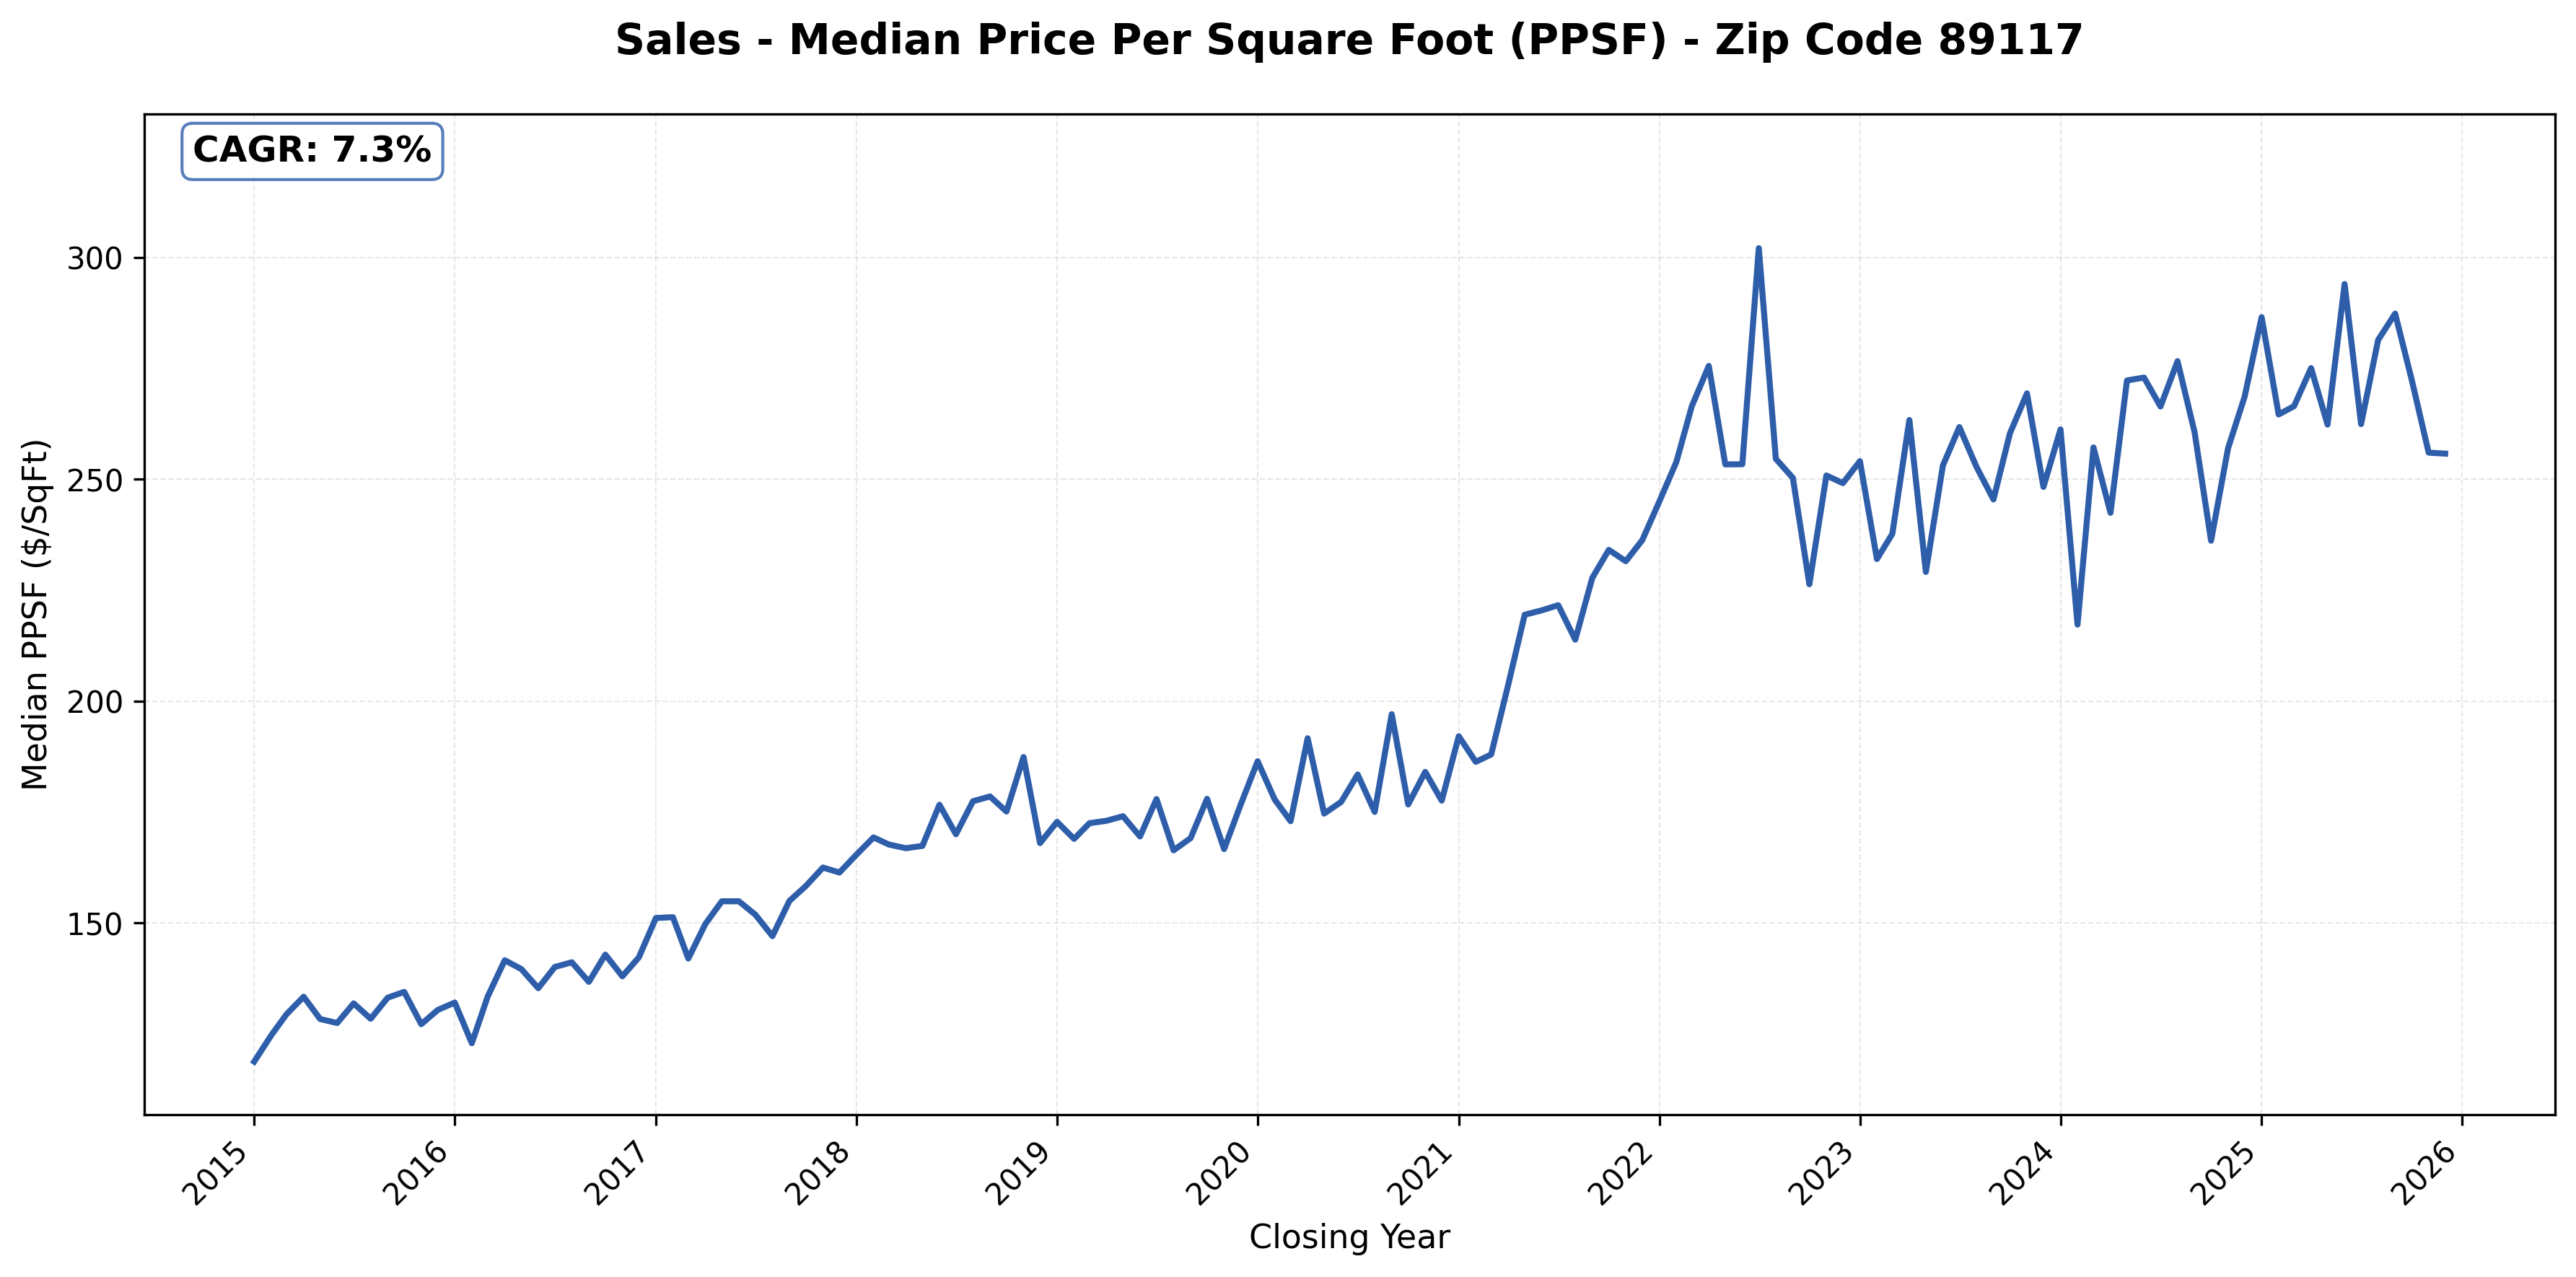
#17: 89117 (West, Summerlin adjacent), 7.3% CAGR
#18: 89130 (Northwest, Centennial Hills), 7.2% CAGR

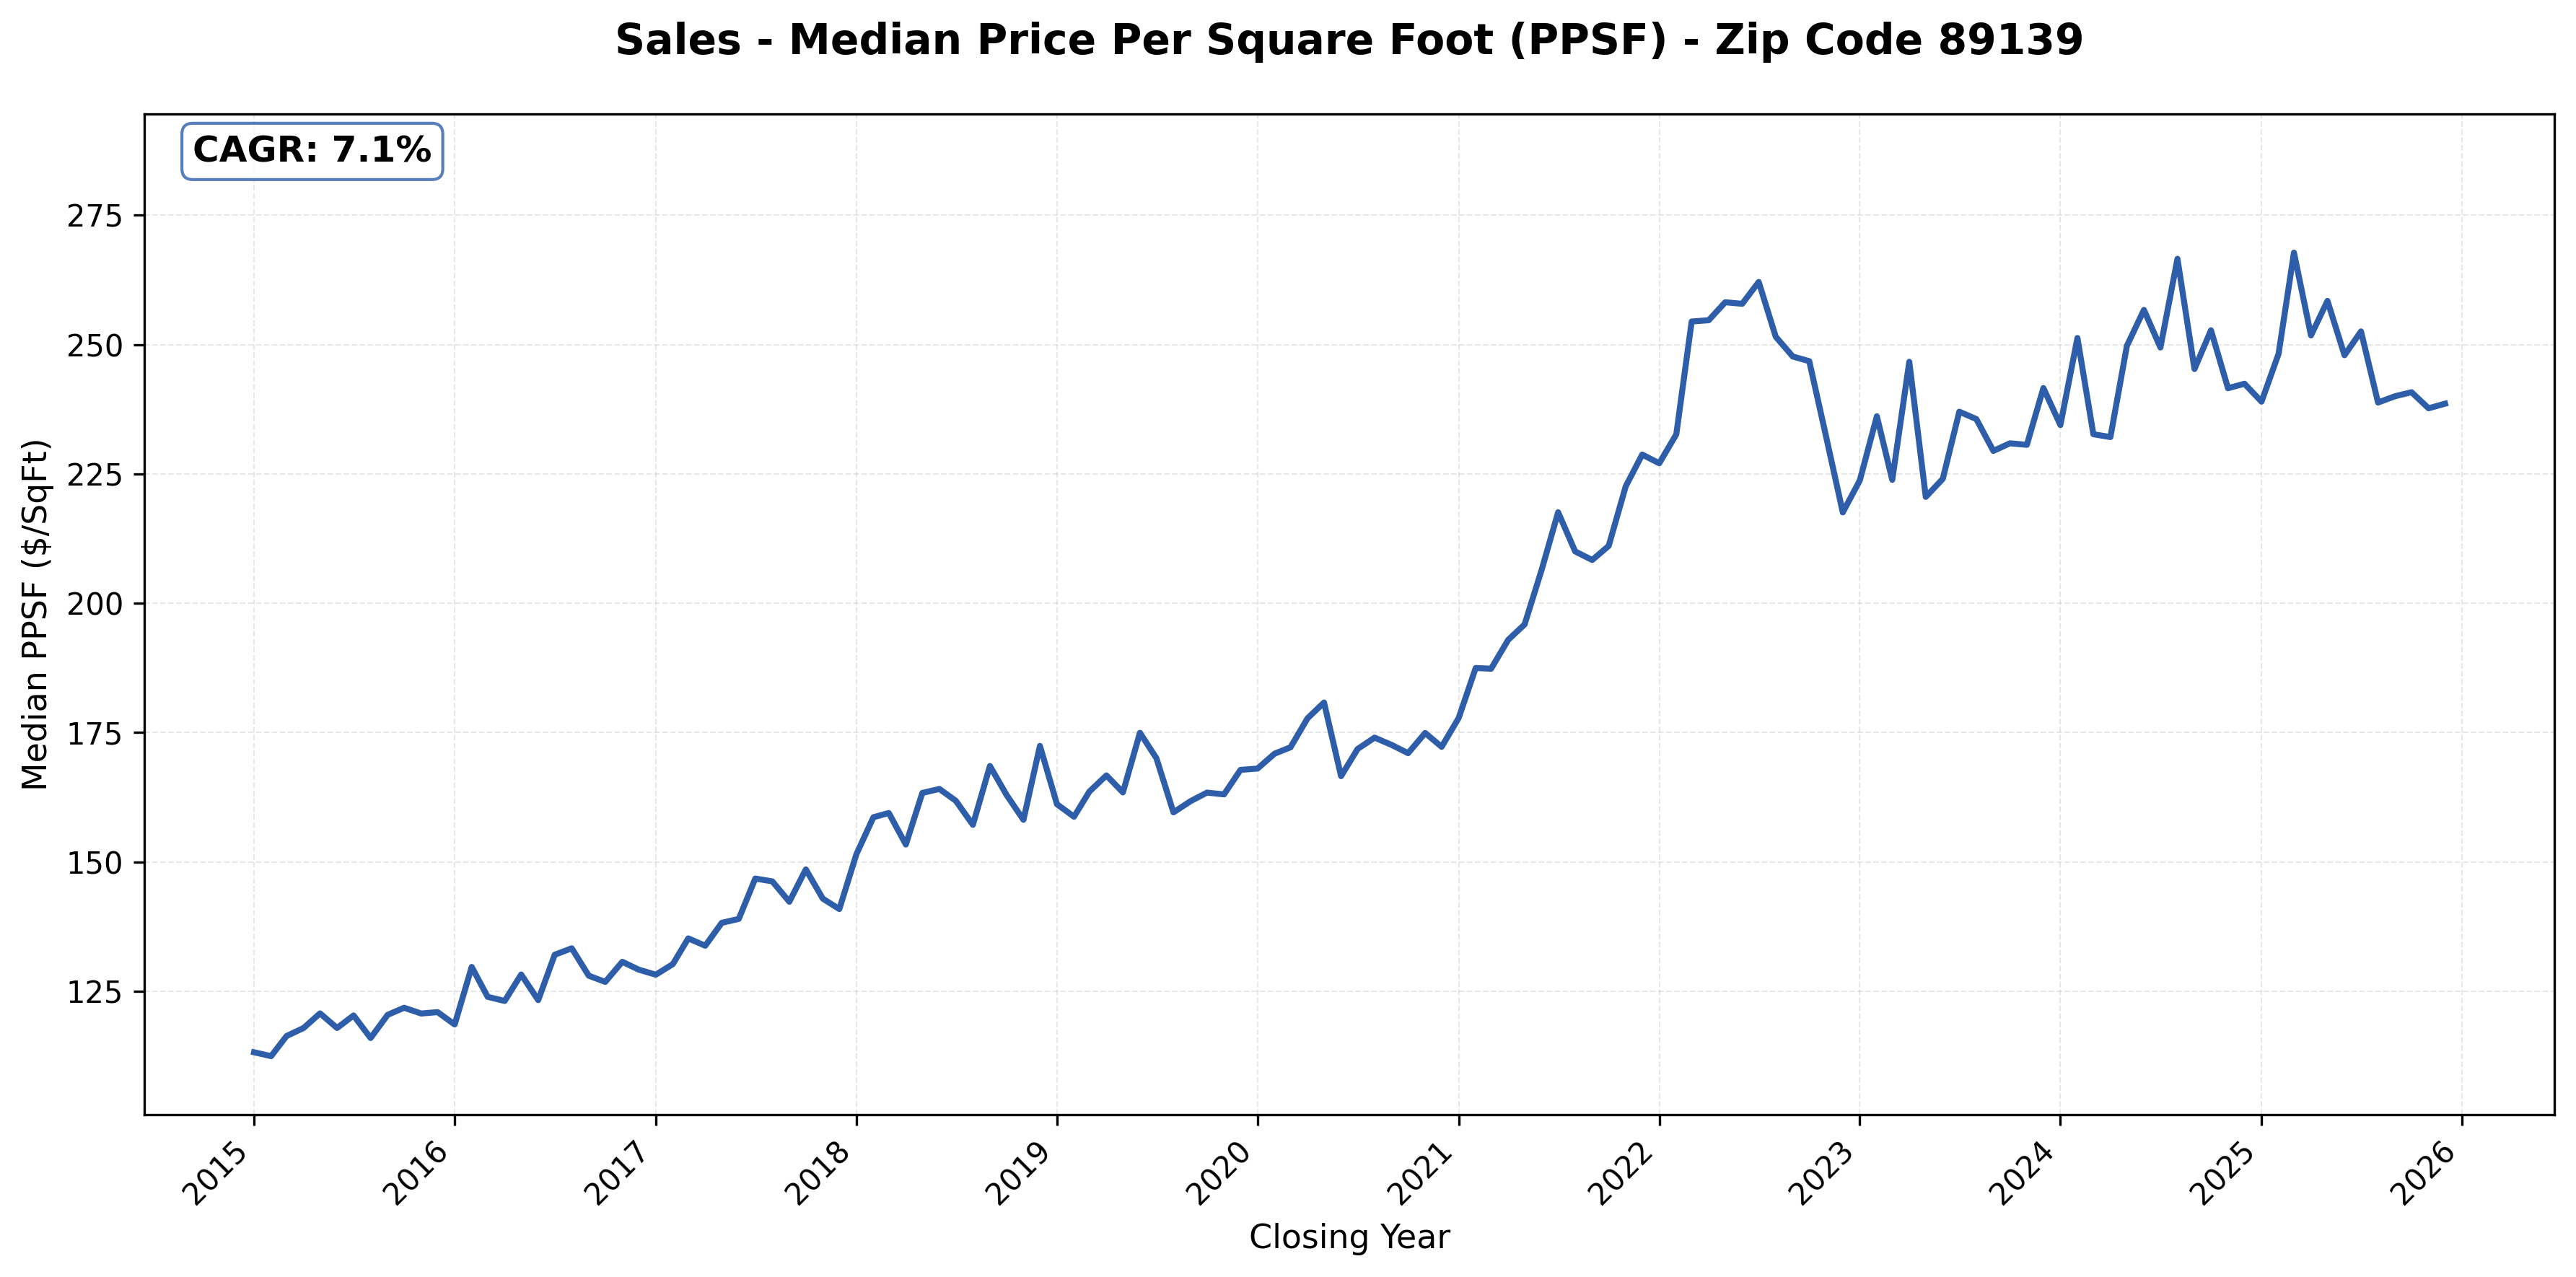
#19: 89139 (Southwest, Blue Diamond), 7.1% CAGR
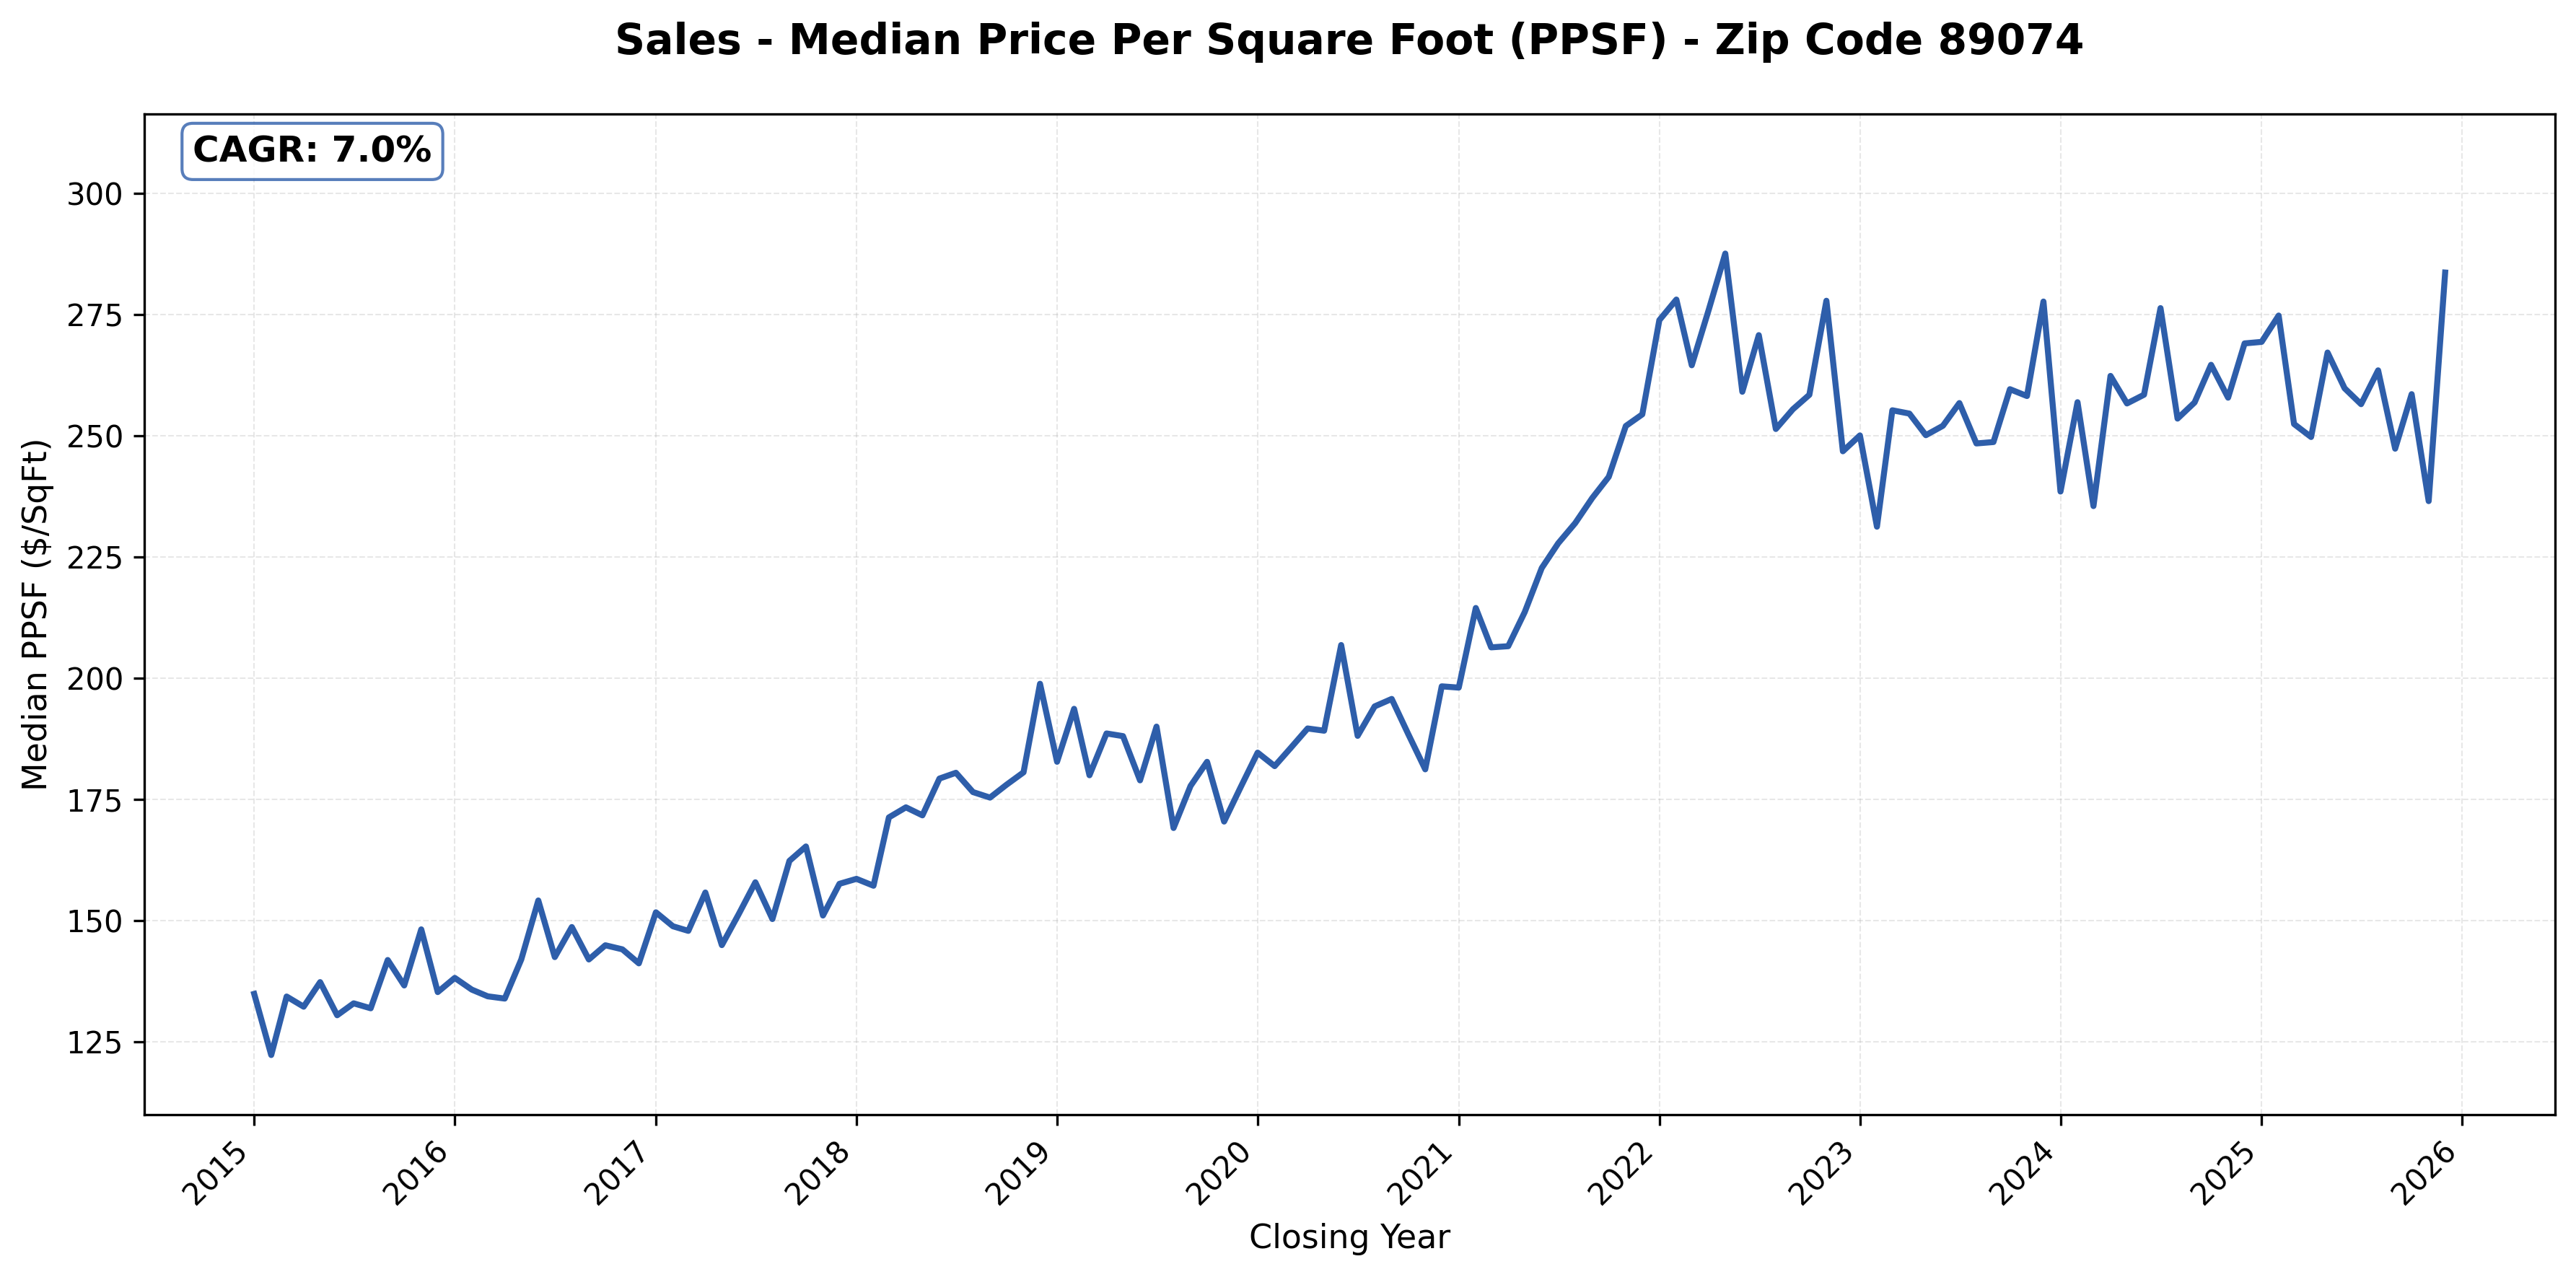
#20: 89074 (Green Valley, Henderson), 7.0% CAGR
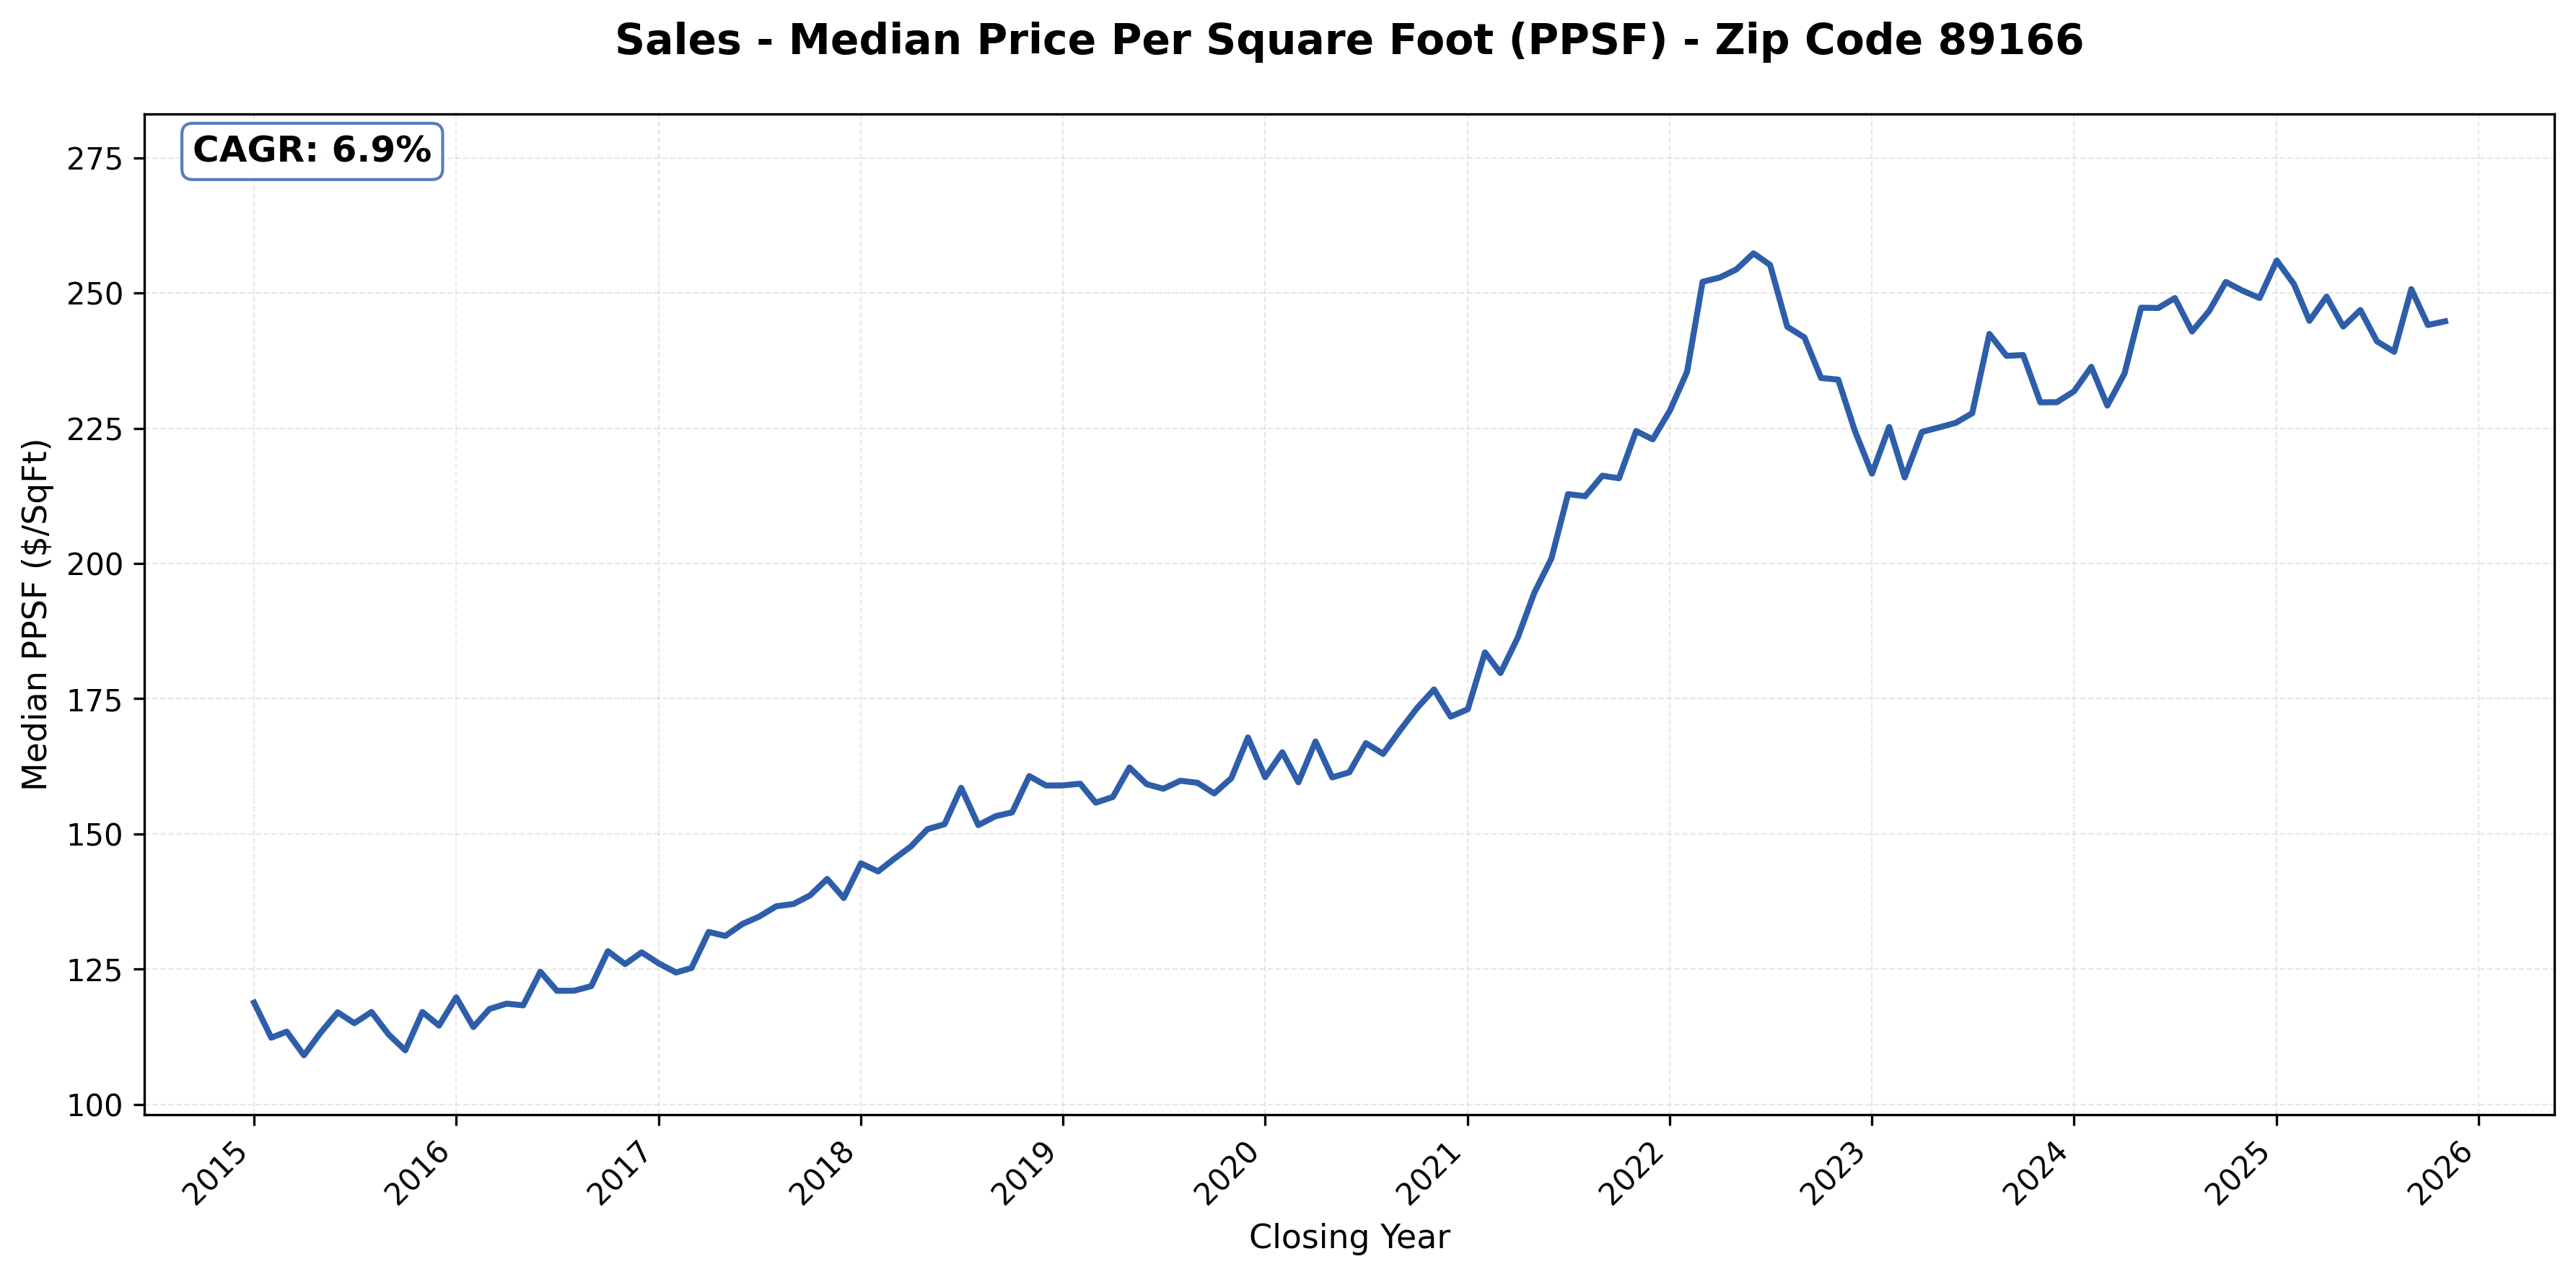
#21: 89166 (Centennial Hills), 6.9% CAGR
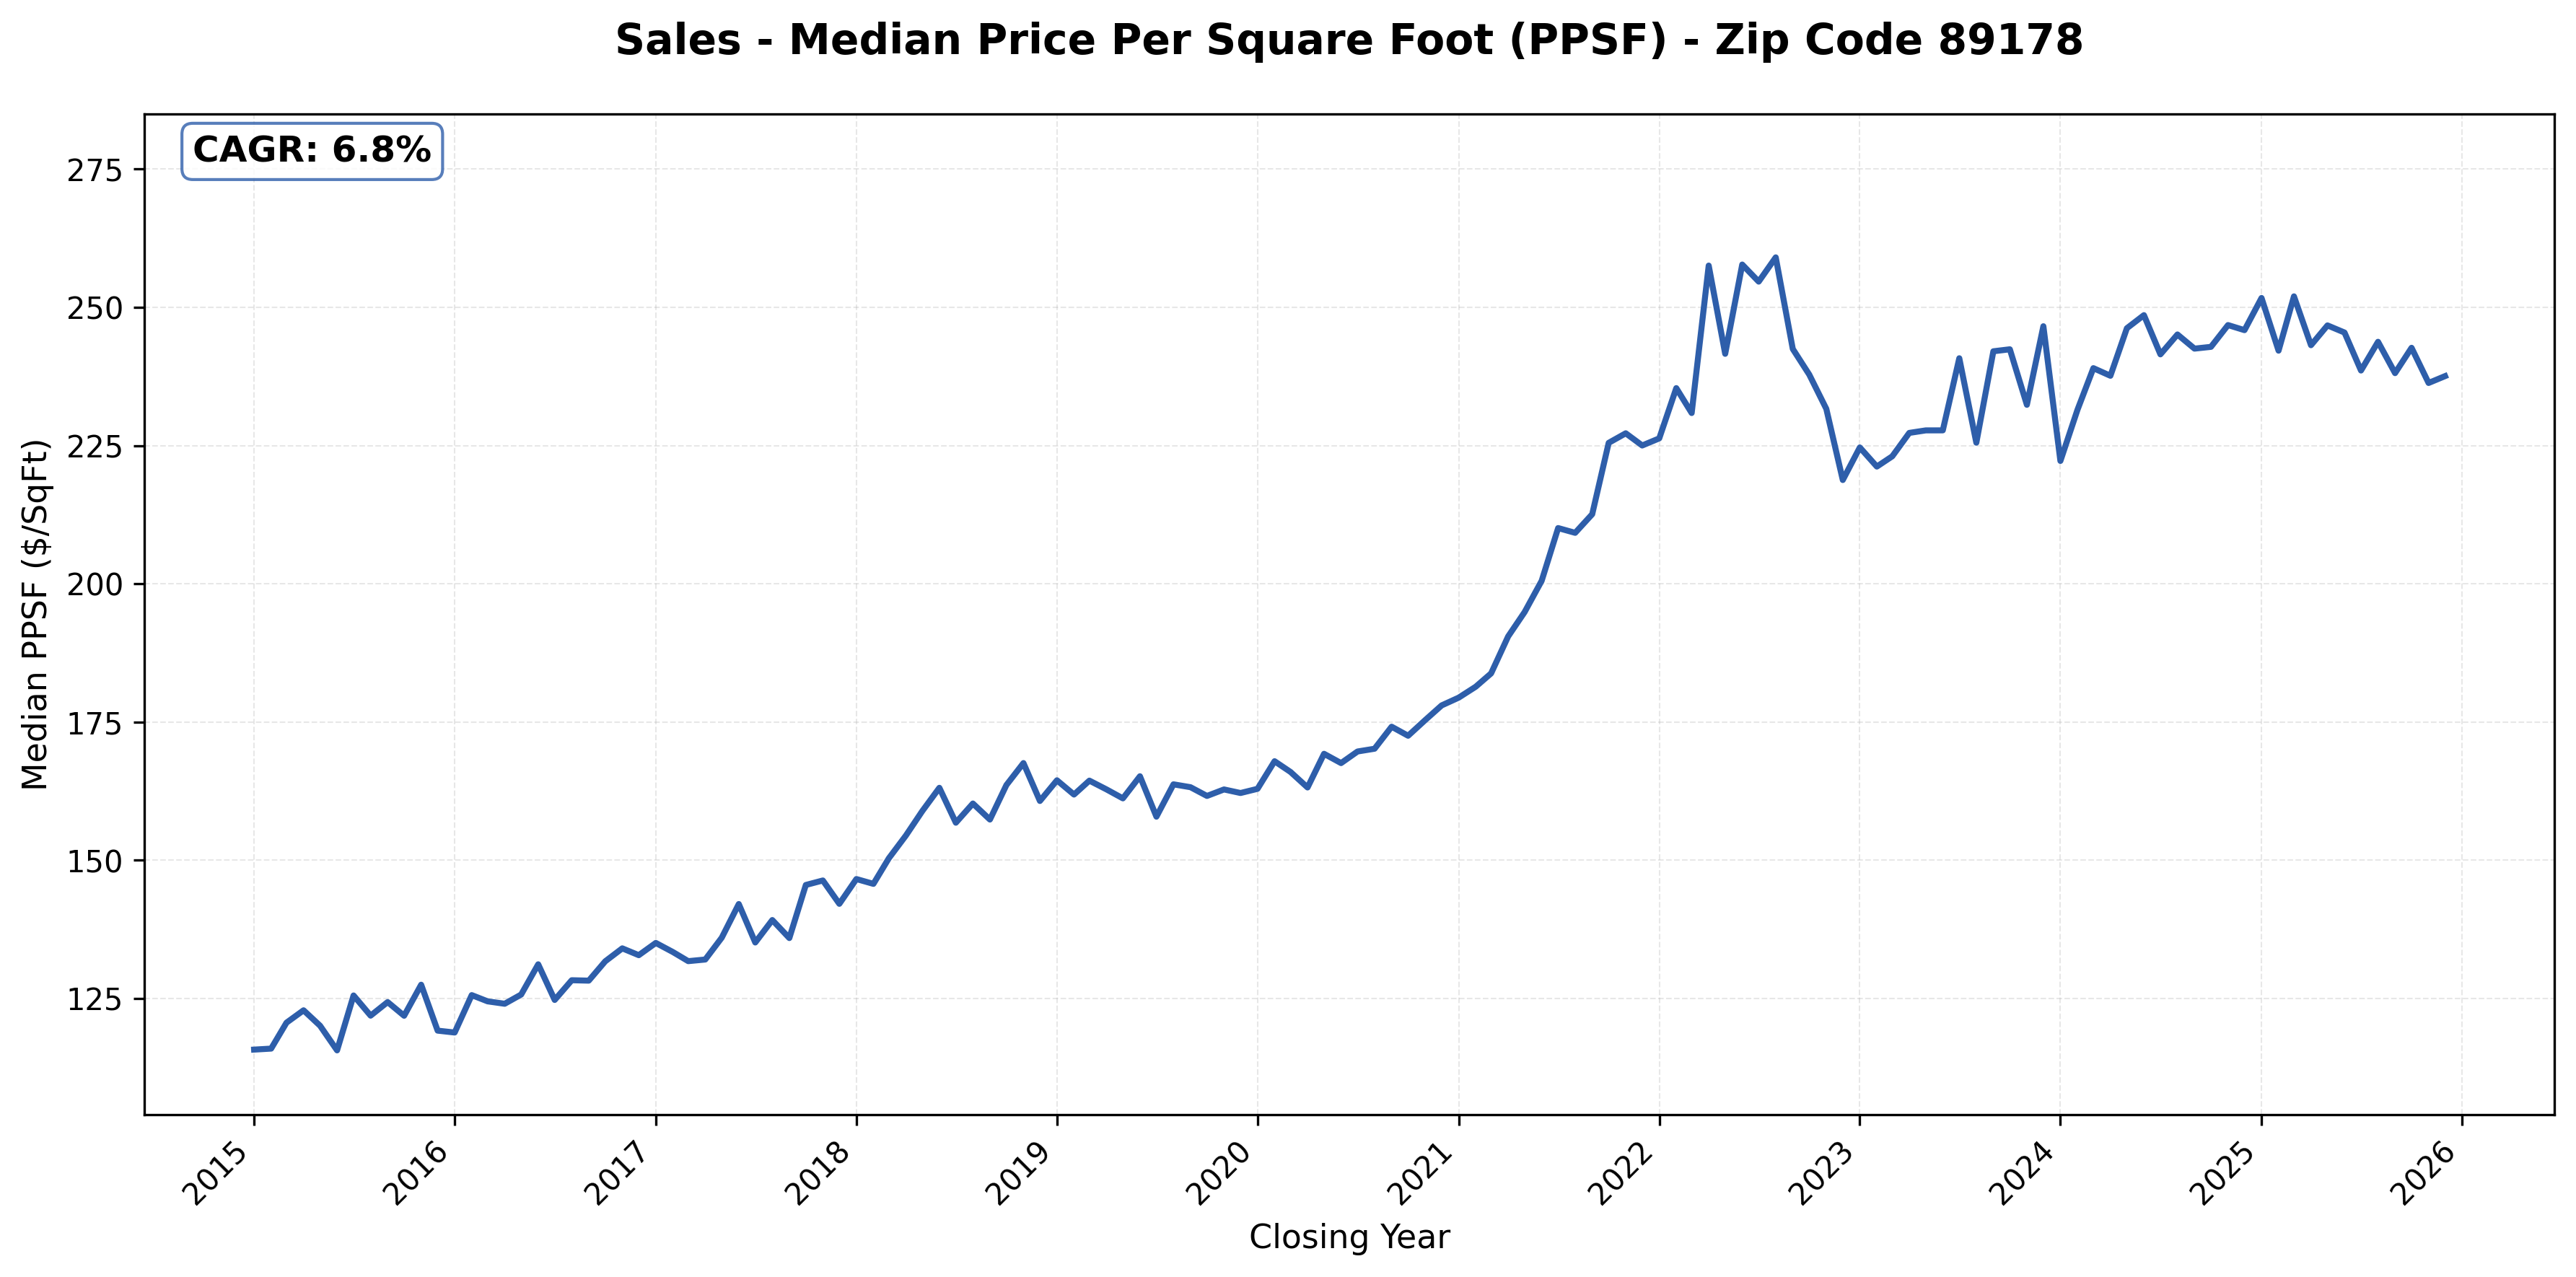
#22: 89178 (Southwest, Mountain’s Edge), 6.8% CAGR
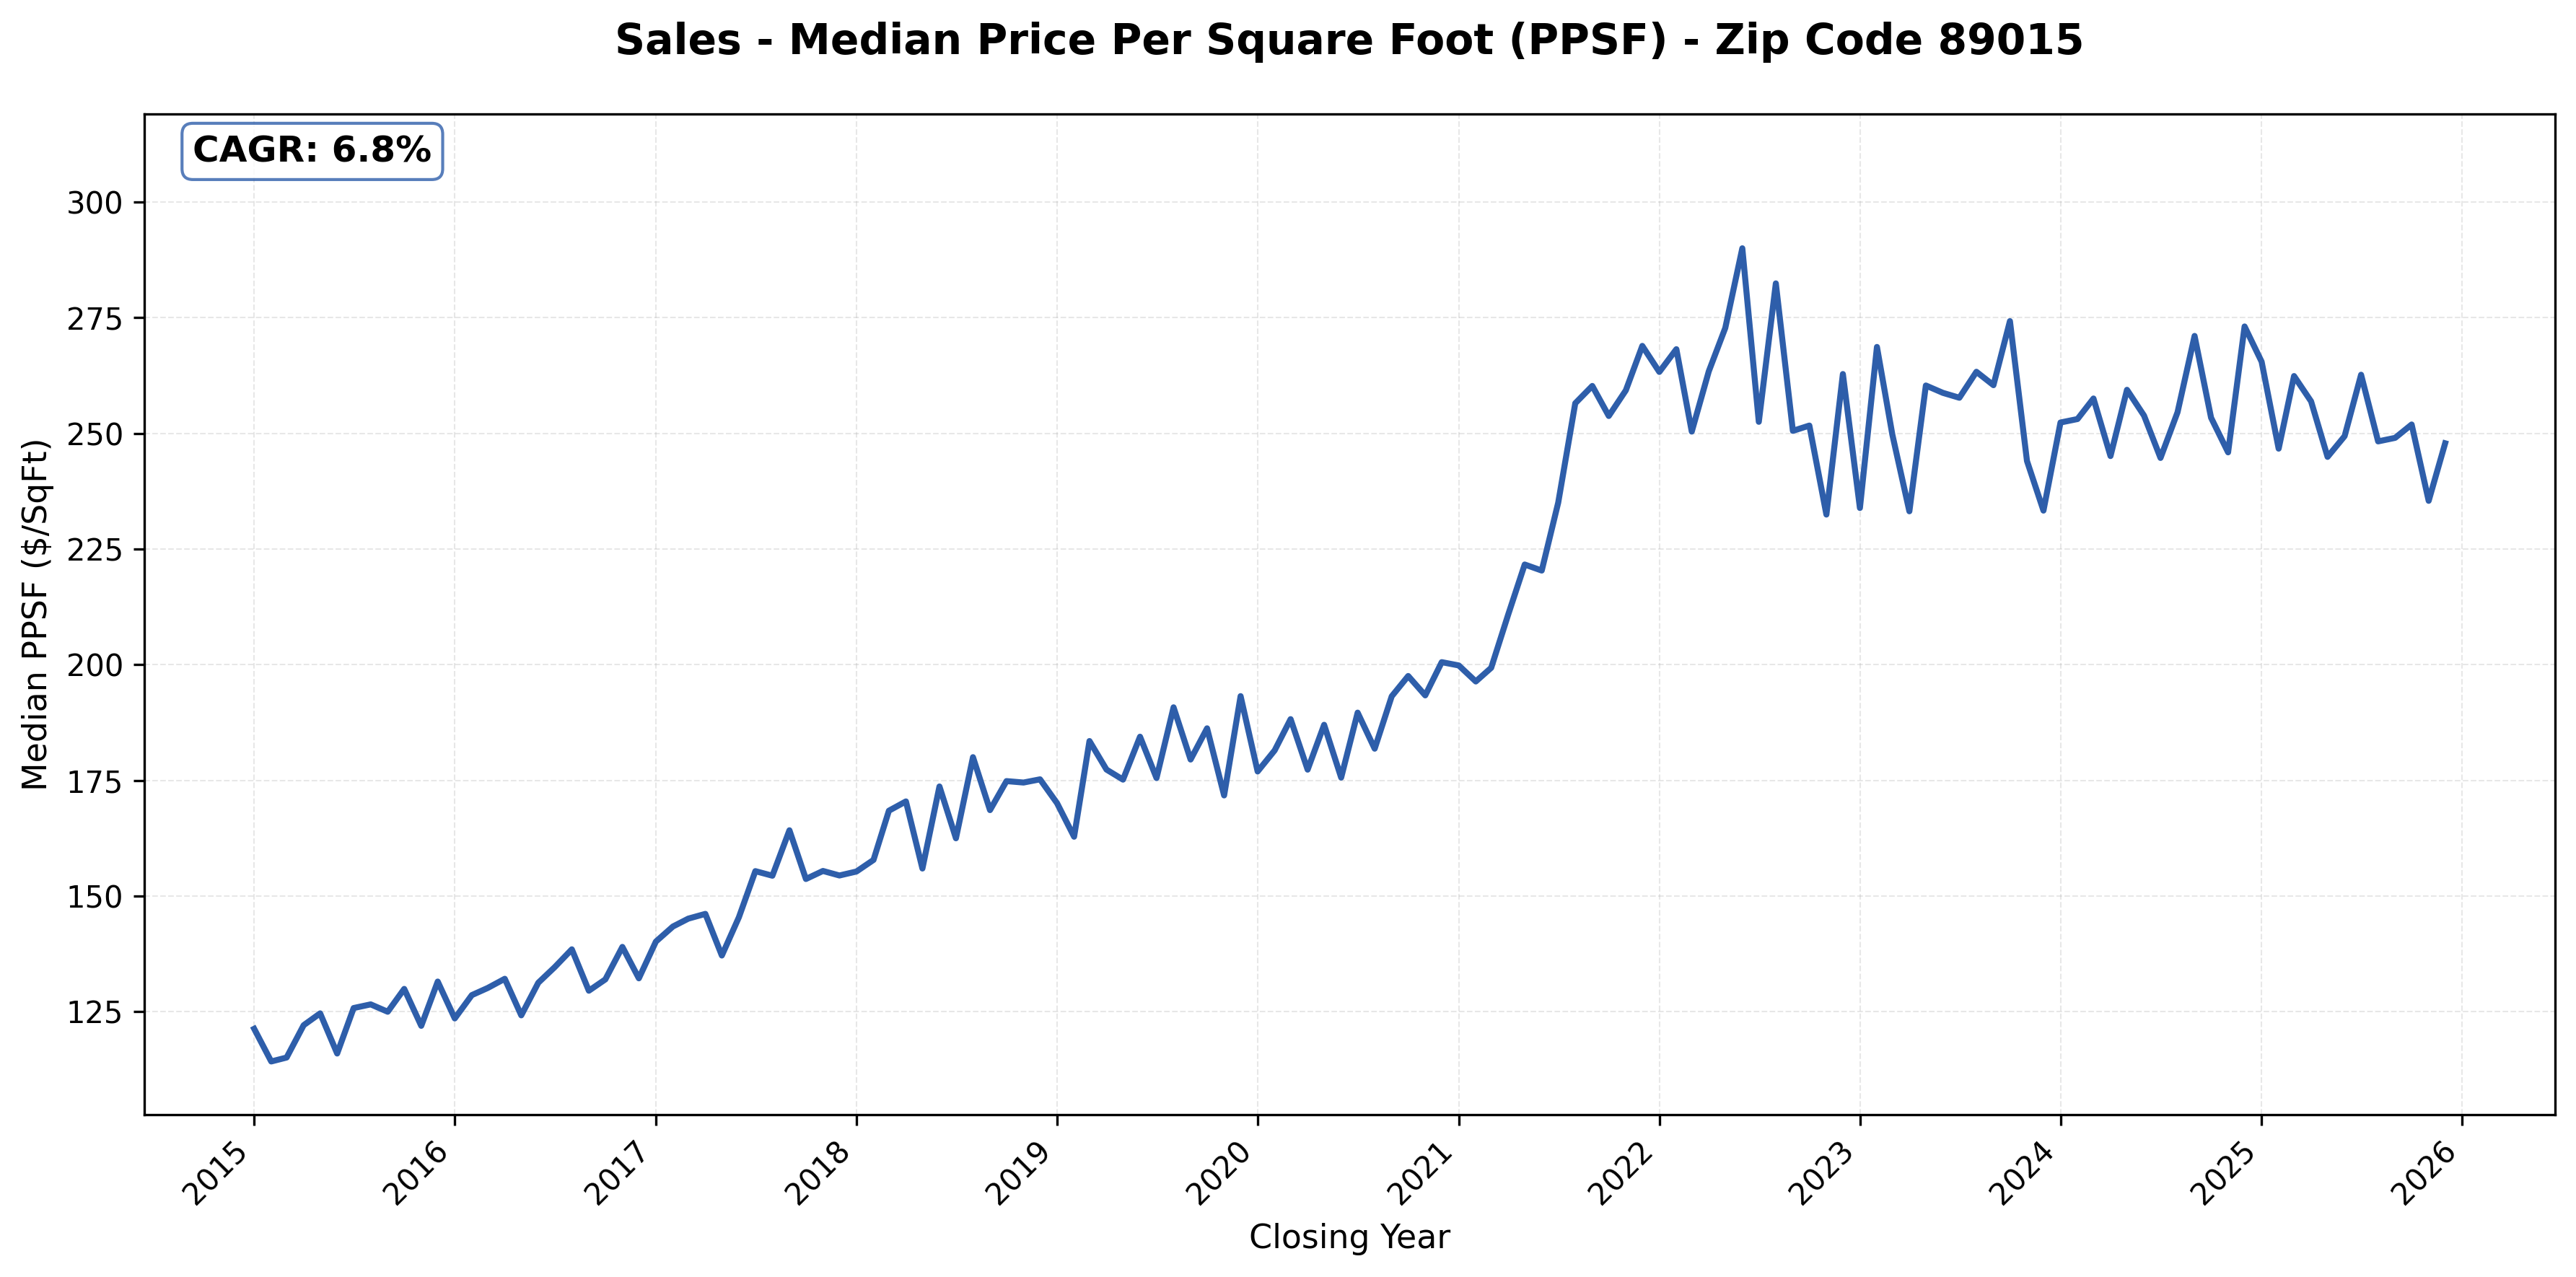
#23: 89015 (Henderson), 6.8% CAGR
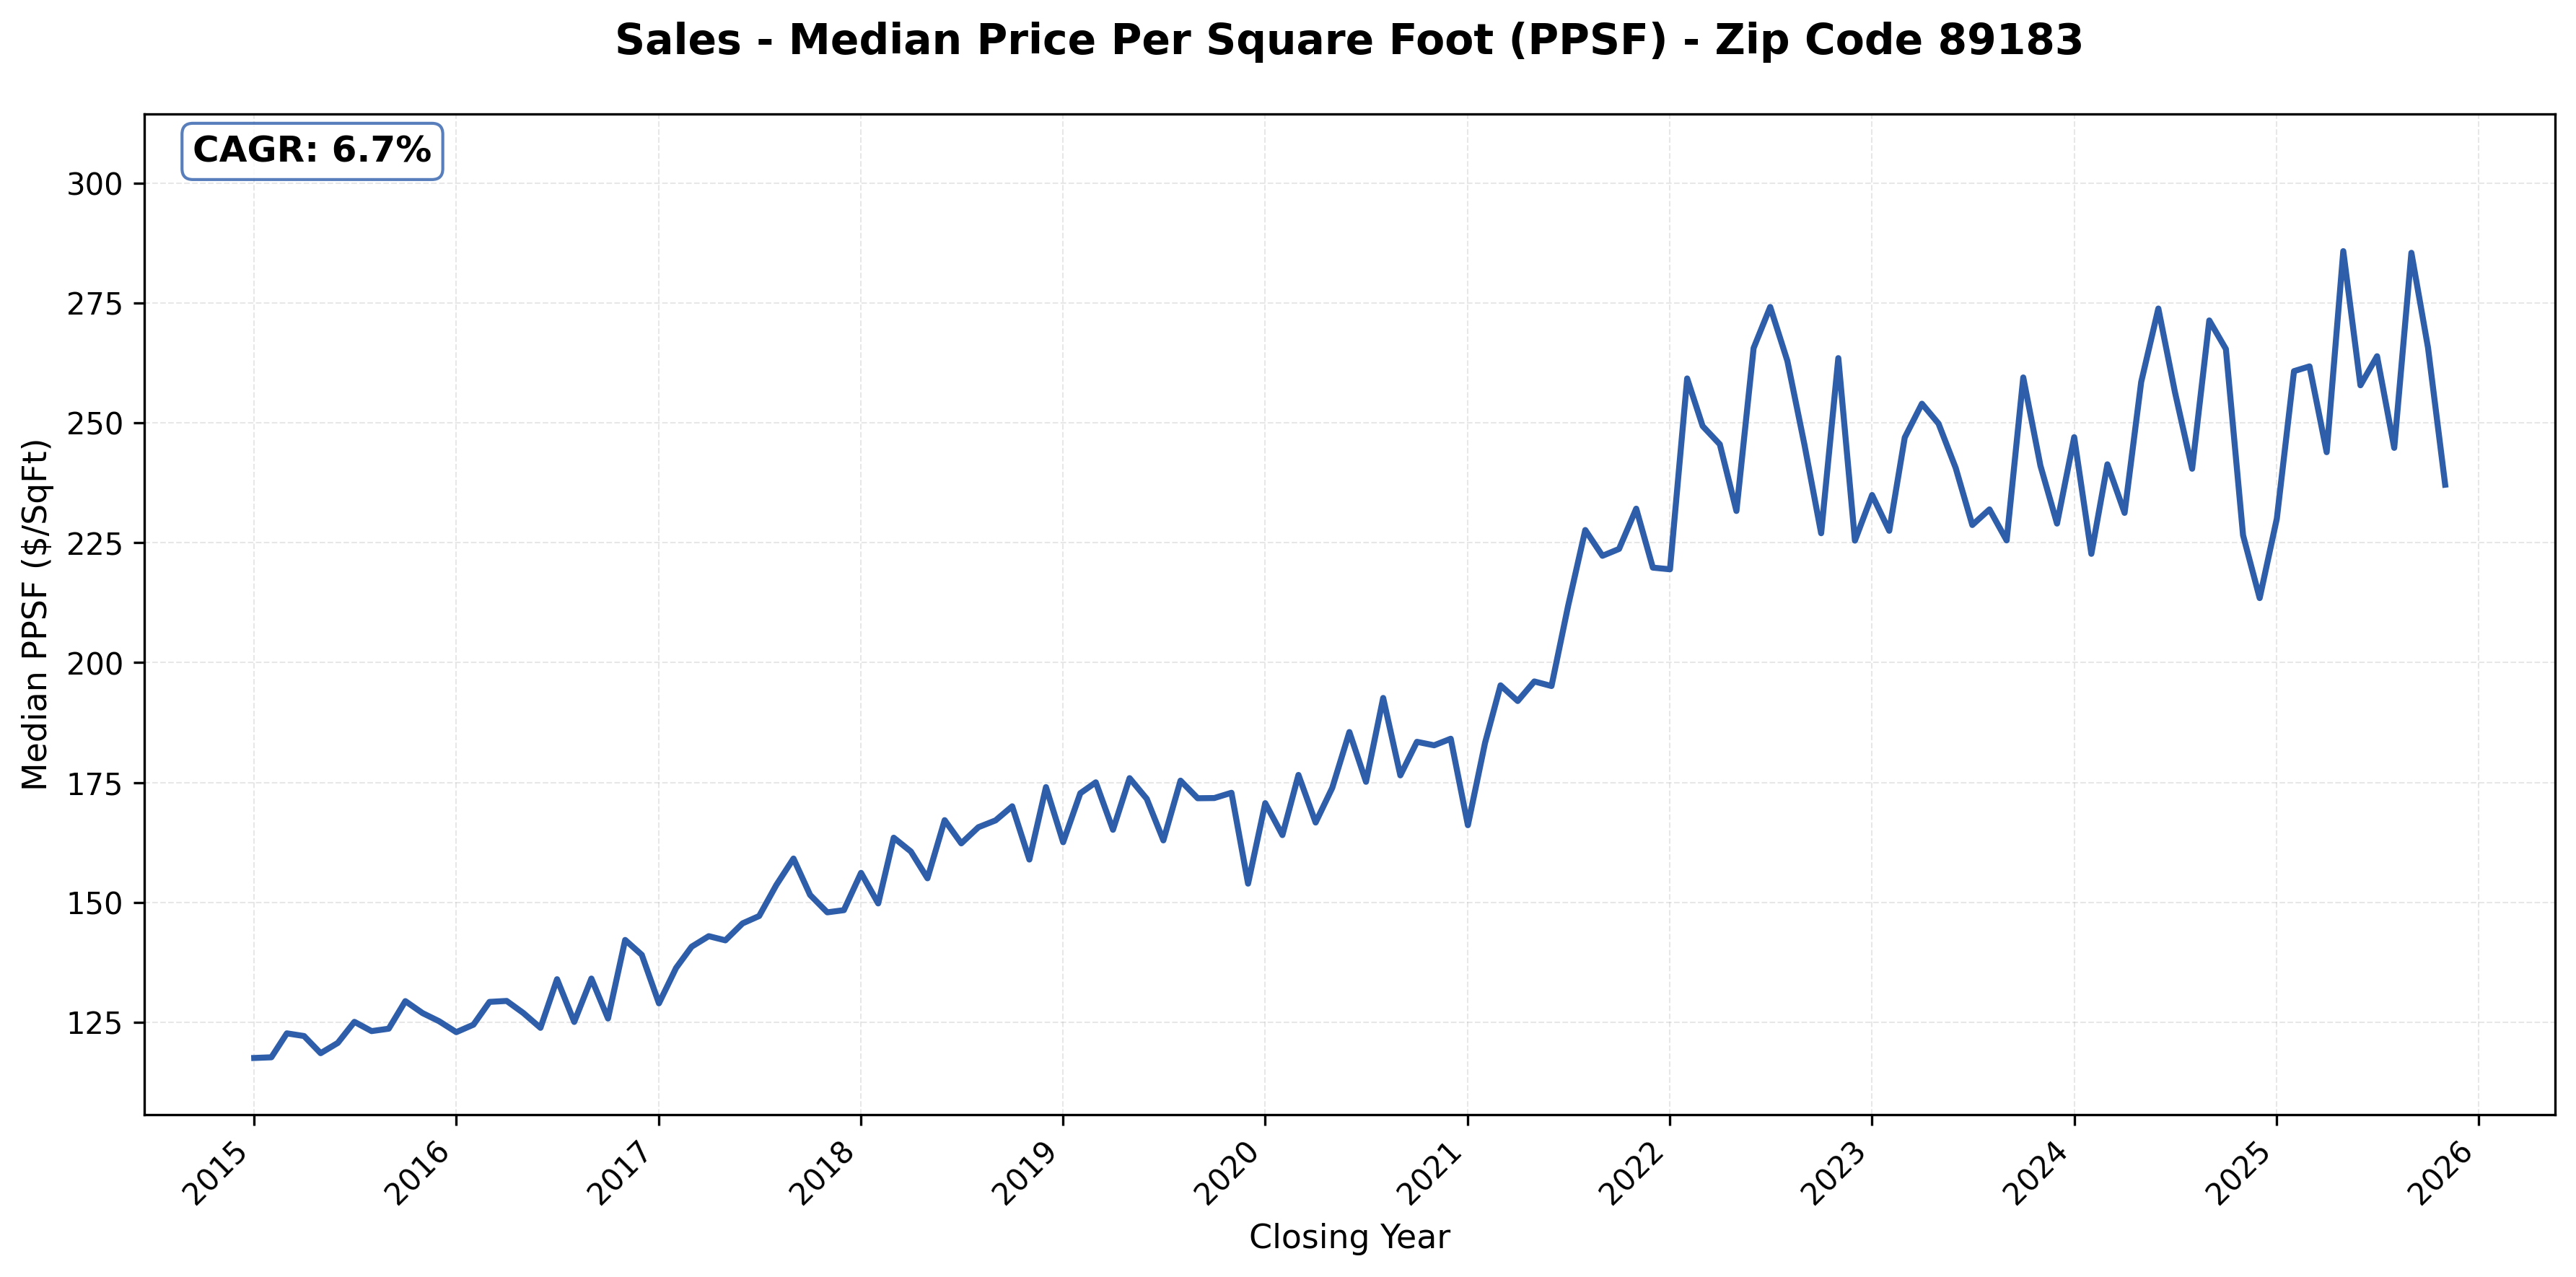
#24: 89183 (Silverado Ranch South), 6.7% CAGR
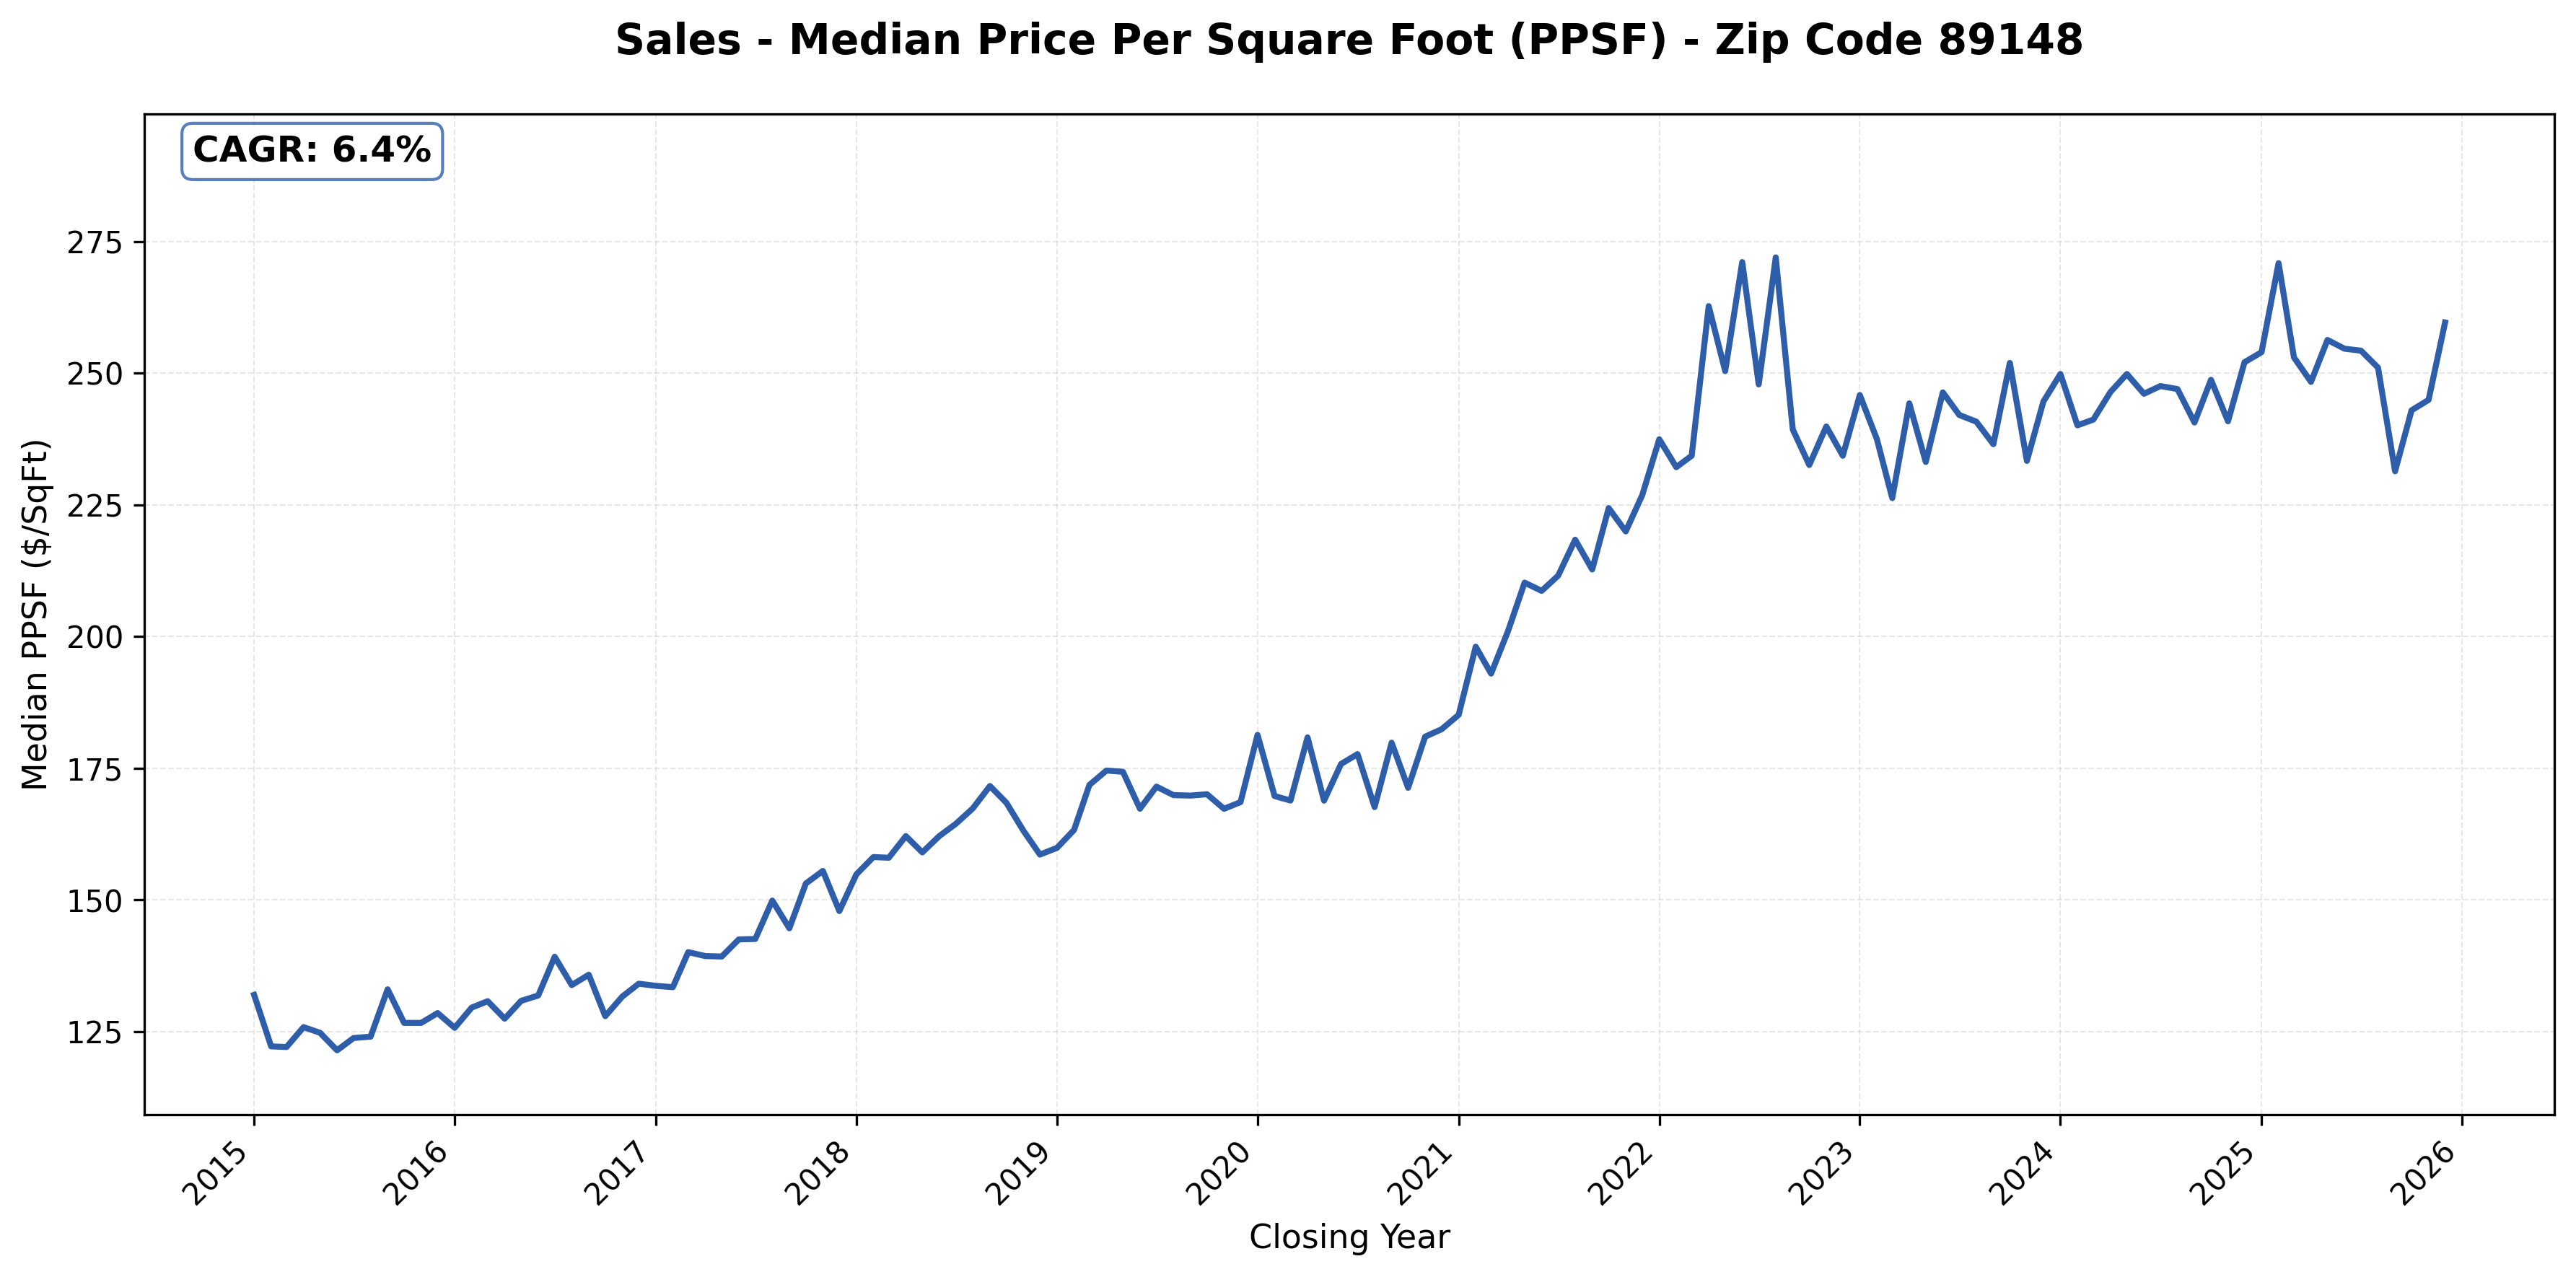
#25: 89148 (Southwest, Rhodes Ranch), 6.4% CAGR
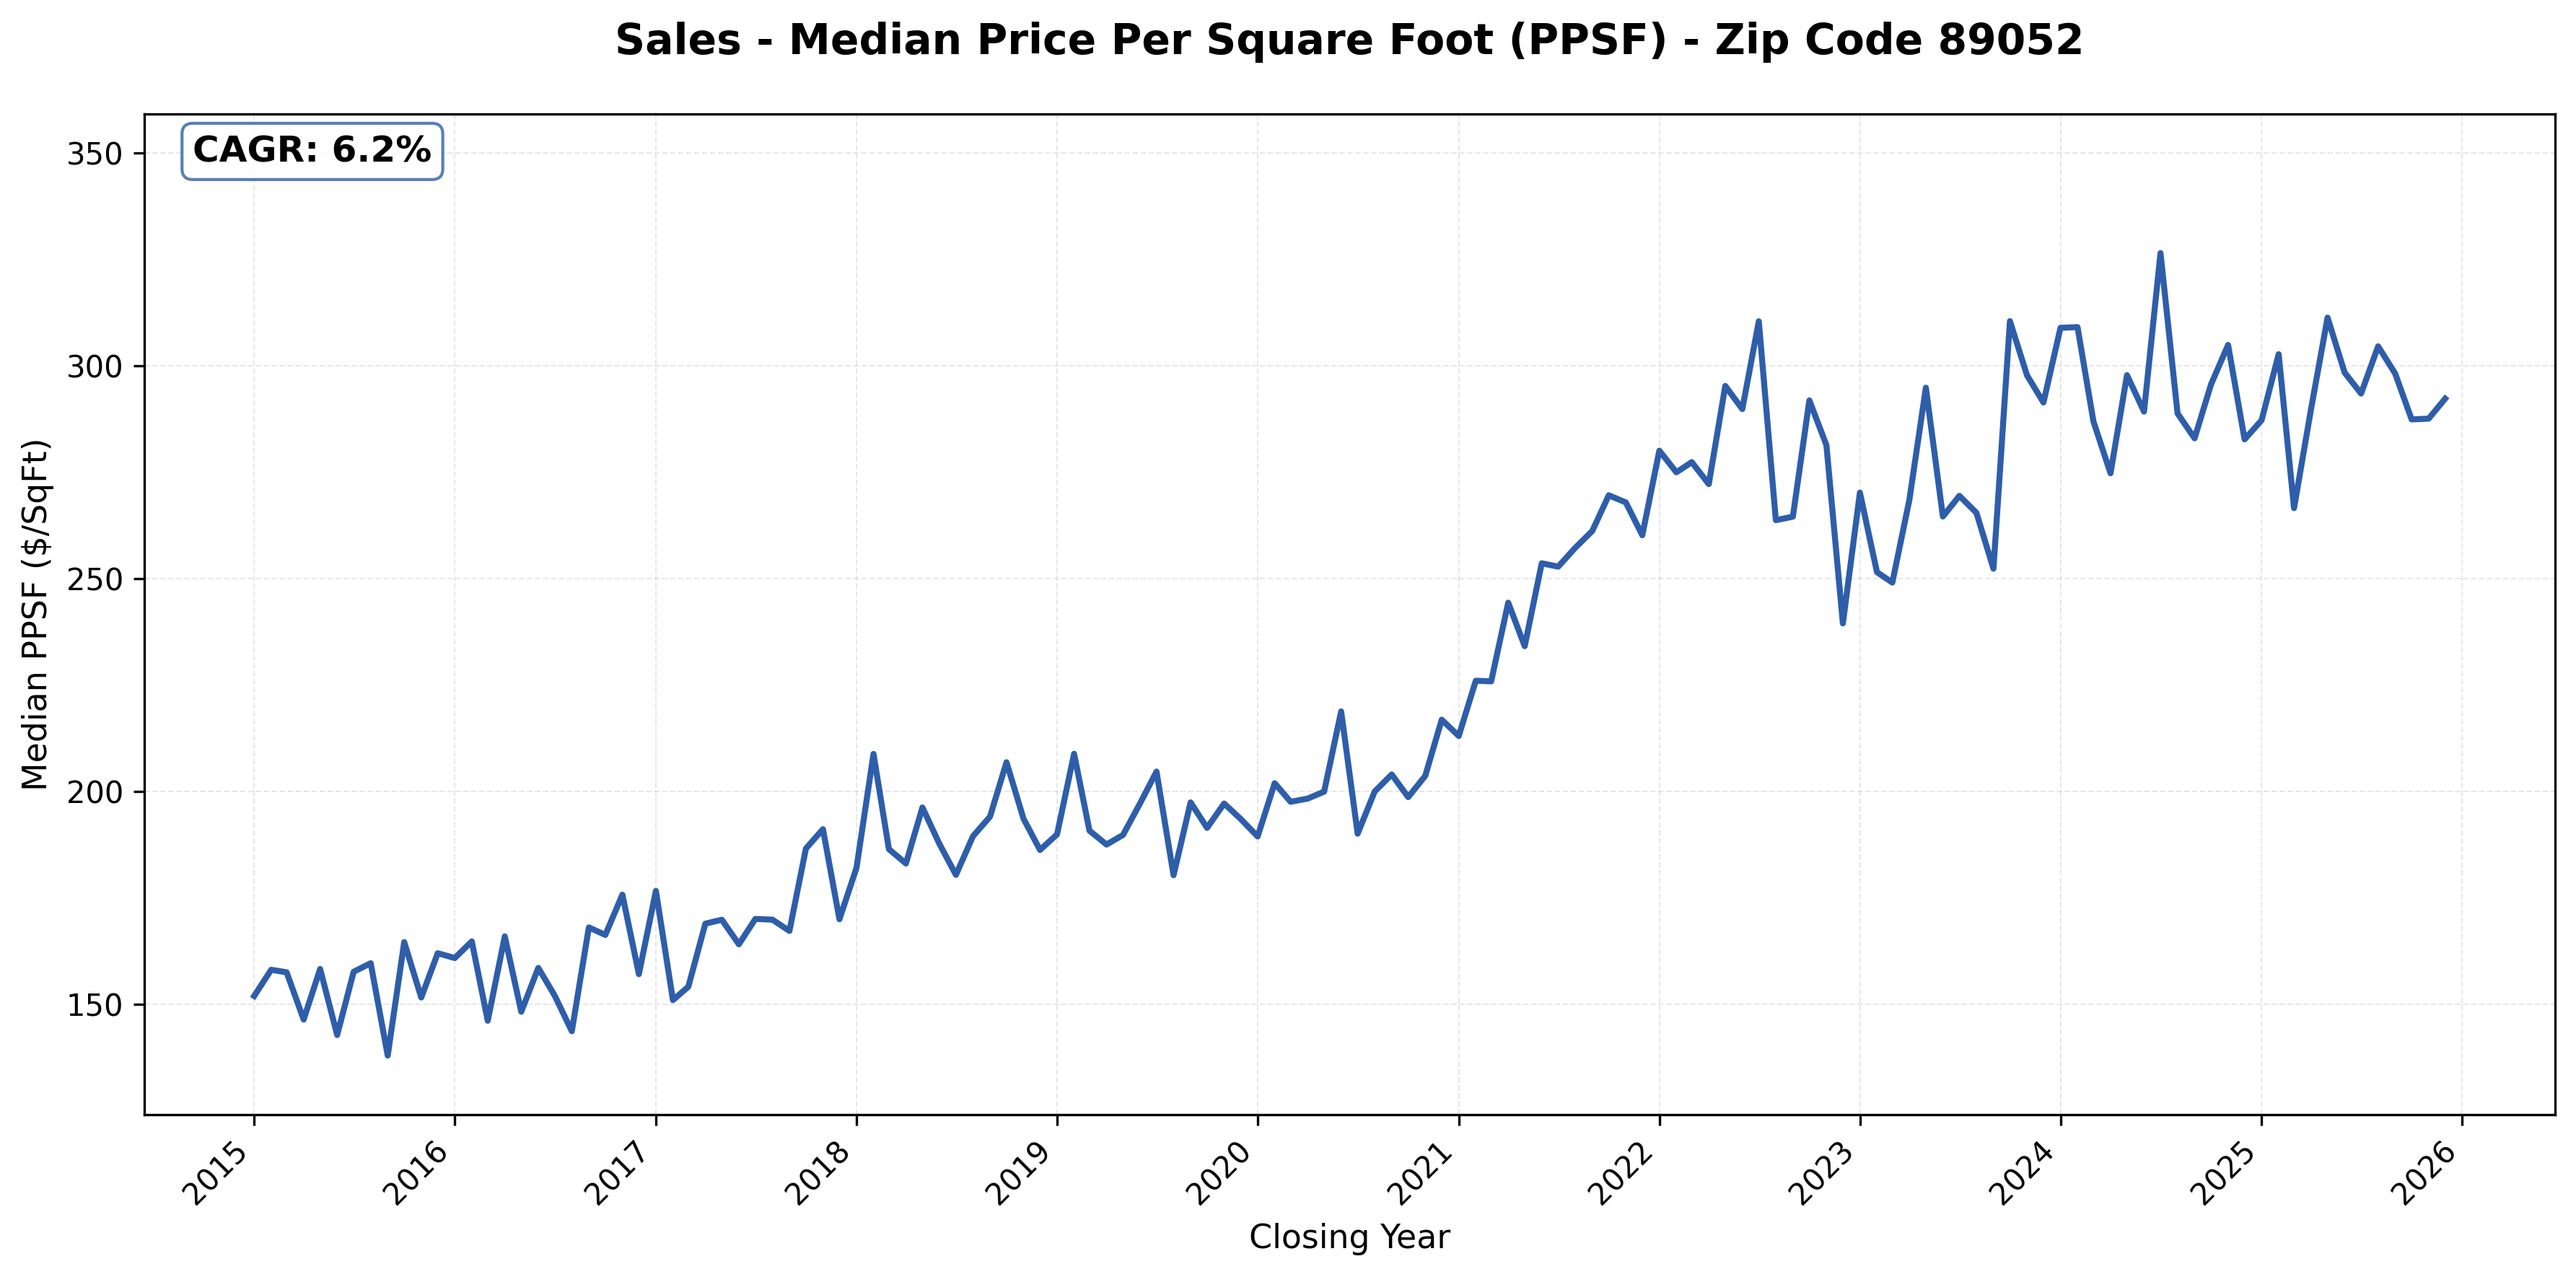
#26: 89052 (Green Valley Ranch, Anthem, Henderson), 6.2% CAGR
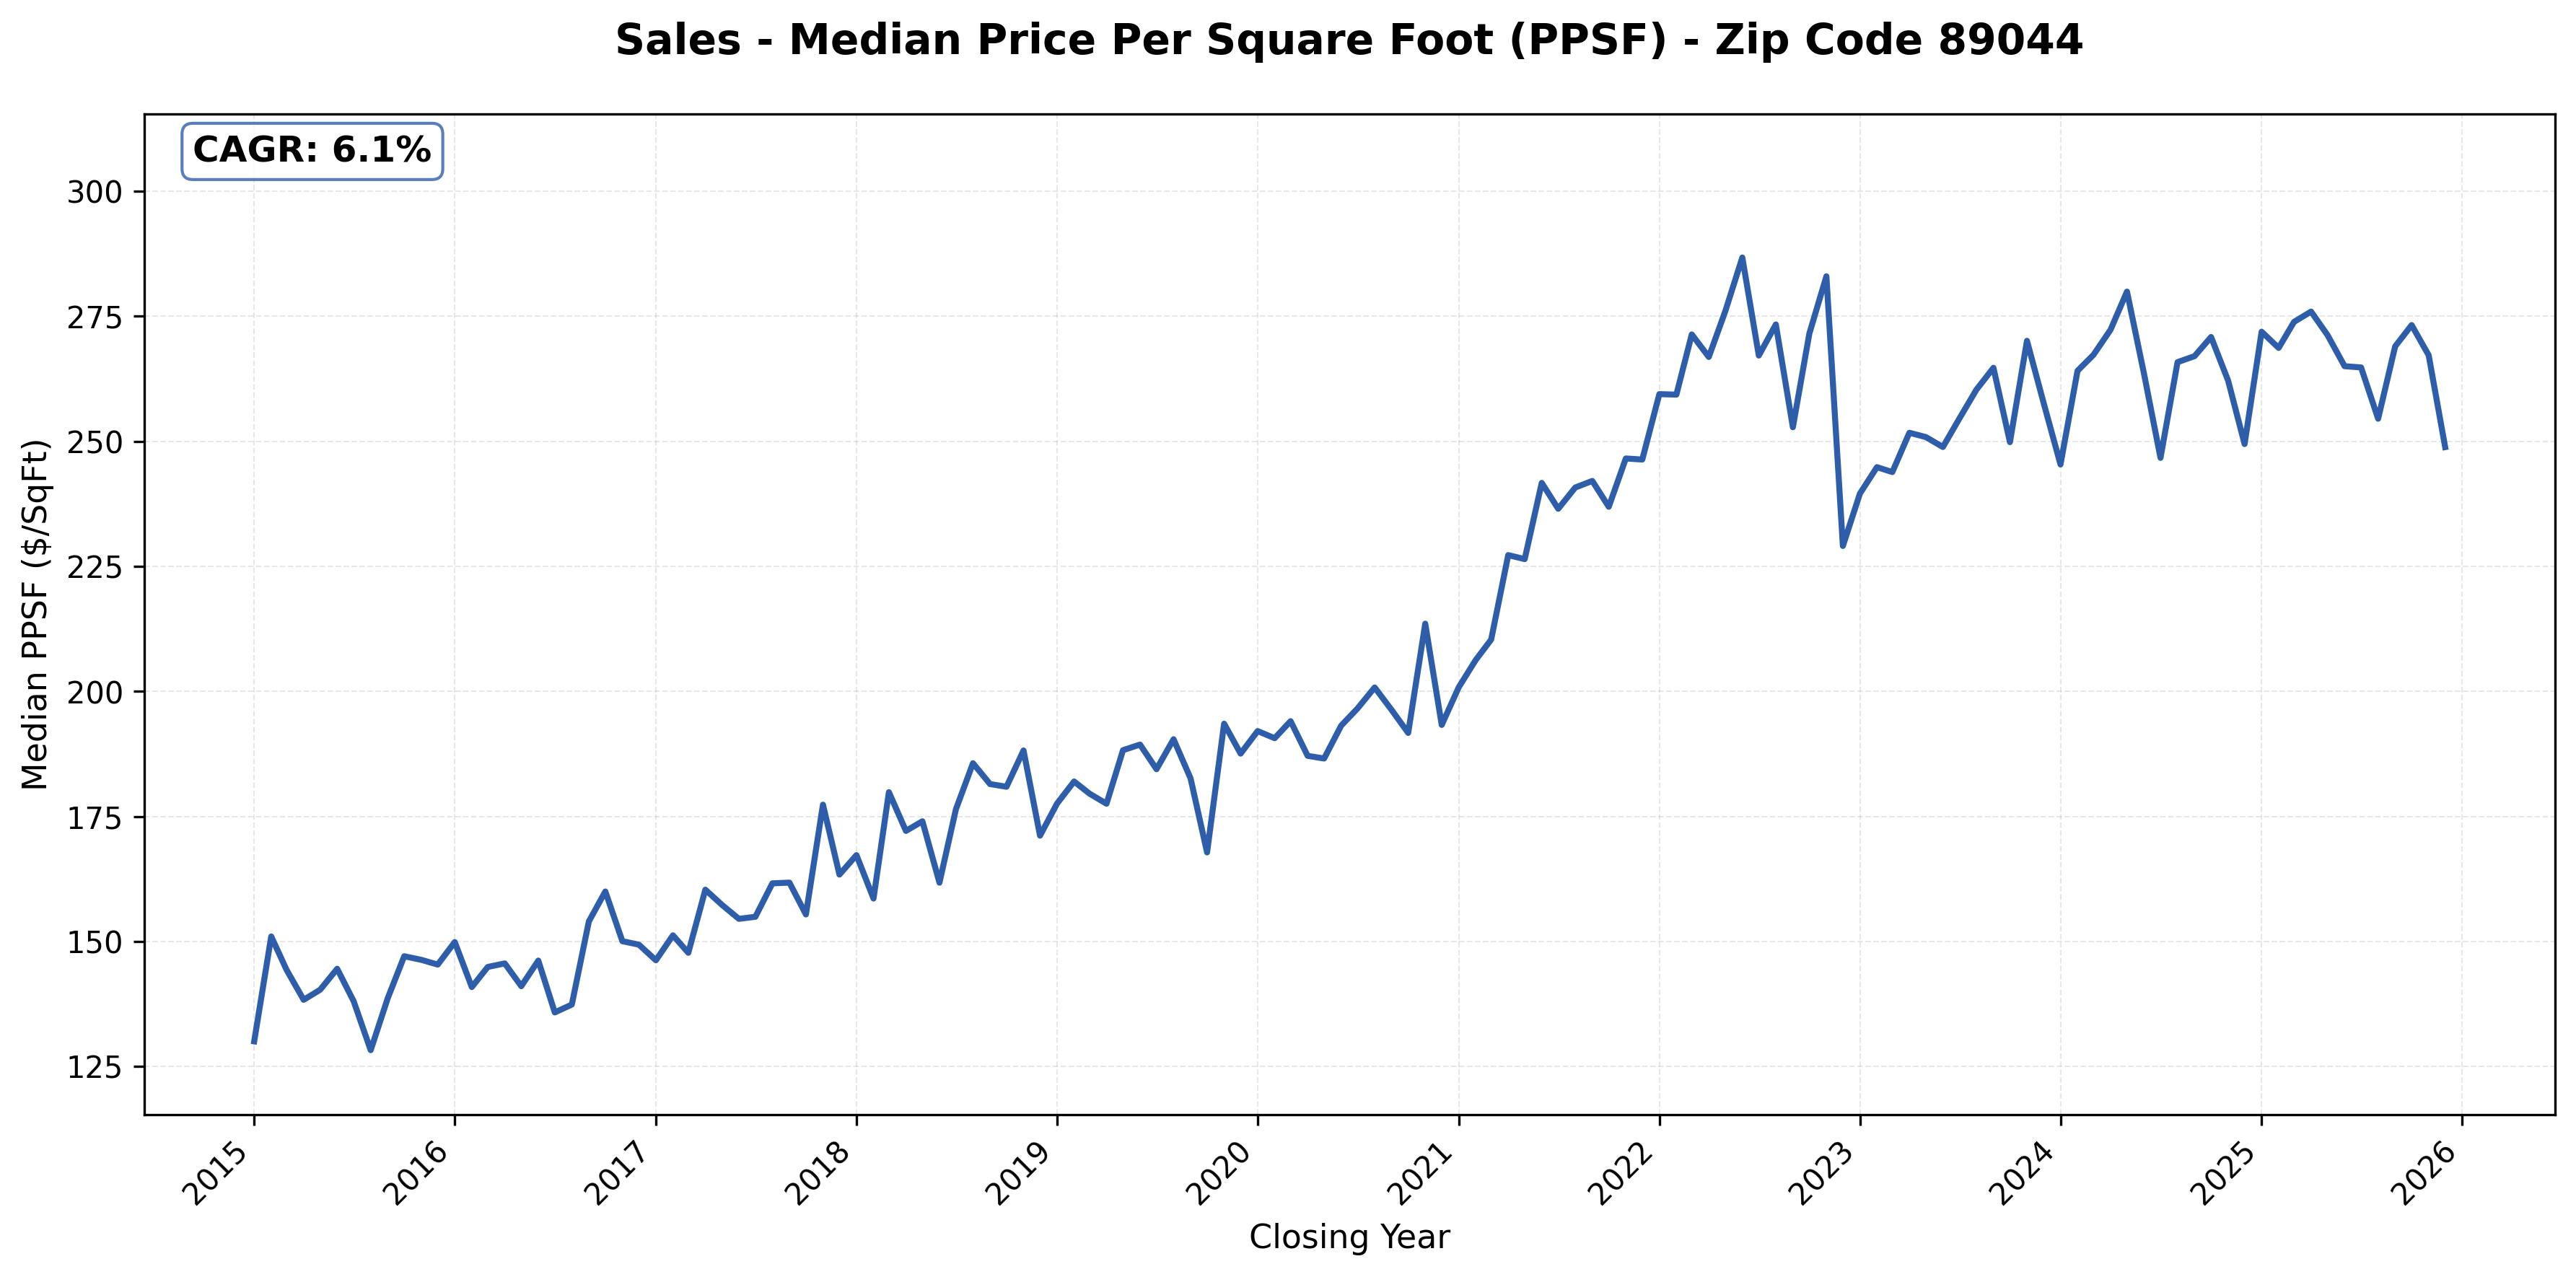
#27: 89044 (Southwest Henderson, Inspirada), 6.1% CAGR
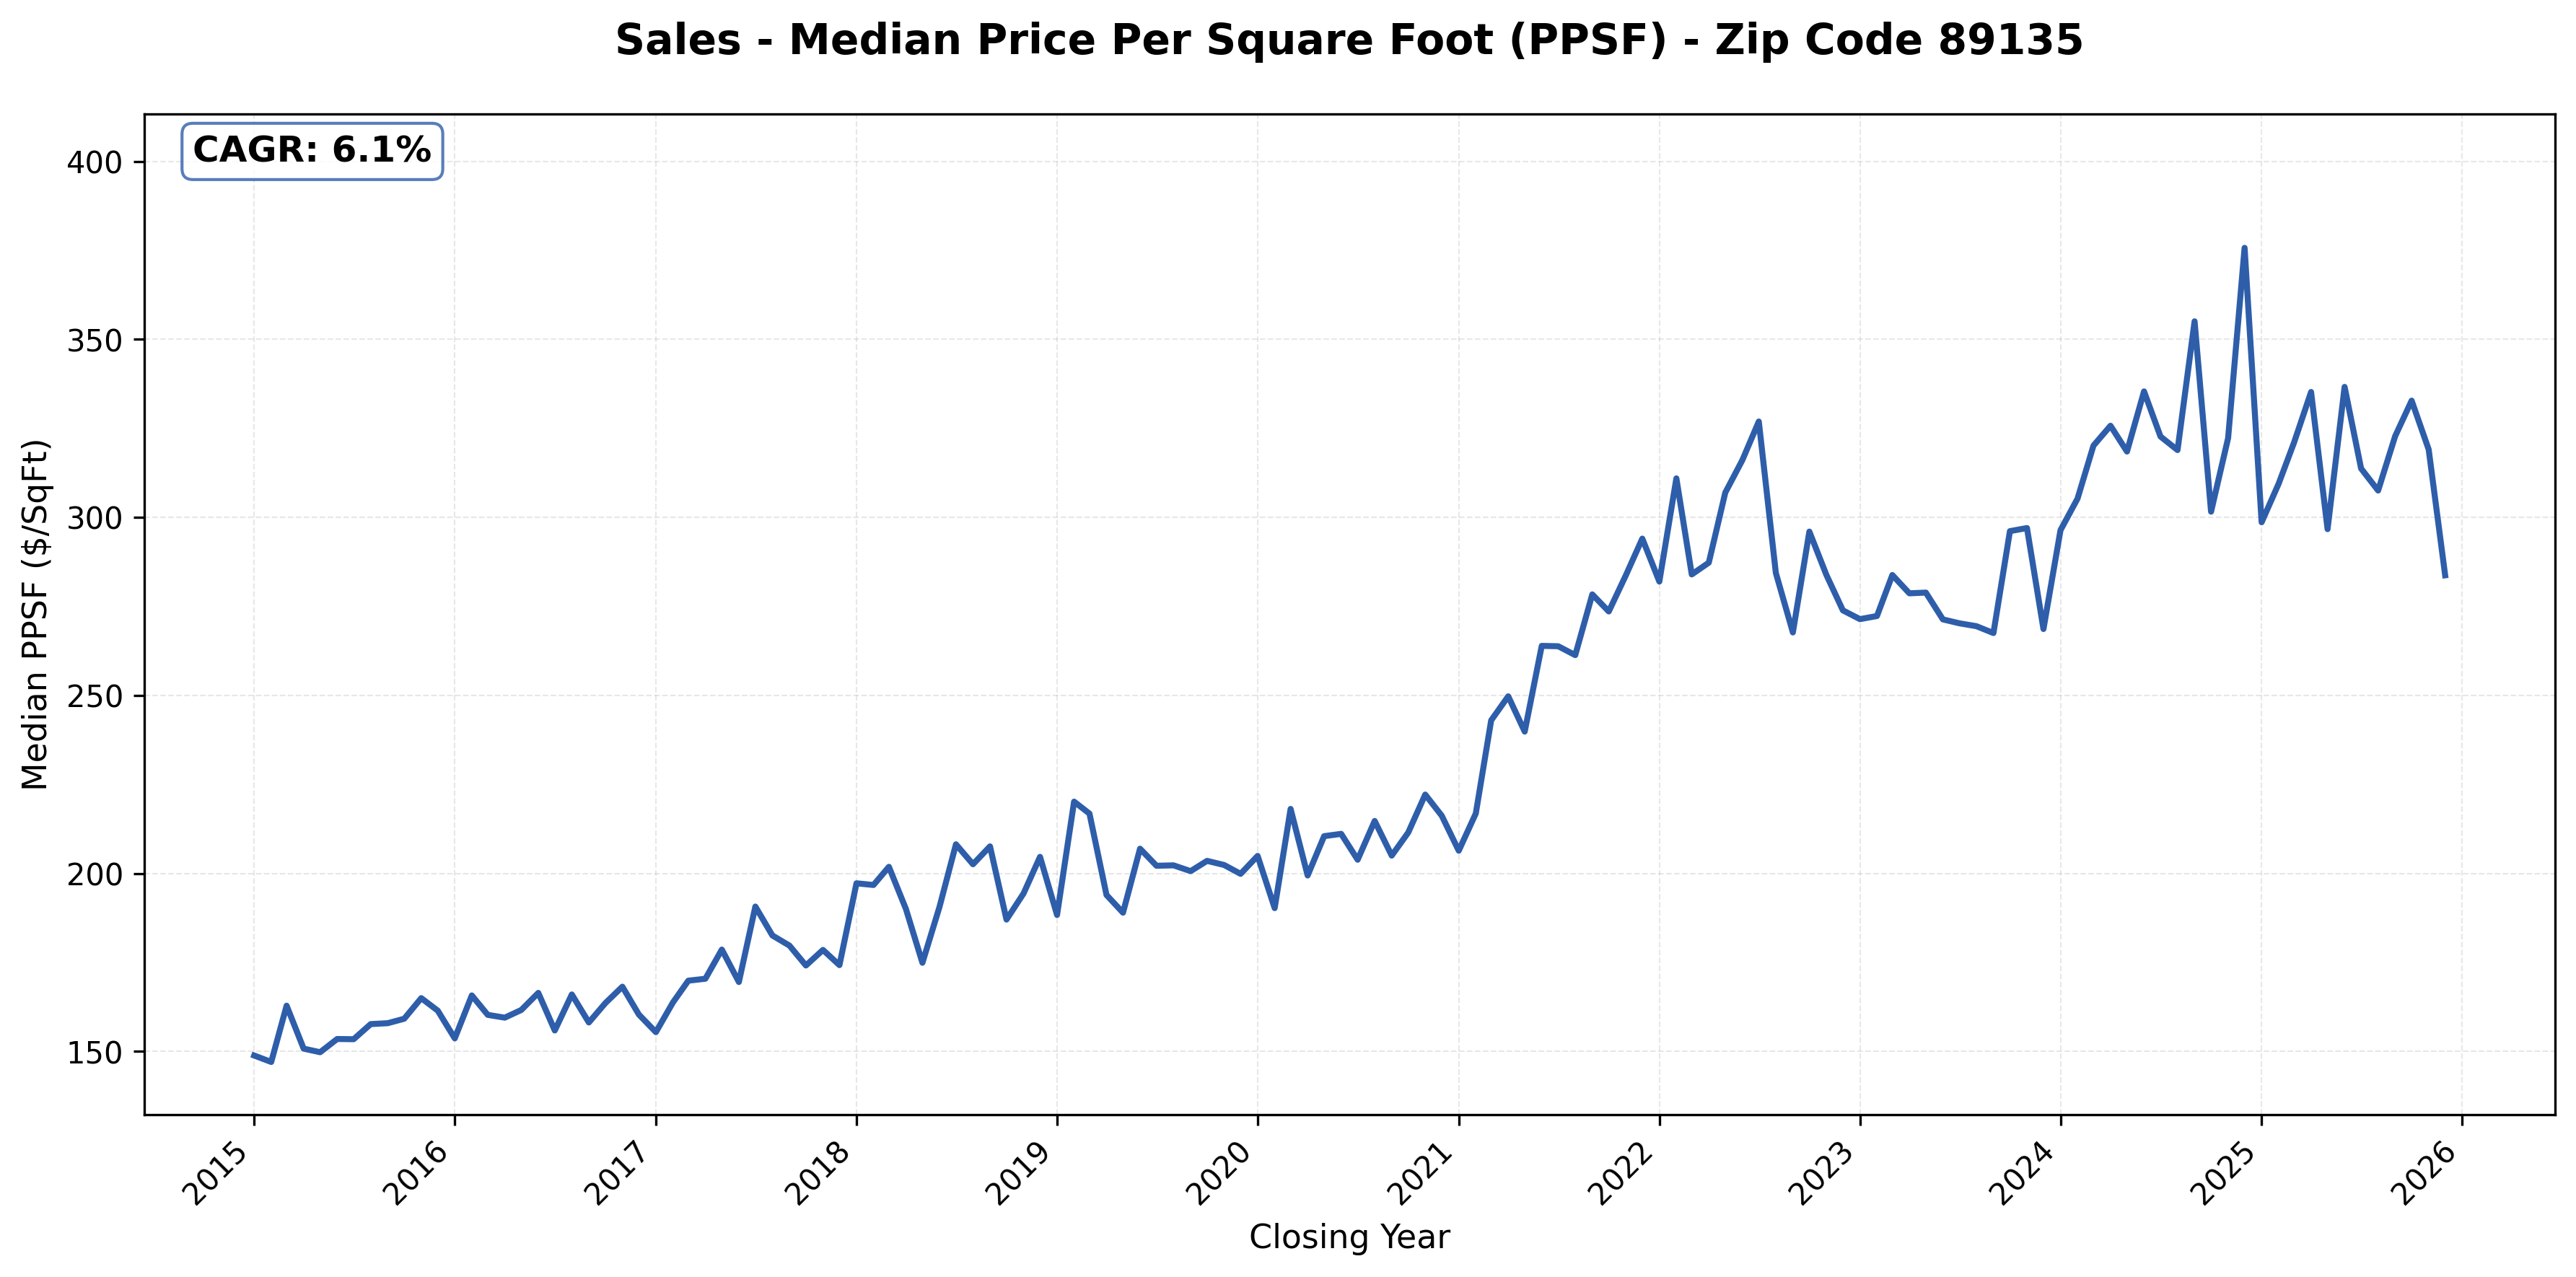
#28: 89135 (Summerlin), 6.1% CAGR
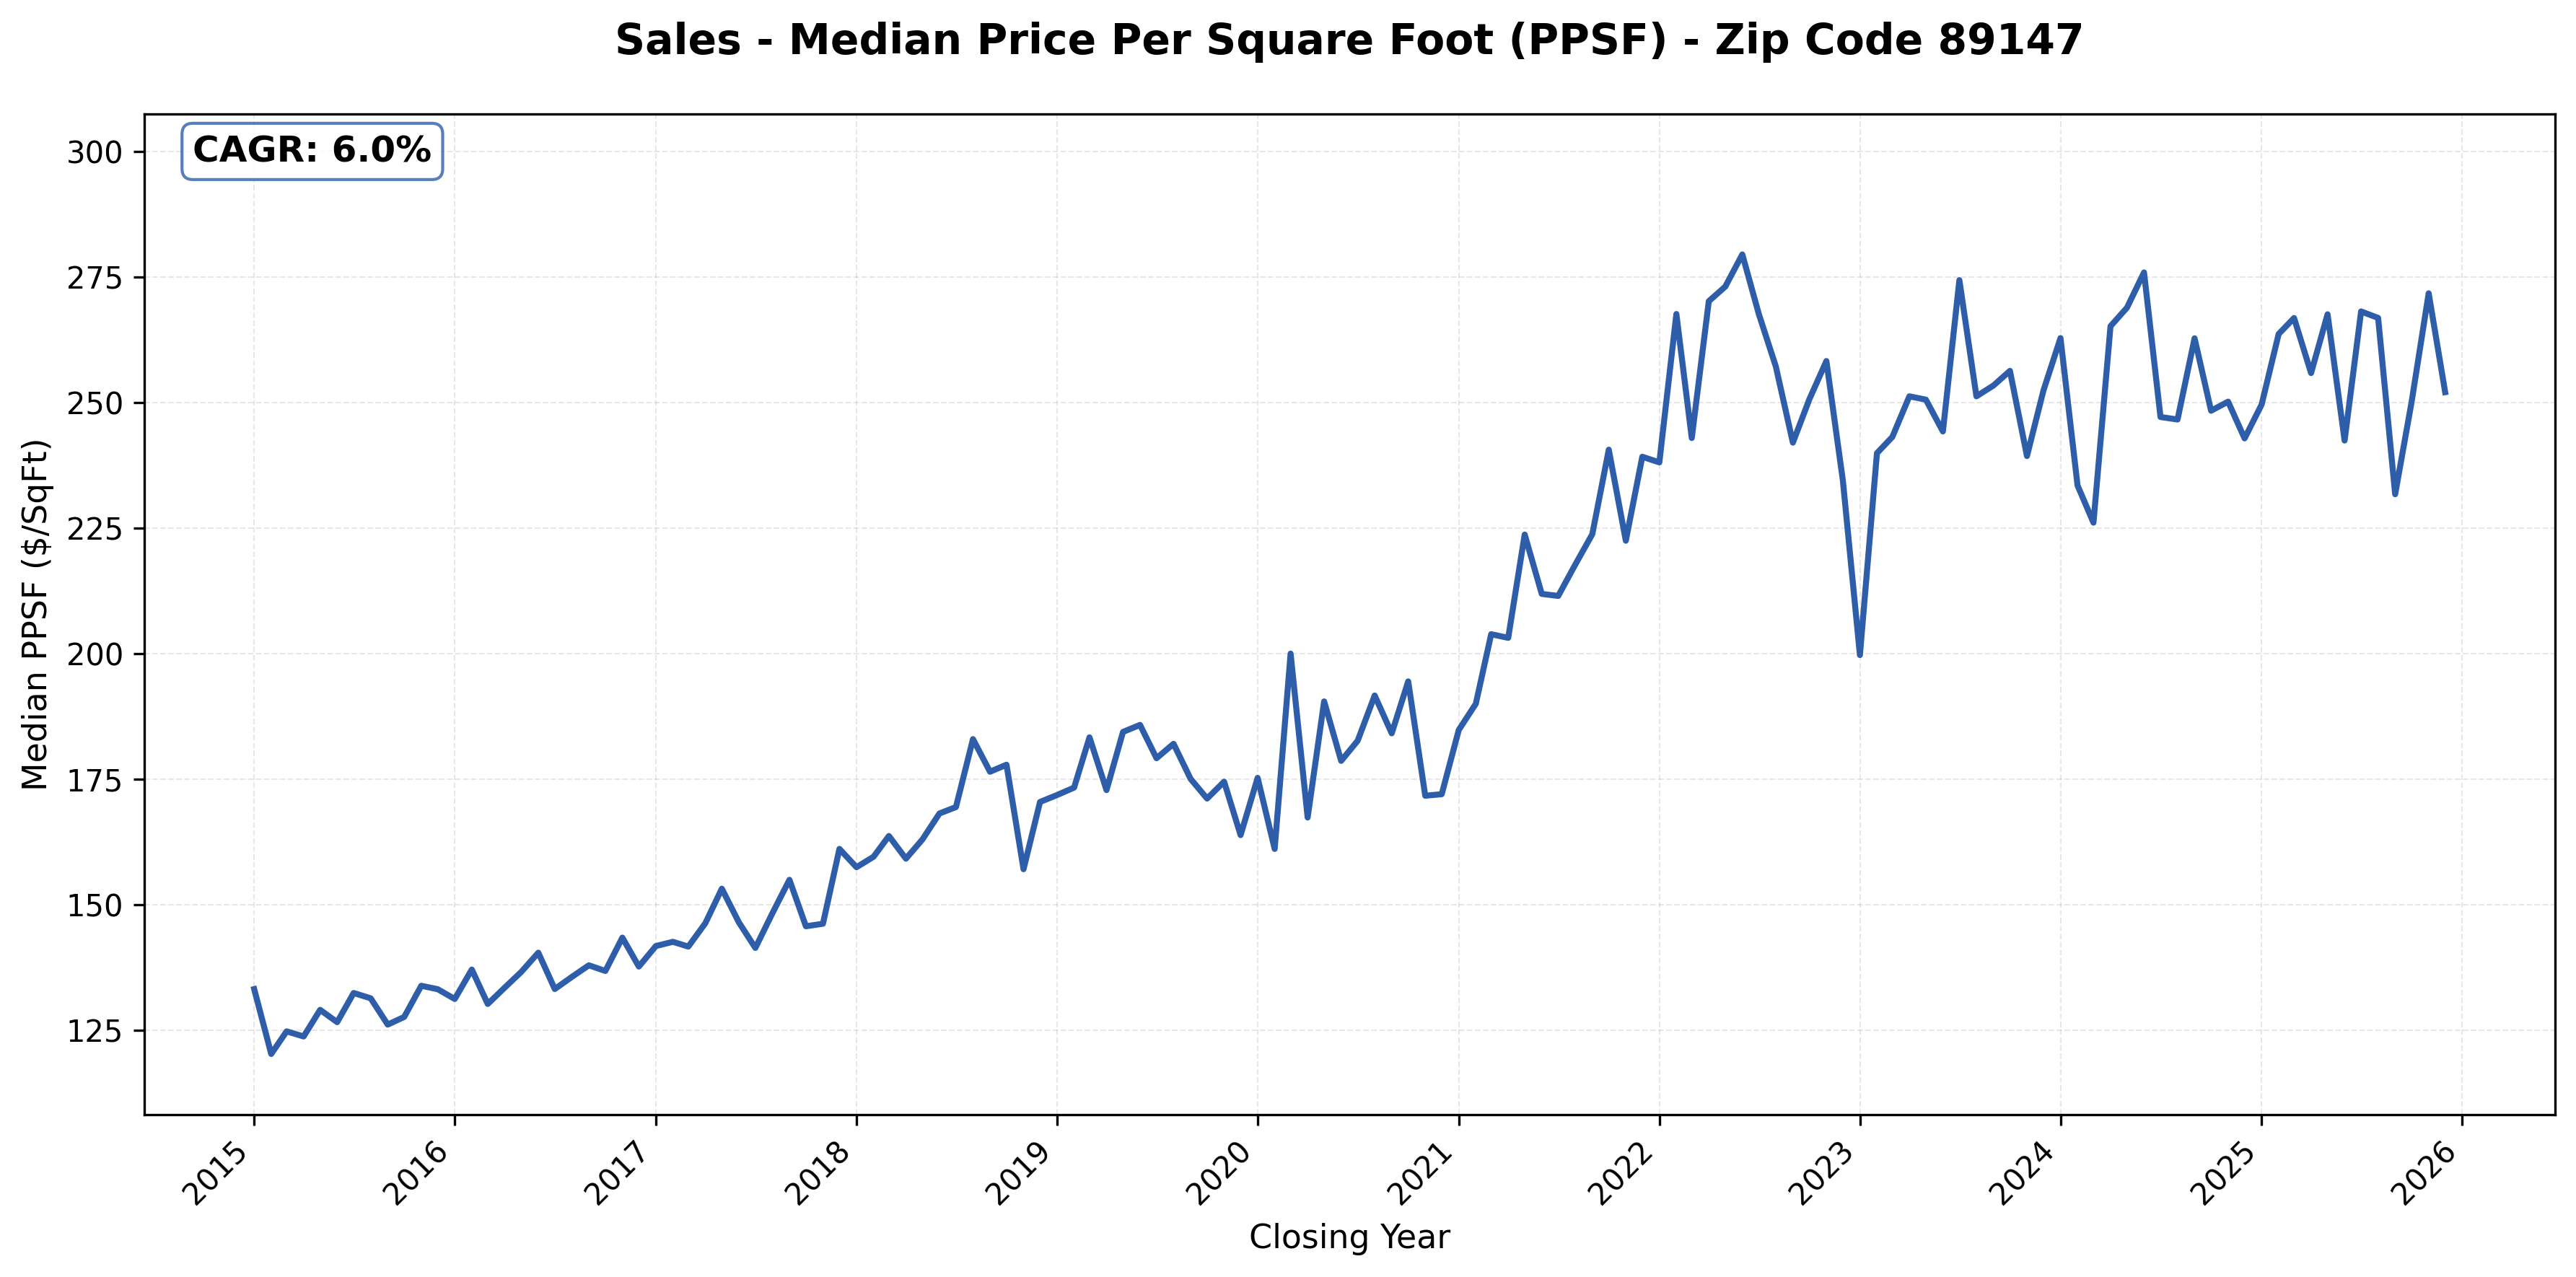
#29: 89147 (West, Summerlin adjacent), 6.0% CAGR
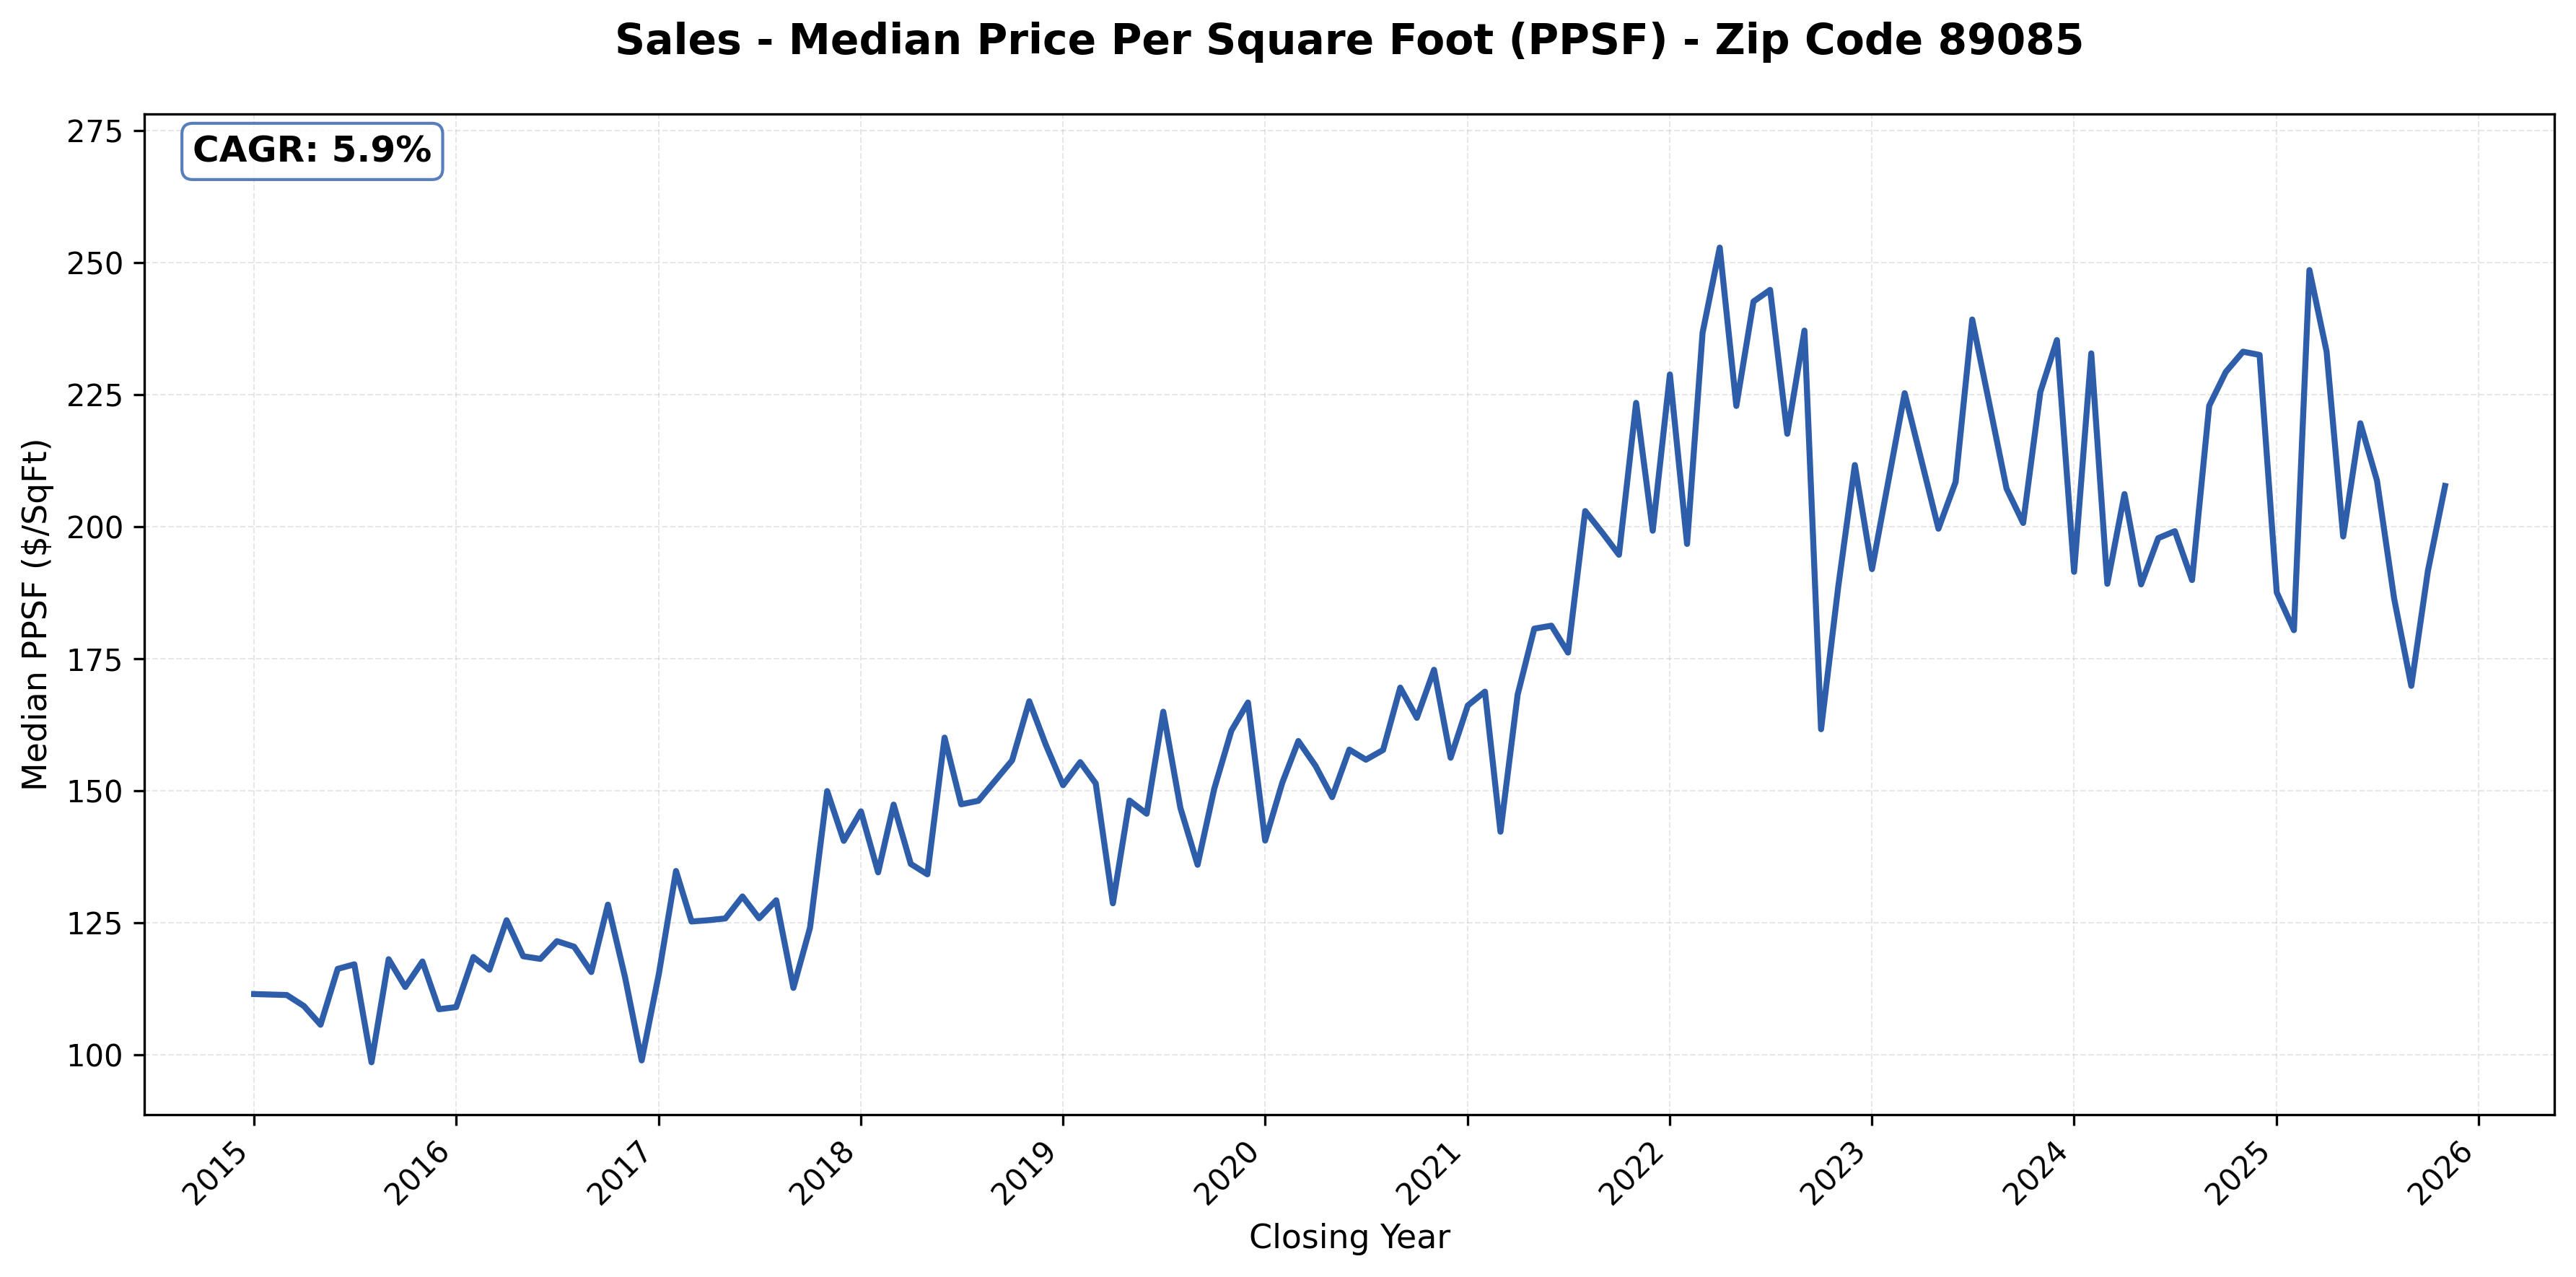
#30: 89085 (Aliante and adjacent), 5.9% CAGR
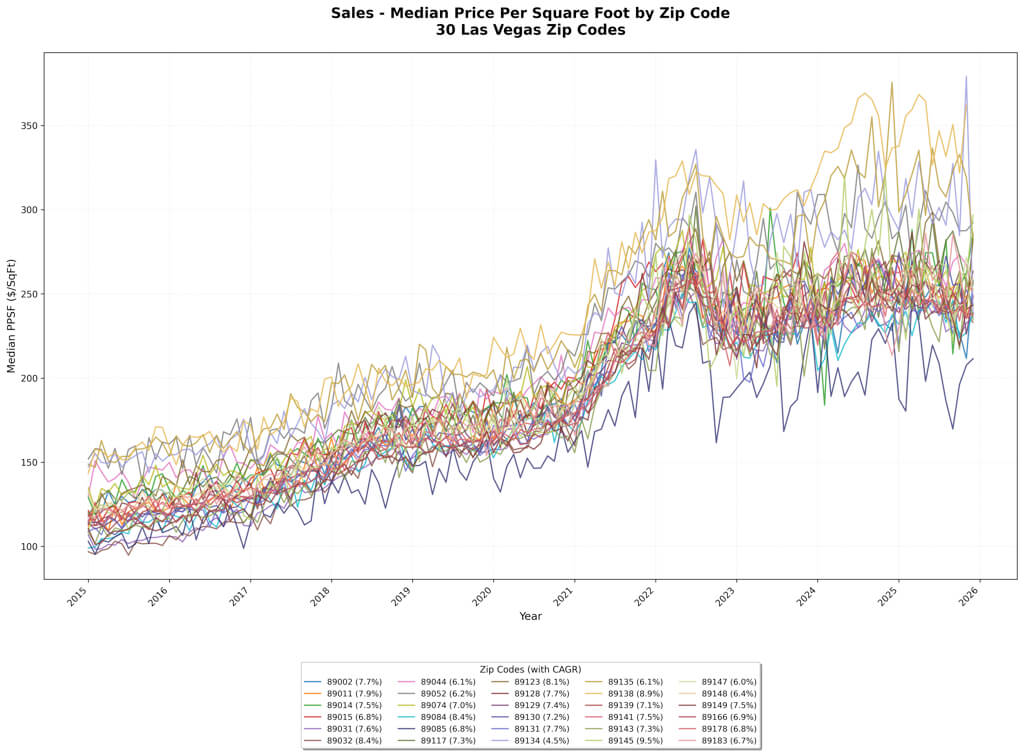
Combined Sales Market – All Zip Codes Comparison
Summary
-
-
As mentioned earlier, there is data noise in these charts. Also, individual properties within a zip code can perform better or worse than the median for that zip code. These charts do provide an overview of a zip code’s general performance trends.
-
Some zip codes appeared to perform superiorly both in rent growth and appreciation, such as 89123 (Silverado Ranch), 89143 (Centennial Hills), 89145 (West, Summerlin east adjacent), and 89002 (Black Mountain, Henderson). These data align with our anecdotal knowledge.
-
According to Germini, the approximate inflation rate from 2015-2025 was 3% CAGR. All zip codes studied have outpaced inflation, both in rent growth and appreciation, with some significantly outpacing it.
-
Get weekly insights like this and learn how professionals build income safely.