
People are often surprised that our clients’ properties have performed as well as they have. In short, our target properties have averaged 7% annual rent growth and 9% annual appreciation since 2015. Similarly, when I mention that during the 2008 financial crash, our clients experienced zero decrease in rent and no vacancies, I get dubious looks. So I took another look at the data my statements were based on.
Below is a section from our 2025 Investor Outlook (released in January 2025).
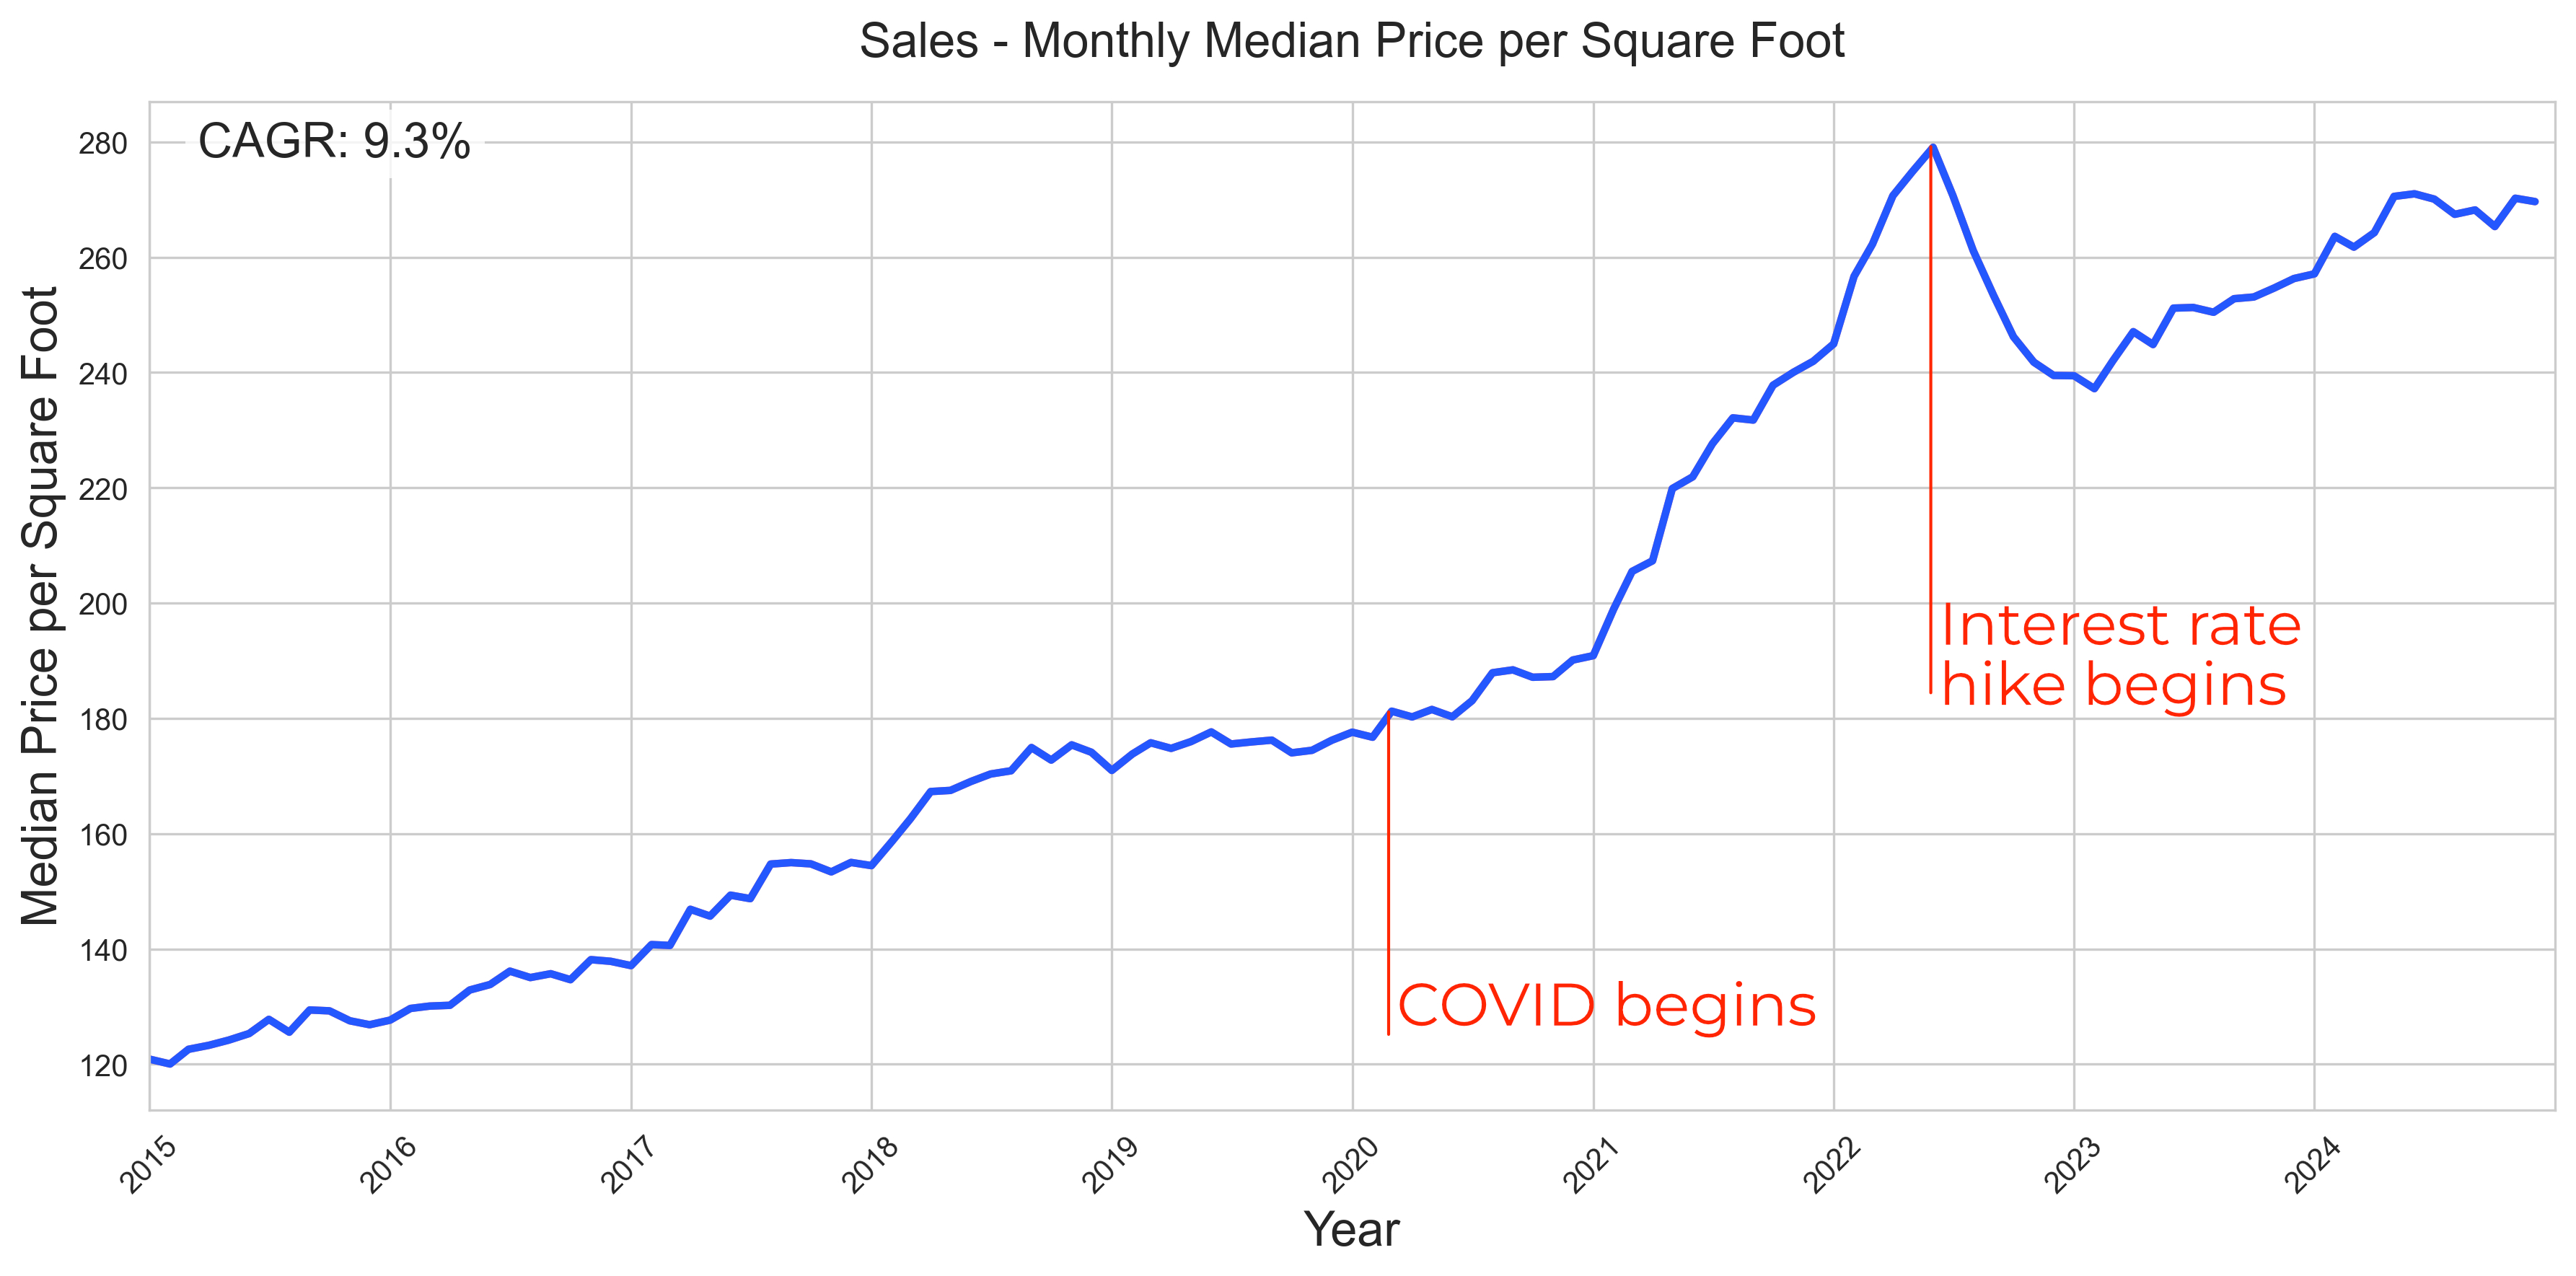
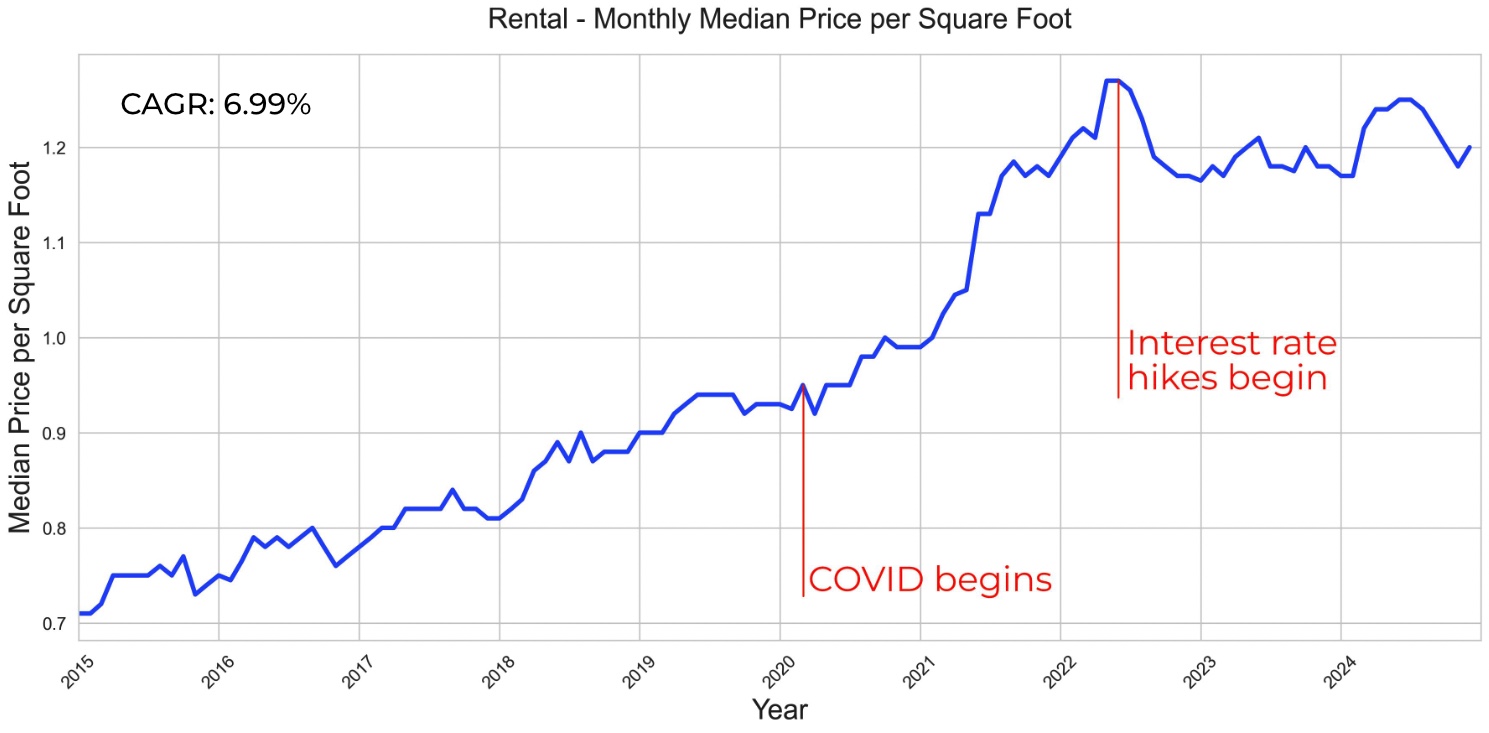
The following charts show the median price and rent per square foot for properties matching our target segment over the last 10 years, based on our analysis of MLS sales and rental data.
Appreciation:
[Source: Fernwood Real Estate Investment Group]
Rent growth:
[Source: Fernwood Real Estate Investment Group]
As mentioned in my 2024 Outlook, the COVID market frenzy and the subsequent dramatic rate hikes significantly distorted price and rent trends. To better project growth rates for the next 5 years, we should examine the pre-COVID period from 2015-01-01 to 2020-03-01. The charts below show the median price and rent per square foot during this more “stable” period.
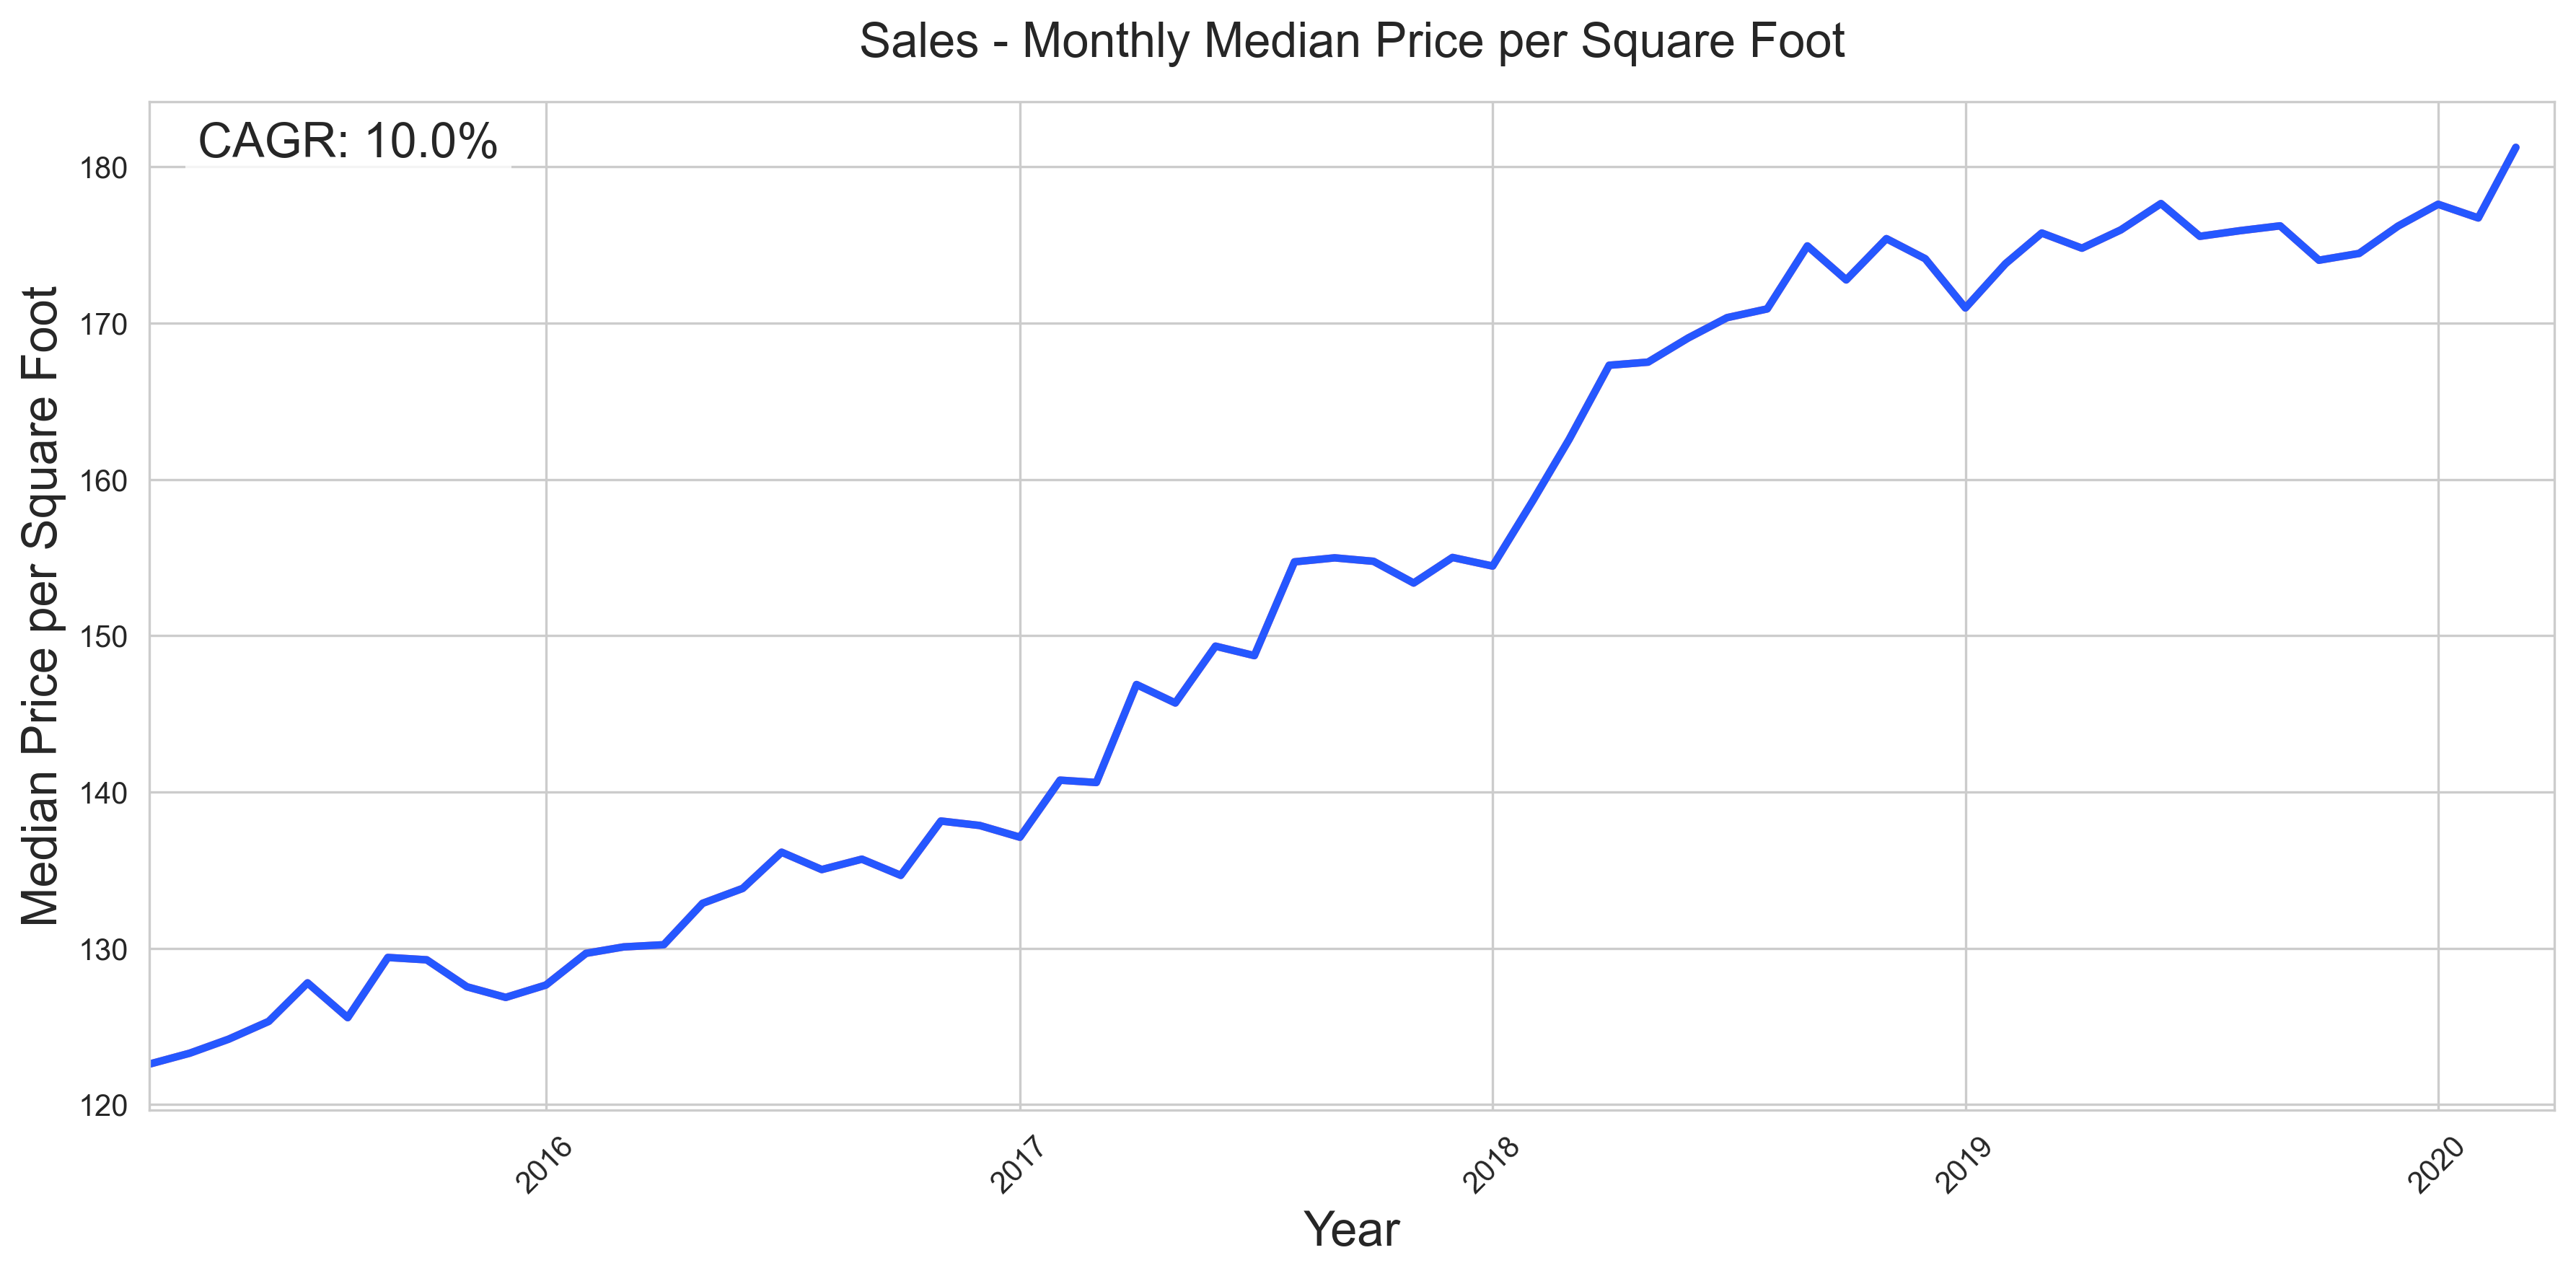
[Source: Fernwood Real Estate Investment Group]
Rent:
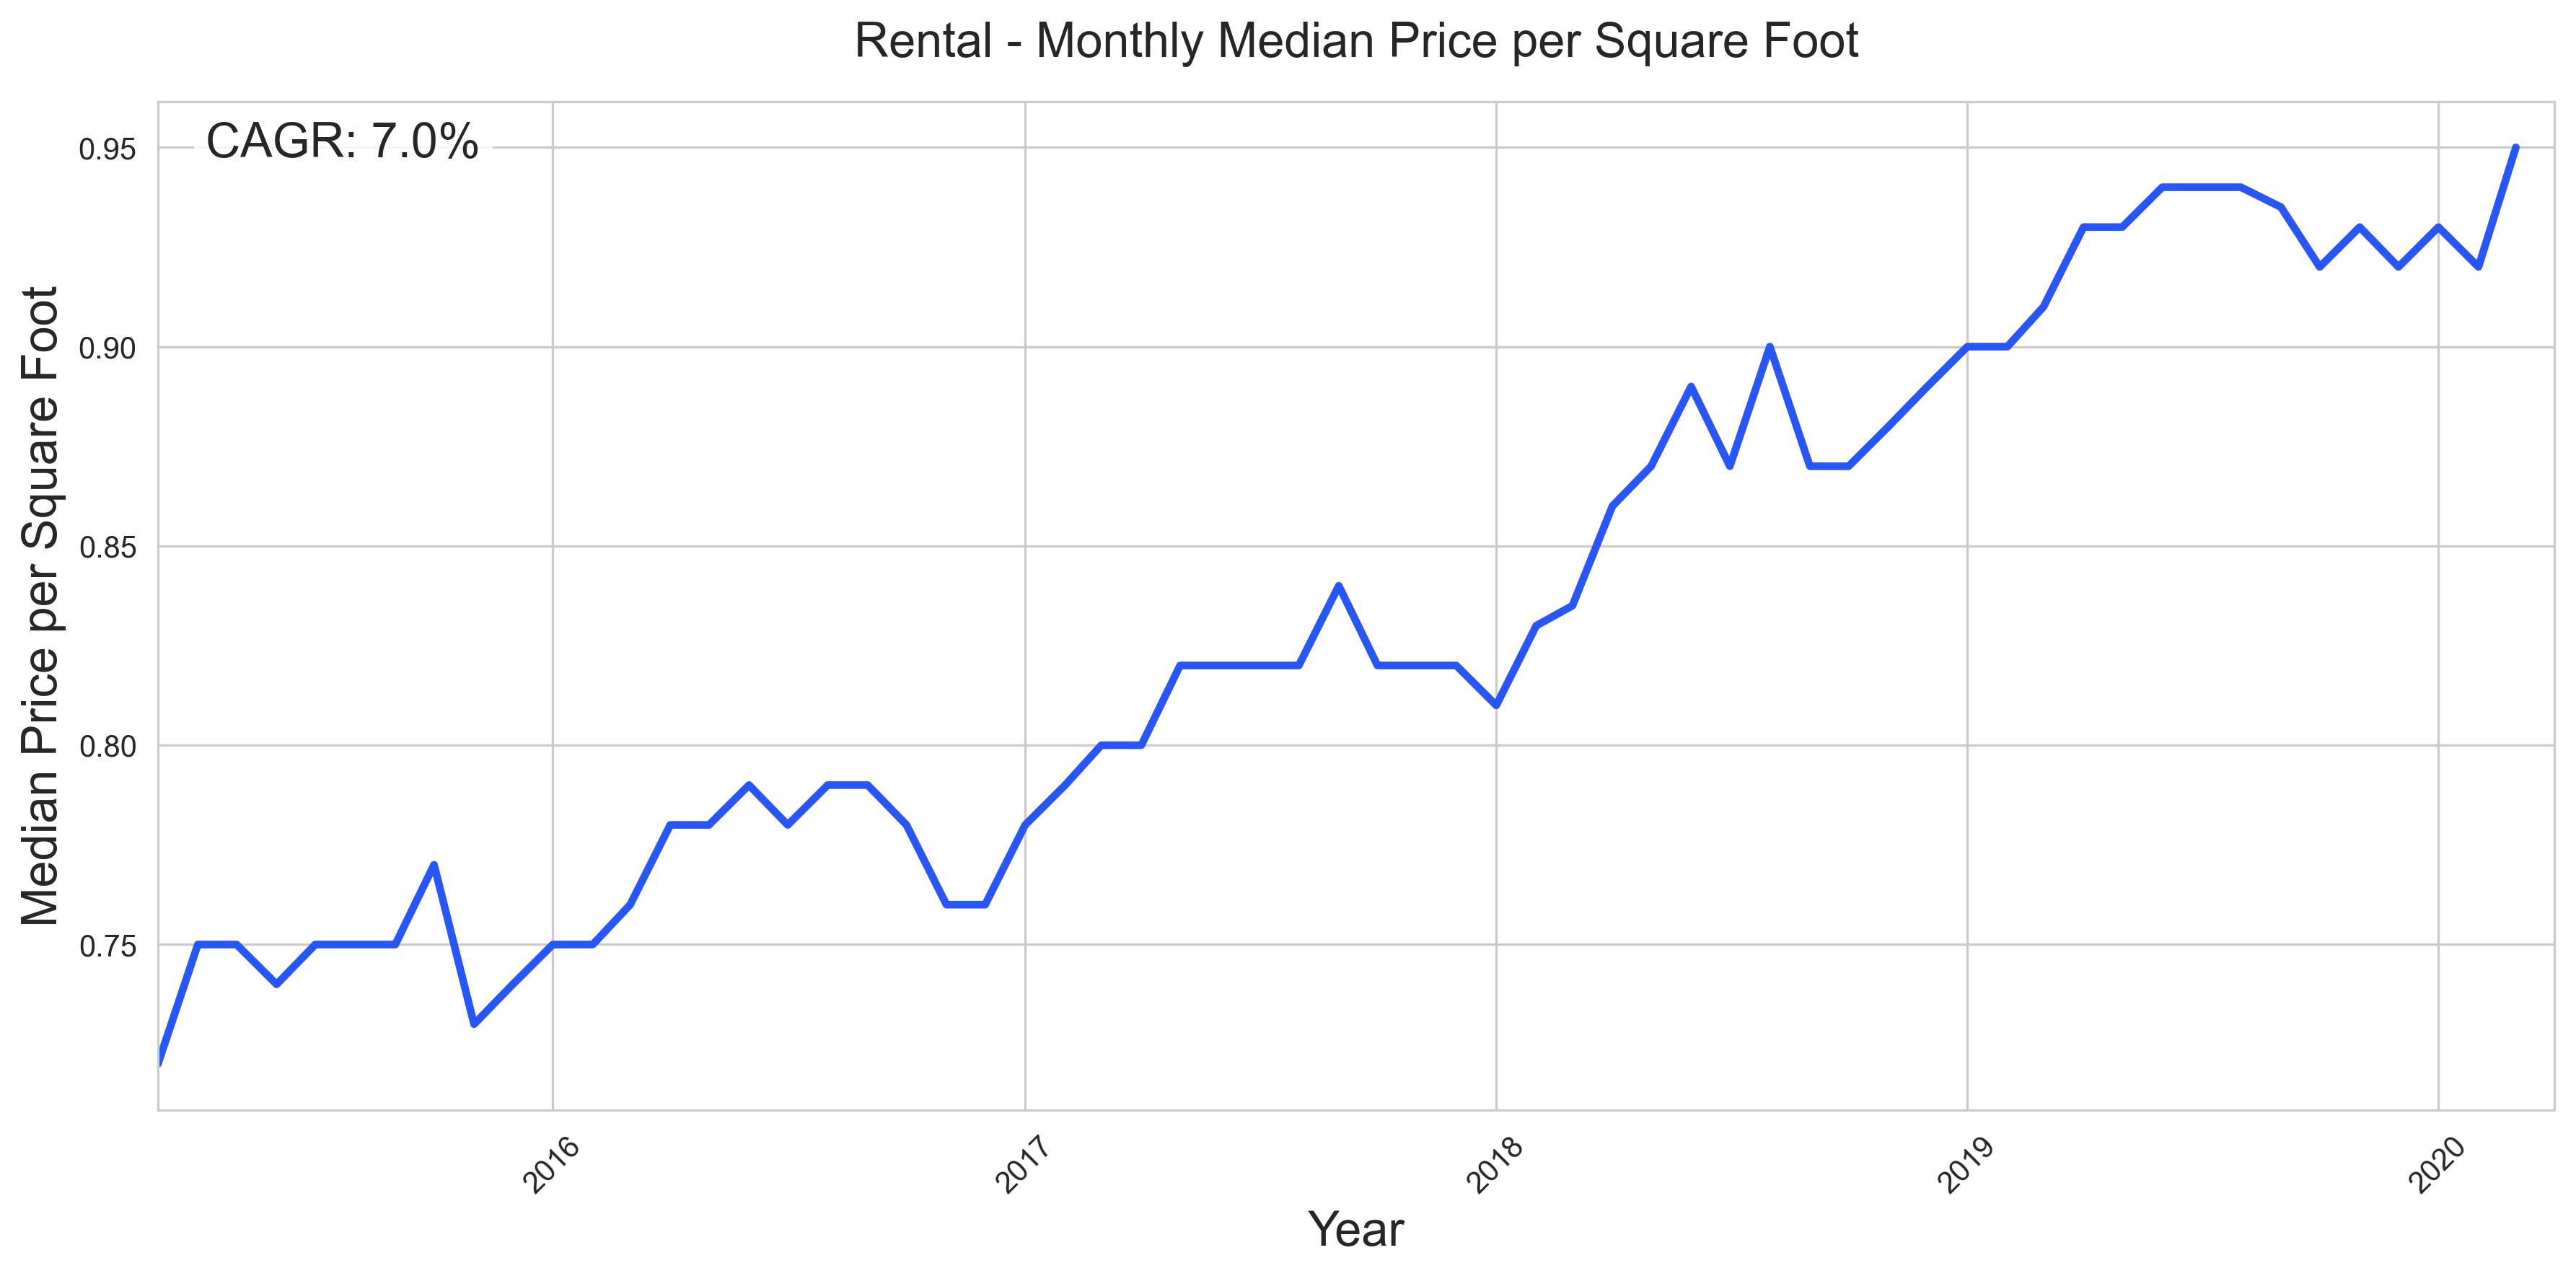
[Source: Fernwood Real Estate Investment Group]
Since the economic conditions today are similar (if not superior) to those in 2015, my expectations of the price and rent growth for the next 5 years align with the growth from 2015 to 2020. In other words, I expect the CAGR (Compounded Annual Growth Rate) for the prices for the next 5 years to be around 9-10% and the CAGR for the rents for the next 5 years around 7-8%
Of course, markets NEVER move linearly. Some years will see above-average growth, and others will see below-average growth.
Since 2025 appears to be a slower growth year (so far), perhaps I should modify my statement to say average 9% appreciation since 2015 to date, and 7% average rent growth. I follow what the data says.
Income Reliability
Below are charts from an article I wrote comparing how properties in the area marked in green on the map performed from 2008 through 2014.
Evaluation area:
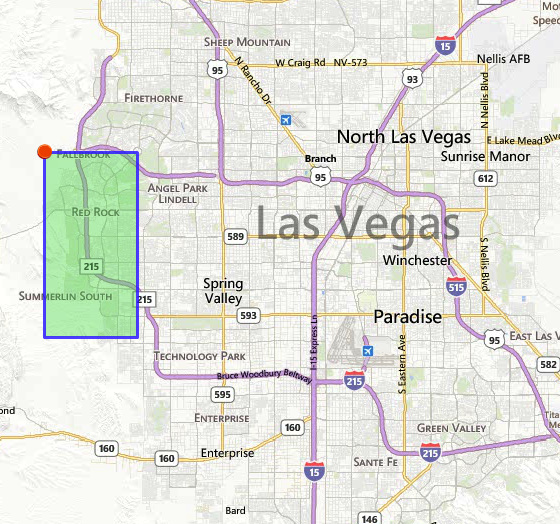
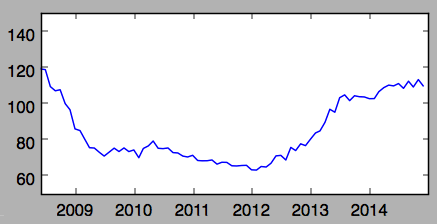
Below is a chart showing the monthly average $/SqFt sale price between 2008 and 2014 for the conforming properties in the selected area above. The data was also from the MLS.
As you can see, prices in the area plunged by over 40%.
Below is a chart showing $/SqFt rental rates for conforming properties in the same area for the same time period as the above.
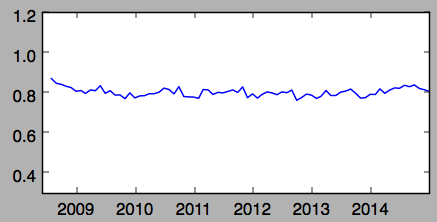
As the above shows, rental rates were virtually unaffected by the 2008 real estate market crash. So, if you purchased an investment property in late 2007, at peak price just before the crash, and the property was generating an 8% return in 2007, it would still be generating an 8% return, even if the market value of the property went down over 40%.
Conclusion
The properties we target have performed well, as the data shows.
- Income reliability: No decrease in rent and no vacancies during the 2008 financial crash. Almost no impact during COVID and the eviction moratorium.
- Rent growth averaged 7%/Yr since 2015
- Appreciation averaged 9%/Yr since 2015
- <2% vacancy rate
- 7 evictions in 17+ years with a tenant population greater than 1,000
Our target segment outperforms others due to Las Vegas’s unique qualities, our careful demographic research to identify the right tenant profile, and our partnership with a property manager skilled in selecting reliable tenants.
Join the newsletter. Subscribe to receive our latest post in email.