How many properties do you actually need to retire?
In This Report
- How Many Properties Do You Actually Need to Retire?
- Potential Investment Properties
- Market Trend
- About the Fernwood Real Estate Investment Group
How Many Properties Do You Actually Need to Retire?
To retire on your rental income, you must have enough income from your investment properties to cover your current living expenses. To calculate how many properties you need, divide your current living expenses by the cash flow of each rental property. For example, if your current expenses are $9,000 per month and each rental property generates $300 per month, you would need to acquire 30 properties ($9,000 / $300 = 30 properties)
However, this statement is only true when there is zero inflation, which is never the case; and when there is zero rent change. Here is an example of what I’m talking about.
Suppose you purchase 30 properties and they are in a location where rent increases by 2%/Yr (a very common rent growth rate) and inflation is 5%. In five years, ten years, and fifteen years, how much buying power will $9,000 have adjusted for inflation, compared to today?
- After 5 years: $9,000 x (1 + 2%)^5 / (1 + 5%)^5 ≈ $7,786 or 87% ($7,786 / $9,000)
- After 10 years: $9,000 x (1 + 2%)^10 / (1 + 5%)^10 ≈ $6,735 or 75% ($6,735 / $9,000)
- After 15 years: $9,000 x (1 + 2%)^15 / (1 + 5%)^15 ≈ $5,826 or 65% ($5,826 / $9,000)
So, if your rents do not keep pace with inflation, it is only a matter of time before you will have to get a job. Investing in locations where rents do not outpace inflation is not financial independence; it is simply taking an extended vacation.
There is a way of achieving lifelong financial independence with the 30 properties. But it depends on where you invest.
For example, suppose you buy properties in a city where rents rise on average 7%, and inflation is 5%. Your buying power after 5, 10, 15, and 20 years:
- After 5 years: $9,000 x (1 + 7%)^5 / (1 + 5%)^5 ≈ $9,890
- After 10 years: $9,000 x (1 + 7%)^10 / (1 + 5%)^10 ≈ $10,869
- After 15 years: $9,000 x (1 + 7%)^15 / (1 + 5%)^15 ≈ $11,944
- After 20 years: $9,000 x (1 + 7%)^20 / (1 + 5%)^20 = $13,126
Bottom line: If you invest in rental properties in a city where rent growth outpaces inflation, rents will increase faster than inflation. As a result, your buying power, adjusted for inflation, will actually increase over time.
The next question is how much capital is needed to purchase the 30 properties, or however many properties you need to retire.
The Power of Appreciation
Suppose you purchase 30 properties in a city with little or no appreciation, and each costs $200,000. Assuming a 25% down payment, how much after-tax savings do you need for the down payments?
- 30 Properties x ($200,000 x 25%)/Property = $1,500,000
Accumulating $1,500,000 in after-tax savings will be challenging for most. However, there is a way to grow your portfolio at only a fraction of the capital.
Suppose you buy in a city where appreciation is 7%. Properties in cities with rapid appreciation will cost more than cities with little appreciation; thus, I used $400,000 as the cost of each rental property. How much capital will you need for the first property if the down payment is 25%?
- $400,000 x 25% = $100,000
The amount you need for your next property depends on how long you let the equity grow. If you wait until you have enough equity that a 75% cash-out refinance can pay off your current mortgage and provide the down payment for your next property, you’ll need little additional capital to acquire additional properties. I will show you why.
The formula for future value:
- Future Value = Present Value x (1 + Annual Appreciation %)^Number of Years Into the Future
Below is the net investable capital after years 1 to 5.
- After year 1: $400,000 x (1 + 7%)^1 x 75% – $300,000 ≈ $21,000
- After year 2: $400,000 x (1 + 7%)^2 x 75% – $300,000 ≈ $43,470
- After year 3: $400,000 x (1 + 7%)^3 x 75% – $300,000 ≈ $67,513
- After year 4: $400,000 x (1 + 7%)^4 x 75% – $300,000 ≈ $93,239
- After year 5: $400,000 x (1 + 7%)^5 x 75% – $300,000 ≈ $120,766
So, after five years, you can use the net proceeds from a cash-out refinance for the down payment on your next property, without needing to draw from your savings. Below is a diagram showing the almost geometric progression of acquiring properties this way.
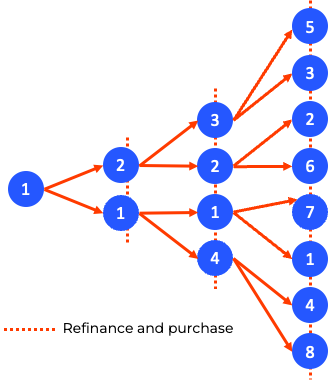
Using this strategy, you can expand your portfolio with minimal additional funds from your savings. This is the way many of our clients have grown their portfolios.
Takeaways
- If you buy in a city where rents do not outpace inflation, your inflation-adjusted income will decline every month, and your financial freedom will be short-lived.
- If you purchase property in a city where rents rise faster than inflation, the increasing rents will offset inflation.
- If you purchase properties in a market with low appreciation, all down payments and other expenses must come from your savings.
- If you buy in a high-appreciation market, you can use a cash-out refinance to acquire multiple properties with far less capital.
We’ve helped more than 180 clients on their path to financial freedom. Many have already made it. If you would like to discuss what we can do for you, please schedule a Zoom chat. I promise not to try to sell you anything.
As always, I welcome your comments.
…Eric
Eric@Fernwood.Team
702-358-8884
Potential Investment Properties
Below is a link to this month’s list of candidate investment properties. Our proprietary data mining software selected these candidate properties from thousands of available properties, and this is just the first step in our multi-step validation process, as shown below.

This Month’s List of Candidate Properties
Market Trend
Below are charts from our latest trailing 13-month market report, which includes September data. Remember that this data is only for our target property profile, not the entire metro area. To see all the charts, please click here.
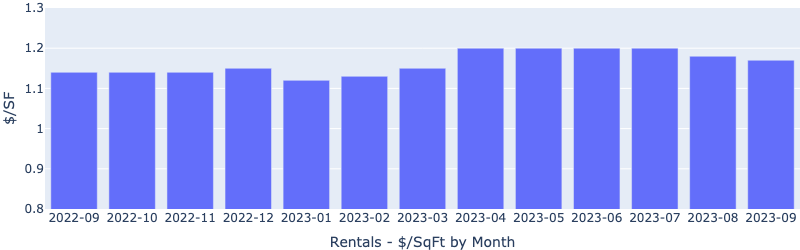
Rentals – Median $/SF by Month
YoY is up 2.6%, though rents dropped slightly in September compared to August, conforming to pre-Covid seasonal trends.
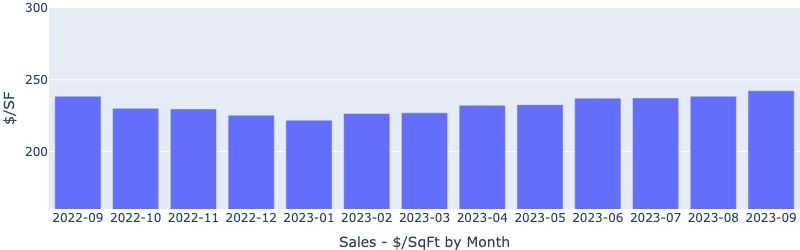
Sales – Median $/SF by Month
Despite increasing interest rates, $/SF is climbing up. YoY is now up 2%. YTD is up 9.5%.
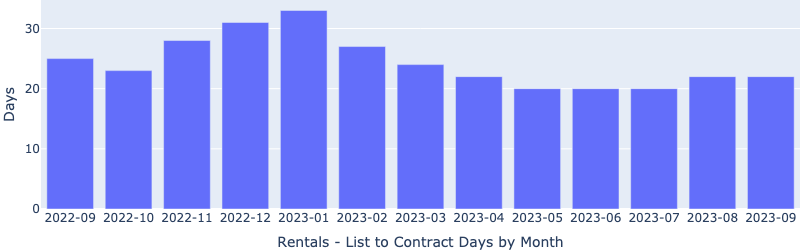
Rentals – List to Contract Days by Month
Median time to rent maintained at ~20 days, indicating steady demand.
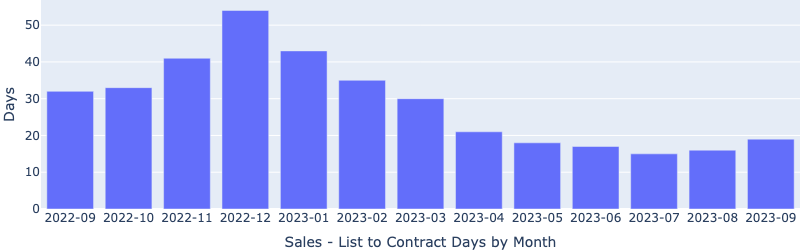
Sales – List to Contract Days by Month
Median days on the market increased slightly in September, conforming to seasonal trends.
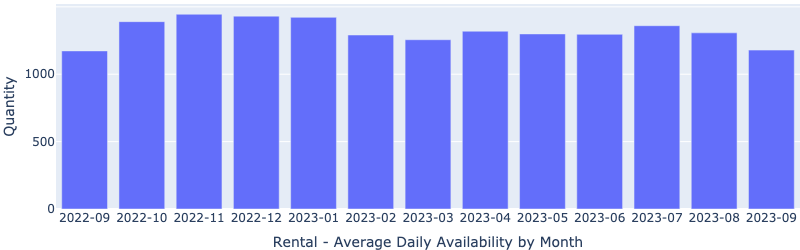
Rentals – Availability by Month
The number of homes for rent continued the downward trend.
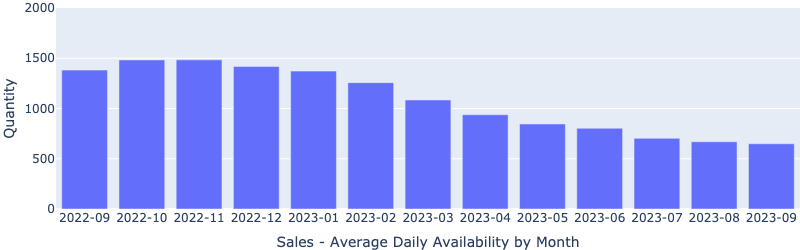
Sales – Availability by Month
This chart shows the average daily number of properties that were for sale in a particular month. The number of homes on the market continues to decrease.
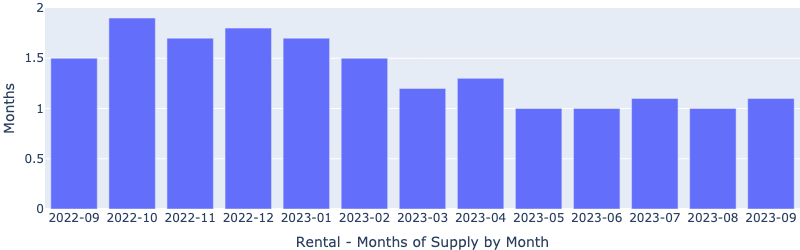
Rentals – Months of Supply
Only about 1 month of supply for our target rental property profile. Demand is greater than supply.
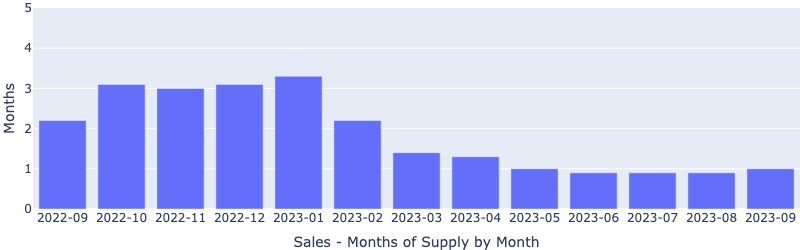
Sales – Months of Supply
Inventory is now at only 1 month. A 6 month supply is considered a balanced market. This will continue to pressure up the prices.
About the Fernwood Real Estate Investment Group
We Help Clients Acquire Highly Reliable Passive Income Streams
For the last 15+ years, we’ve helped clients build highly reliable, passive income streams through real estate that they will not outlive. Several are now retired and living entirely on their rental income. Most never invested in real estate before they started working with us, and most live in other states or countries. Below is a two-minute video of the services we provide.

Want to know what we can do for you?
© 2005-2022 Cleo Li and Eric Fernwood, all rights reserved.