
In This Report
- A message from your future self
- Potential Investment Properties
- Market Trend
- About the Fernwood Real Estate Investment Group
A Message From Your Future Self
What will you tell yourself in 5 years?
Is it “I wish I had …”
Or
“I’m so glad I did …”
We all prefer the latter one, obviously.
However, it is not always easy or obvious what we should do today in order to have the “I’m so glad I did …” response in five years.
I hope today’s post brings some clarity to your investment planning.
Times have changed
Merely 24 months ago, the mortgage rates were below 3%, and CDs paid next to nothing. It was a no-brainer to put your money into real estate as prices and rents soared and cash flow bountiful.
Now, mortgage rates are at 7.5%, and CDs pay 5%. Immediate cash flows are hard to come by. It seems to be a no-brainer to put your money in a CD (or HYSA or T-bills) to enjoy a risk-free 5% return, right?
Let’s look at an example.
Suppose you buy a $400,000 CD and a $400,000 rental property.
CD/HYSA/T-Bills
Assuming a 40% marginal tax rate:
- Year 1: $400,000 x 5% x (1 – 40%) + $400,000 ≈ $412,000
- Year 2: $412,000 x 5% x (1 – 40%) + $412,000 ≈ $424,360
- Year 3: $424,360 x 5% x (1 – 40%) + $424,360 ≈ $437,091
- Year 4: $437,091 x 5% x (1 – 40%) + $437,091 ≈ $450,204
- Year 5: $450,204 x 5% x (1 – 40%) + $450,204 ≈ $463,710
Total gain after taxes: $463,710 – $400,000 ≈ $63,710
Not bad. I think your future self in 5 years would not be disappointed with your choice today.
What if you put the $400,000 in a rental property instead?
Investment Property In An Appreciating Market
The YTD appreciation for our property segment is >9%. But I will assume a 5% appreciation rate to be conservative.
Your gain would be:
- Year 0: $400,000
- Year 1: $400,000 x (1 + 5%)^1 ≈ $420,000
- Year 2: $400,000 x (1 + 5%)^2 ≈ $441,000
- Year 3: $400,000 x (1 + 5%)^3 ≈ $463,050
- Year 4: $400,000 x (1 + 5%)^4 ≈ $486,203
- Year 5: $400,000 x (1 + 5%)^5 ≈ $510,513
Total gain: $510,513 – $400,000 ≈ $110,513
However, this represents only capital (equity) gain. You’ll also receive cash flow from the property. Let’s assume the cash flow from the property is 4.5% after all recurring expenses—a common, conservative starting figure for a cash purchase. To be conservative, I’ll assume there is a 3 %/Yr rent growth. However, appreciation and rent growth are both driven by population growth.
- Year 0: $400,000 x 4.5% ≈ $18,000
- Year 1: $18,000 x (1 + 3%)^1 ≈ $18,540
- Year 2: $18,000 x (1 + 3%)^2 ≈ $19,096
- Year 3: $18,000 x (1 + 3%)^3 ≈ $19,669
- Year 4: $18,000 x (1 + 3%)^4 ≈ $20,259
- Year 5: $18,000 x (1 + 3%)^5 ≈ $20,867
Total cash flow in 5 years: $116,431
The tax savings will probably shield the cash flow from taxes. Therefore, it will essentially be tax-free. So, the five-year gain from the property, including equity gain and cash flow:
$110,513 + $116,431 ≈ $226,944
Now, that would be an outcome that your future self in 5 years will tell you, “I’m so glad you did…”!
Obviously, not any real estate will achieve this kind of result. Only real estate in an appreciating market that targets reliable tenants (such as our target property segment) can do so.
What Happens If You Wait?
What will happen if you wait until rates fall?
Again, let’s assume that property prices increase by 5% each year, and the property costs $400,000. After five years, interest rates fall to 5% (in reality, no one knows when rates will fall. Based on the current economic and inflation dynamics, it could be much longer than five years before rates will be 5% again). What is the cost of waiting?
Below is the market value by year due to the 5% appreciation:
- Year 0: $400,000
- Year 1: $400,000 x (1 + 5%)^1 ≈ $420,000
- Year 2: $400,000 x (1 + 5%)^2 ≈ $441,000
- Year 3: $400,000 x (1 + 5%)^3 ≈ $463,050
- Year 4: $400,000 x (1 + 5%)^4 ≈ $486,203
- Year 5: $400,000 x (1 + 5%)^5 ≈ $510,513
In five years, even if rates fall to 5%, the cost of purchasing the same property will be higher due to increased prices, as shown below.
Buy today:
- Purchase price: $400,000
- Down payment: 30% x $400,000 = $120,000
- Interest rate: 7.50%
- Debt service: $1,958
Buy in 5 Years:
- Purchase price: $510,513
- Down payment: 30% x $510,513 ≈ $153,154
- Interest rate: 5.0%
- Debt service: $1,918
The cost difference between today and +5 years.
- Purchase price: +$110,513
- Down Payment: +$33,154
- Debt service: -$39
So, I see no advantage to waiting.
Date the Rates, Marry the Property
What if you purchased today and refinanced in 5 years when rates are 5%?
Buy today:
- Purchase price: $400,000
- Down payment: 30% x $400,000 = $120,000
- Interest rate: 7.50%
- Debt service: $1,958
Refinance in 5 years at 5%:
- Market value: $510,513
- Refinance amount: $280,000 (assuming no principal paydown to be conservative.)
- Interest rate: 5%
- Debt service: $1,503
As you can see, buying today to lock in current prices and refinancing when rates are lower is the best option.
Also, purchasing today does not necessarily mean negative cash flow. We are still finding properties with first-year ROI between 0% and 1% by putting 30-35% down or buying down interest rates. Buying today gets you on the rent and appreciation escalator bound for financial freedom.
So, I see no advantage to waiting.
We’ve helped more than 180 clients on their path to financial freedom. Many have already made it. If you would like to discuss what we can do for you, please schedule a Zoom chat. I promise not to try to sell you anything.
As always, I welcome your comments.
…Eric
Eric@Fernwood.Team
702-358-8884
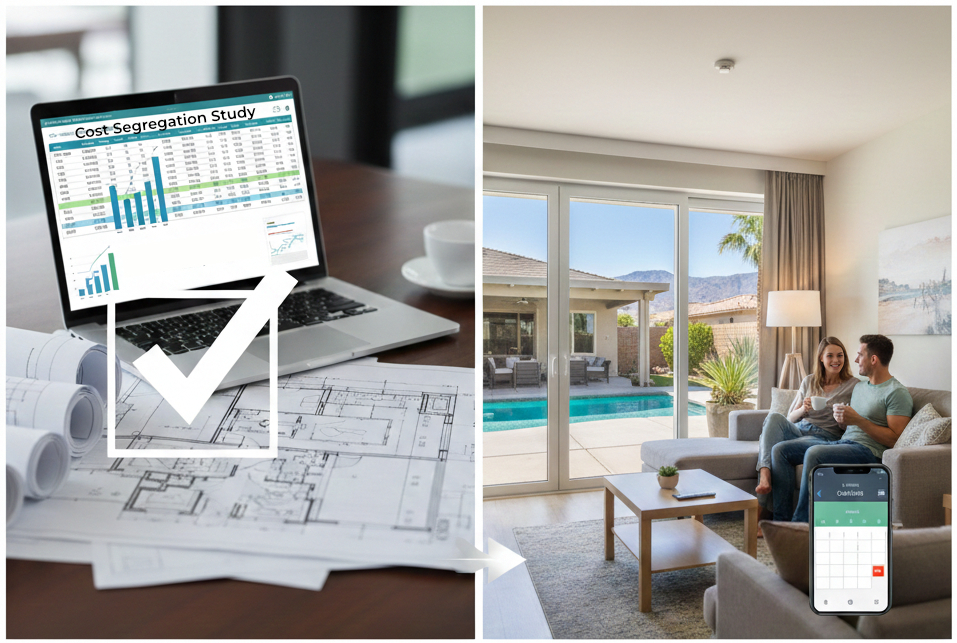
Potential Investment Properties
Below is a link to this month’s list of candidate investment properties. Our proprietary data mining software selected these candidate properties from thousands of available properties, and this is just the first step in our multi-step validation process, as shown below.

This Month’s List of Candidate Properties
Market Trend
Below are charts from our latest trailing 13-month market report, which includes October data. Remember that this data is only for our target property profile, not the entire metro area. To see all the charts, please click here.
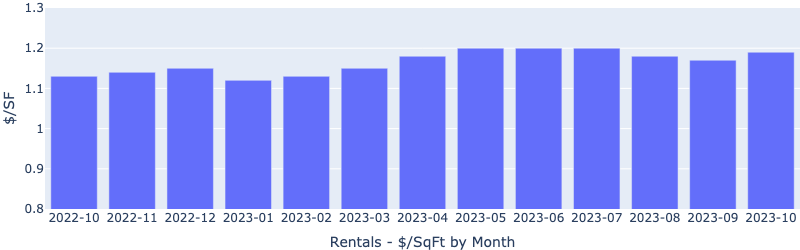
Rentals – Median $/SF by Month
Rents remained strong in October. YoY is up 6%.
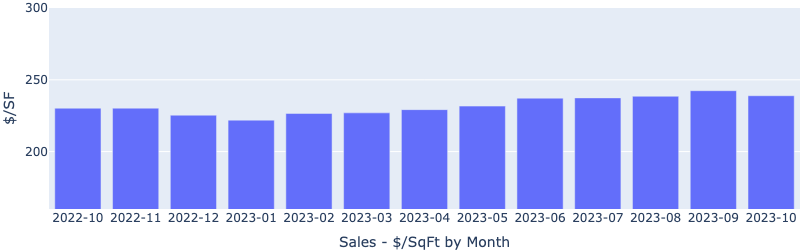
Sales – Median $/SF by Month
Despite increasing interest rates, $/SF is climbing up. YoY is up 3.9%. YTD is up 7.7%. Prices dropped slightly in October MoM, reflecting a pre-Covid seasonal trend.
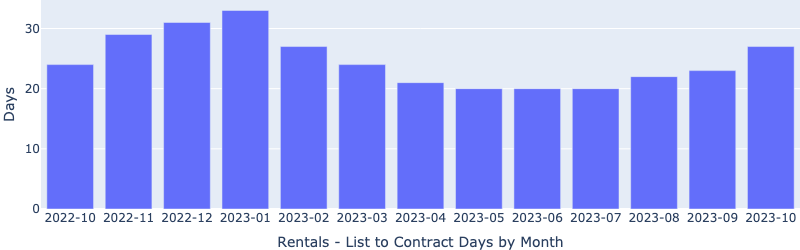
Rentals – List to Contract Days by Month
Median time to rent increased in October, showing a slower rental market as the holiday season approaches.
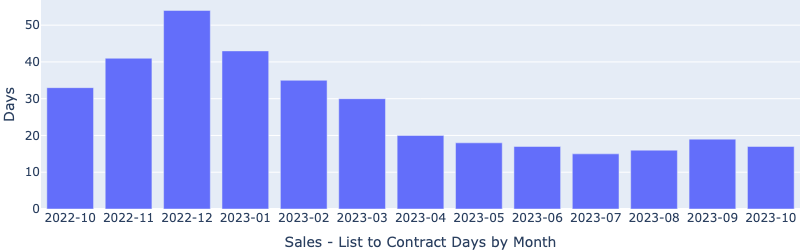
Sales – List to Contract Days by Month
Median days on the market remained under 20 days for October, indicating strong demand even for the season.
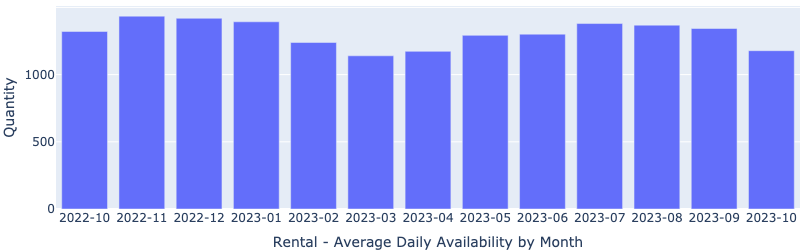
Rentals – Availability by Month
The number of homes for rent continued the downward trend.
Sales – Availability by Month
This chart shows the average daily number of properties that were for sale in a particular month. For the first time in 13 months, the number of homes on the market stopped declining. My guess is seasonal slowing down.

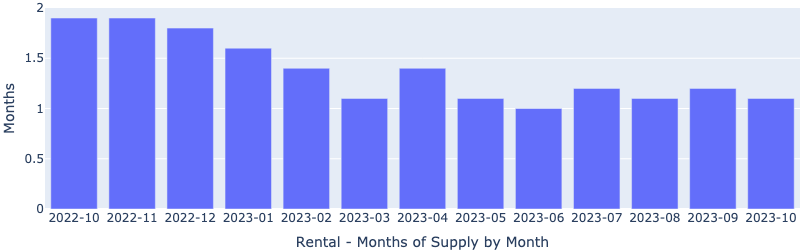
Rentals – Months of Supply
Only about one month of supply for our target rental property profile. Demand is greater than supply.
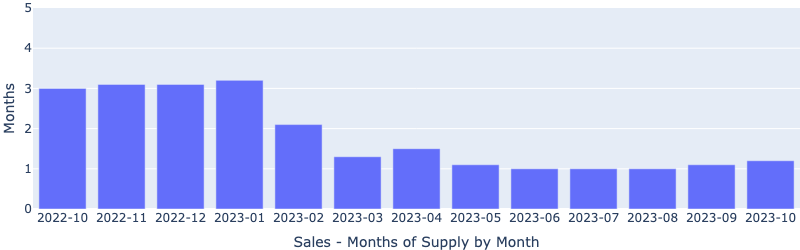
Sales – Months of Supply
Inventory is now at only one month. A 6 month supply is considered a balanced market. This will continue to pressure up the prices.
About the Fernwood Real Estate Investment Group
We Help Clients Acquire Highly Reliable Passive Income Streams
For the last 15+ years, we’ve helped clients build highly reliable, passive income streams through real estate that they will not outlive. Several are now retired and living entirely on their rental income. Most never invested in real estate before they started working with us, and most live in other states or countries. Below is a two-minute video of the services we provide.

Want to know what we can do for you?
© 2005-2022 Cleo Li and Eric Fernwood, all rights reserved.