
In This Report
- The State of the Las Vegas Housing Market
- Potential Investment Properties
- Market Trends
- About the Fernwood Real Estate Investment Group
The State of the Las Vegas Housing Market
“There are decades where nothing happens; and there are weeks where decades happen.”* …Vladimir Lenin
You’ve probably noticed we are having (and may have more to come) a few of those “weeks when decades happen.” We’re living in one of those rare moments when everything changes at once—a fundamental realignment of power, capital, and influence happening in real time.
The U.S. stock market has completed several roller-coaster cycles, and even the bond market has violently sold off (versus the expected climb).
Given this extreme financial market volatility, I wanted to examine how the housing market is performing.
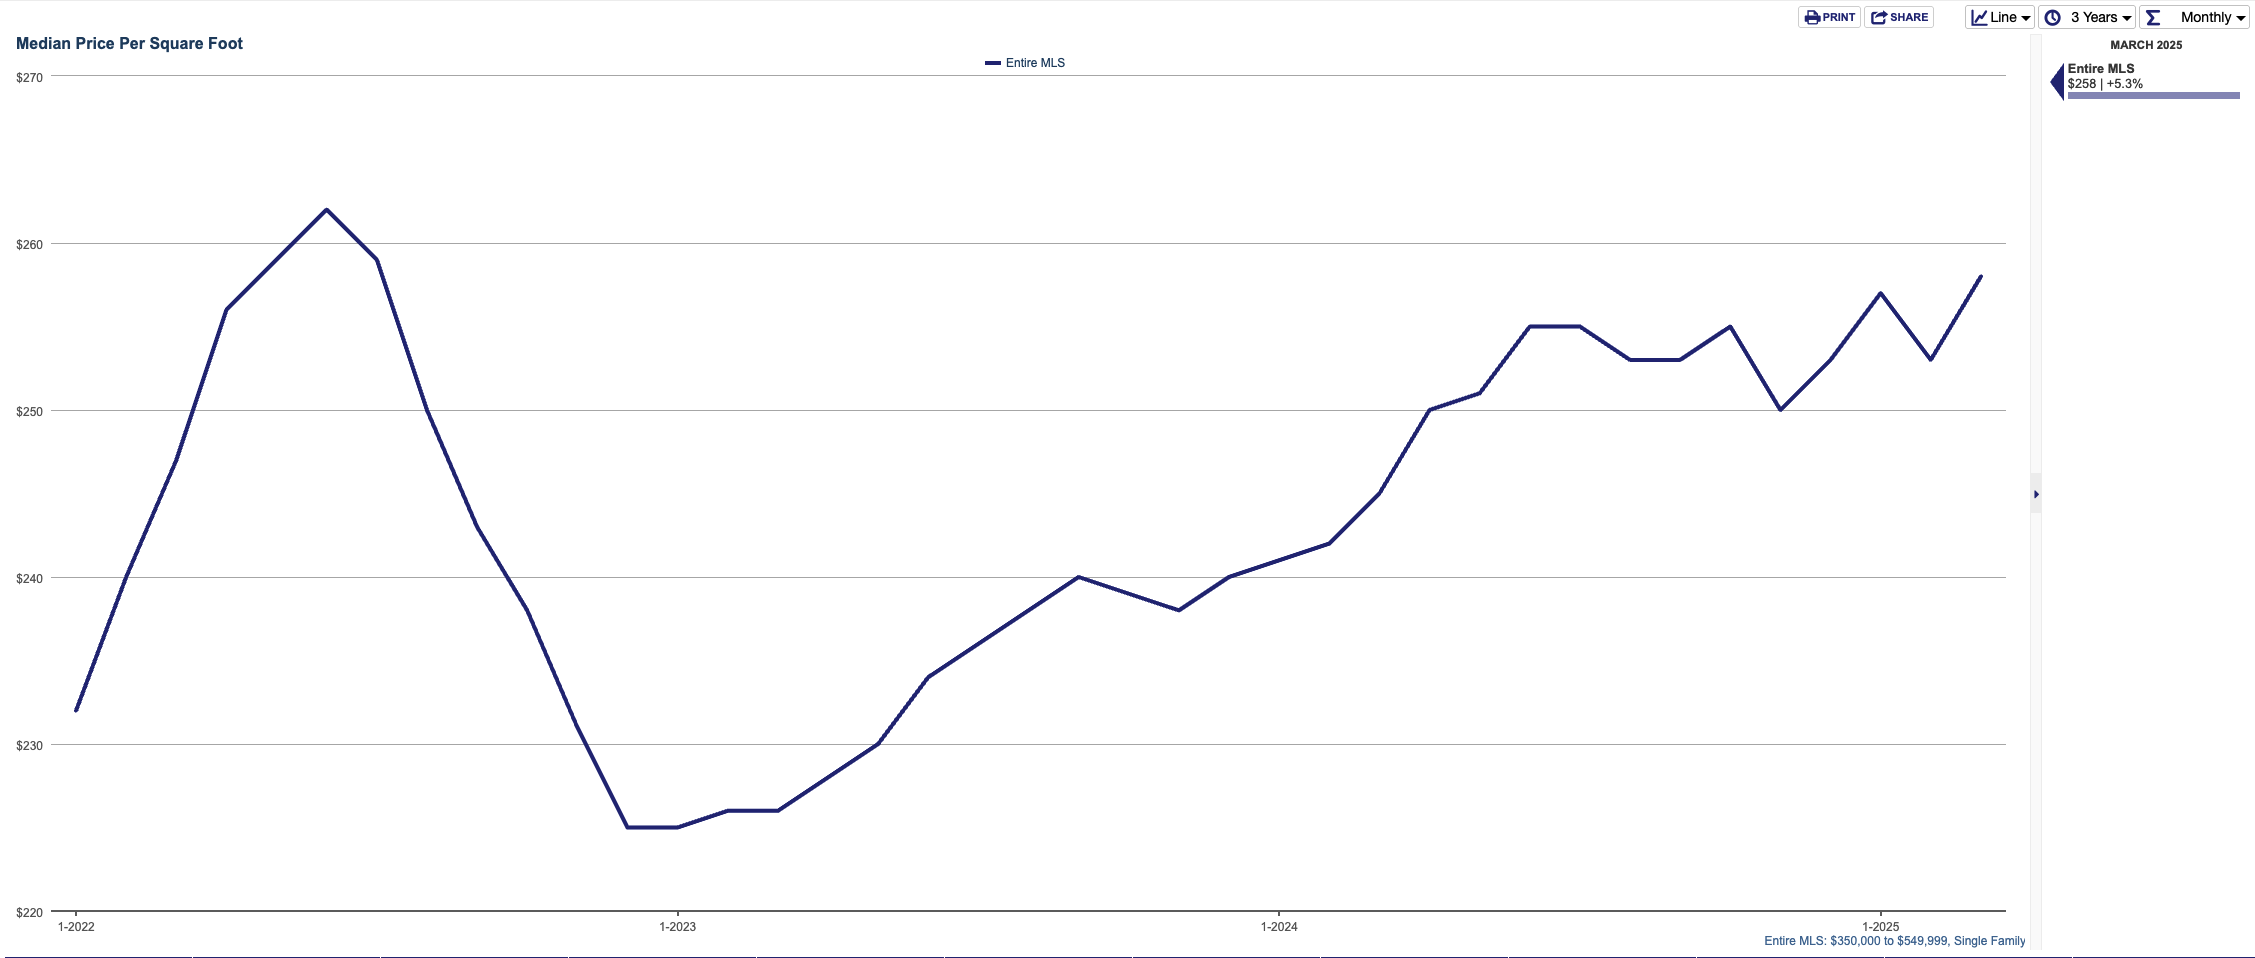
The following charts from the Las Vegas Realtor MLS show data for all single-family homes (including new construction) priced between $350,000 and $550,000. I chose to analyze this broader market range, rather than just our target property profile, to better show overall market trends.
The first metric I want to see is the days on the market (DOM). If people panic or get nervous, they usually pause buying houses, and that will cause homes to stay on the market longer.
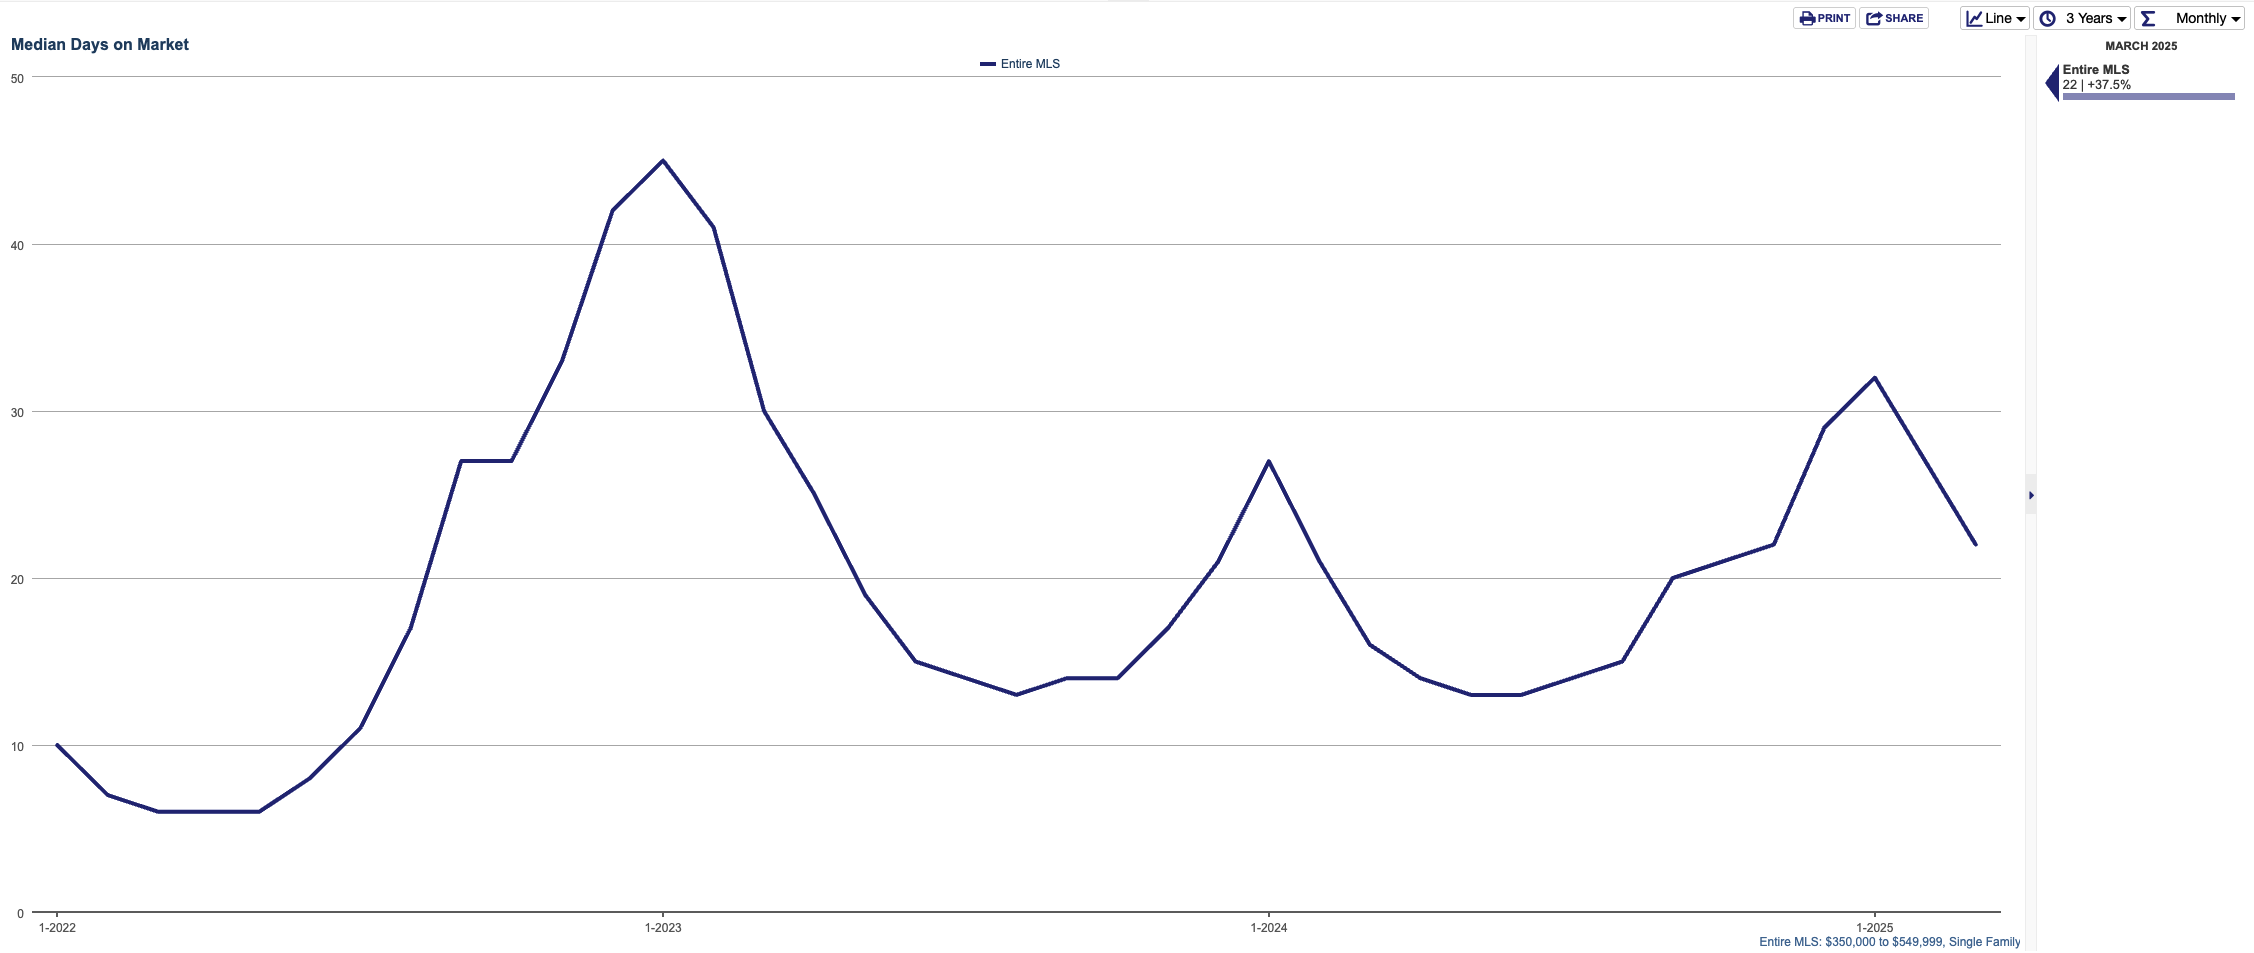
The DOM is trending downward, following typical seasonal patterns. The market shows strong, healthy activity with a median of 22 days in March.
The next metric is the number of homes under contract. If people paused buying homes, the number of homes under contract would decline.
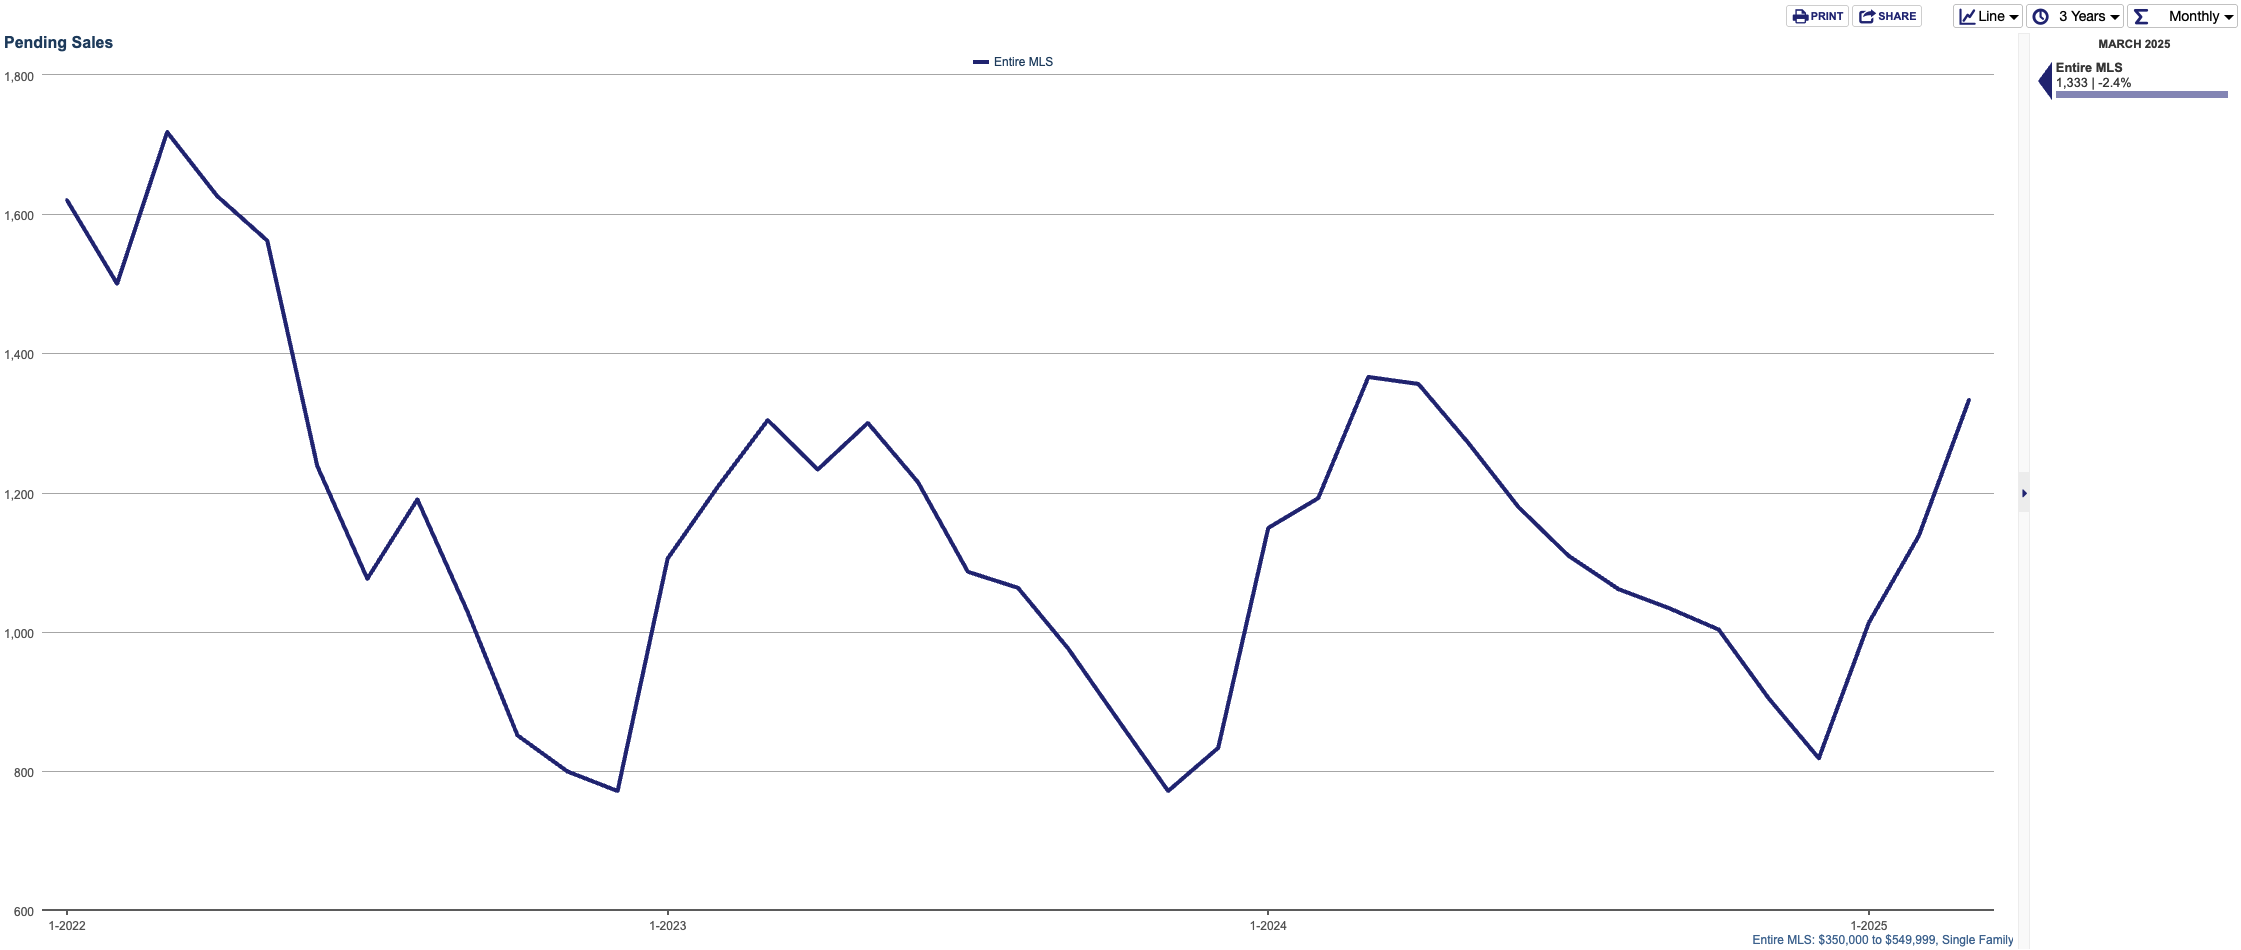
The number of homes under contract (being sold) has risen sharply since December 2024, following typical seasonal trends.
Next, I wanted to see if inventory has started to pile up as a result of any panic.
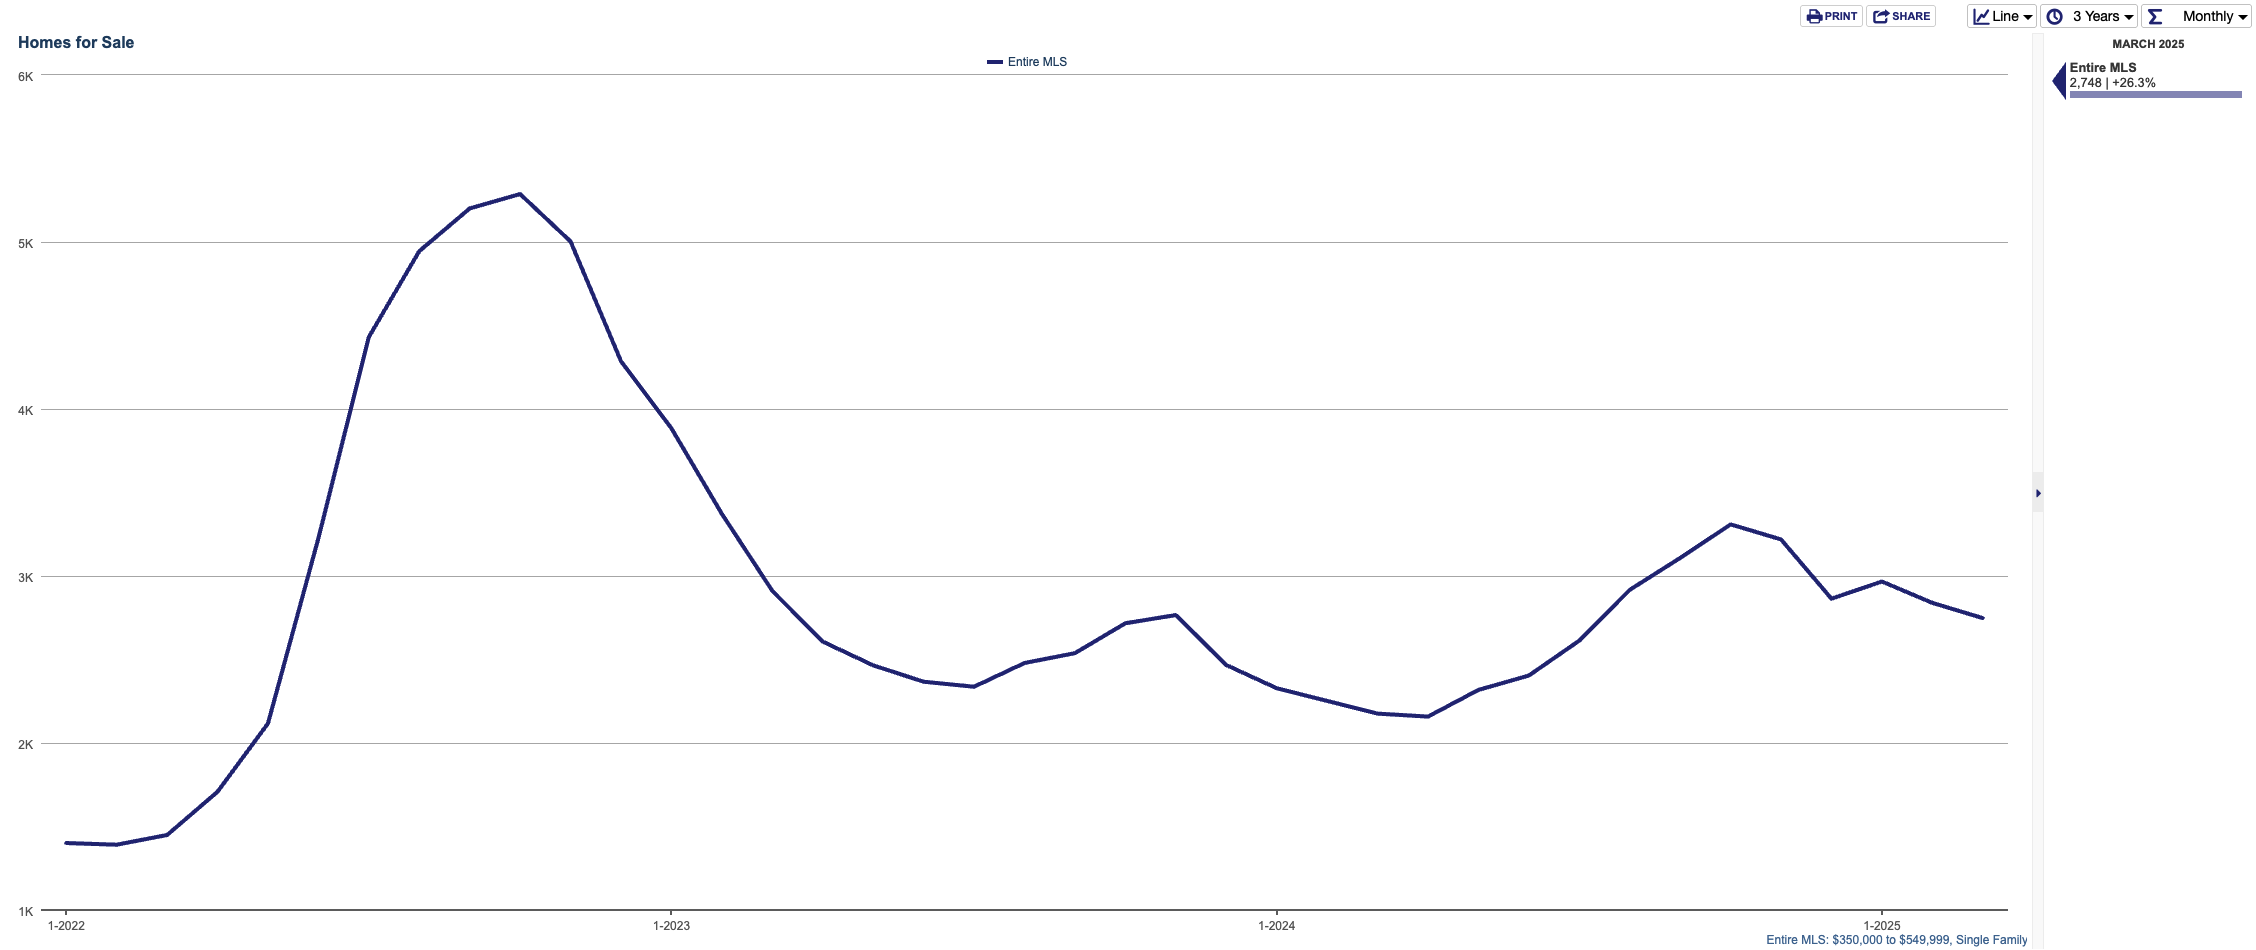
The number of homes for sale in this price range is actually trending down, as is the months of supply.

The current inventory shows 2.5 months of supply in March. For context, a 6-month supply indicates a balanced market where the number of buyers roughly equals the number of sellers and the prices remain stable. With only 2.5 months of supply and no increase in available homes, prices are likely to continue rising.
Next, since mortgage rates affect the housing market a great deal, I looked up Freddie Mac’s mortgage rates tracker –
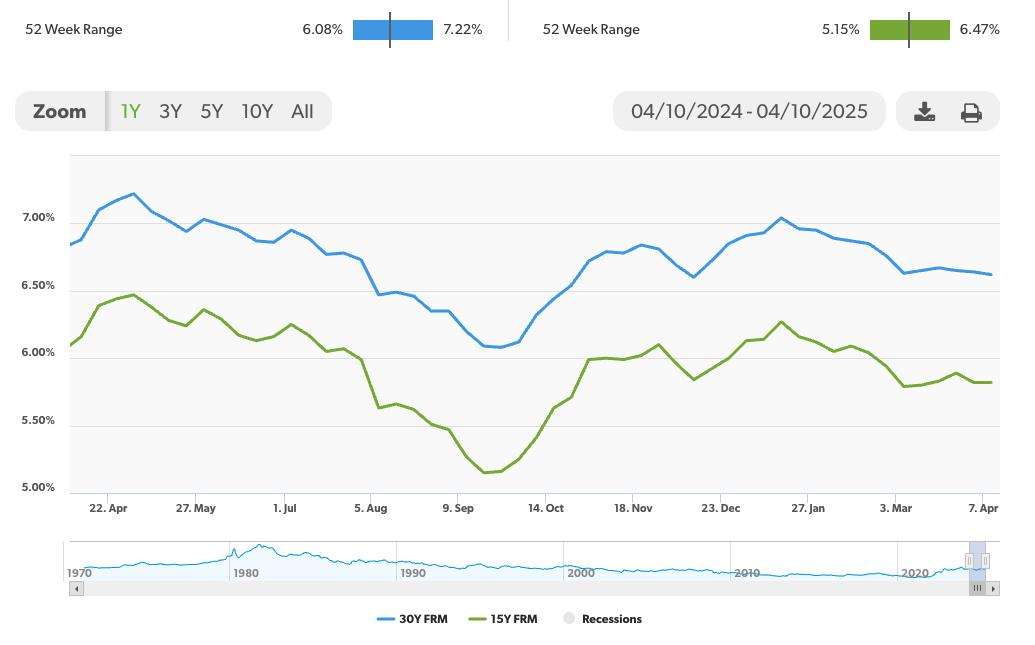
The 30-year fixed-rate mortgage has continued to trend down since mid-January 2025.
Conclusion
Based on the available data, the Las Vegas housing and mortgage markets appear unaffected by the recent financial market turmoil caused by tariffs. The housing market continues to follow typical patterns for an appreciating market during this season. Given the current low inventory (2.5 months with no signs of increasing) and short days-on-market figures, I anticipate that prices will rise throughout the year.
This observation underscores the stability of real estate. While the financial market has demonstrated extreme volatility (potentially causing significant losses if you react hastily), residential real estate offers much more stability, reducing your risk while delivering substantial growth and returns.
Please note that the MLS data above does not include April figures yet. Anecdotally, we haven’t observed any changes in market trends so far this month. We’ll continue monitoring the market closely and provide another update in May with the latest MLS data on the Las Vegas housing market.
If you’re interested in exploring how the current Las Vegas market conditions could align with your goals, please use the link below to schedule a time that works best for you.
Potential Investment Properties
Below is a link to this month’s list of candidate investment properties. Our proprietary data mining software selected these candidate properties from thousands of available properties, and this is just the first step in our multi-step validation process, as shown below.

This Month’s List of Candidate Properties
Market Trend
Below are charts from our latest trailing 13-month market report, which includes March data. Remember that this data is only for our target property profile, not the entire metro area. To see all the charts, please click here.
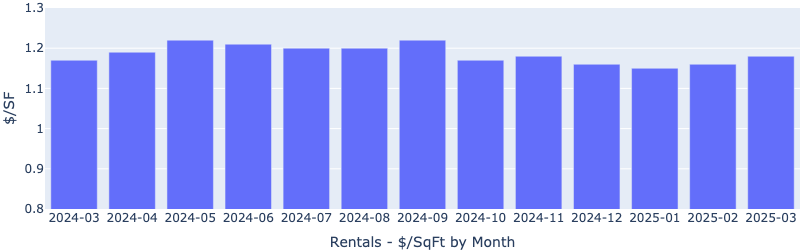
Rentals – Median $/SF by Month
Rents increased MoM, in line with our expectations. YoY is up 1.7%.
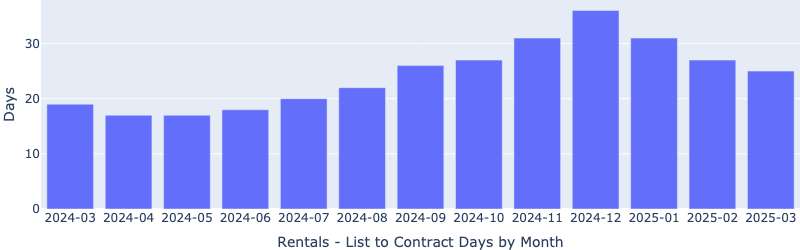
Rentals – Median Time to Rent by Month
Median time to rent continued to decrease in March, now just below 25 days. This is in line with our expectations for the time of the year.
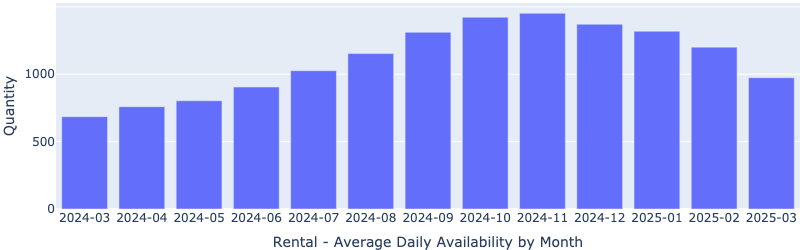
Rentals – Availability by Month
The number of homes for rent continued to decrease MoM, in line with our expectations.
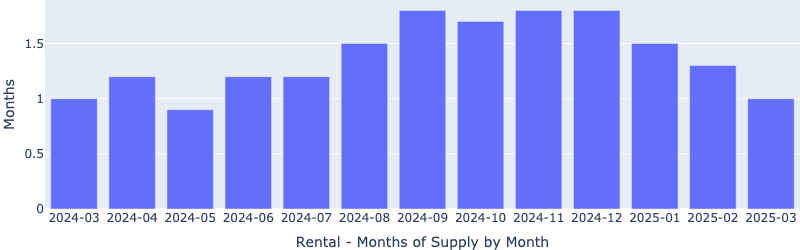
Rentals – Months of Supply
Only one month of supply for our target rental property profile. This low inventory will continue to pressure up rents.
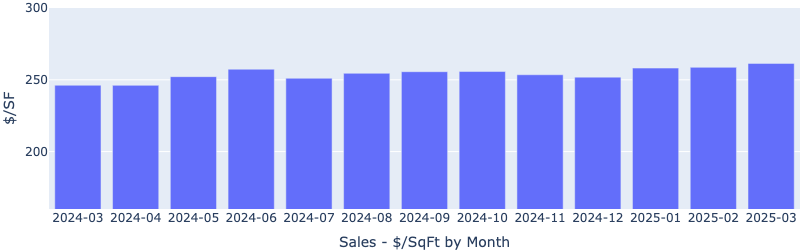
Sales – Median $/SF by Month
The $/SF continue to increase MoM. YoY is up 6.1%.
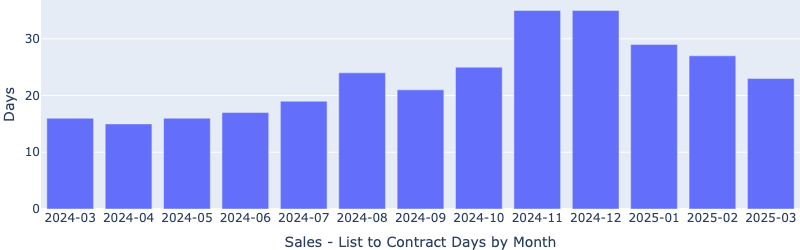
Sales – List to Contract Days by Month
Median days on the market continue to drop rapidly MoM, now about 22 days, indicating a strong demand early in the buying season.
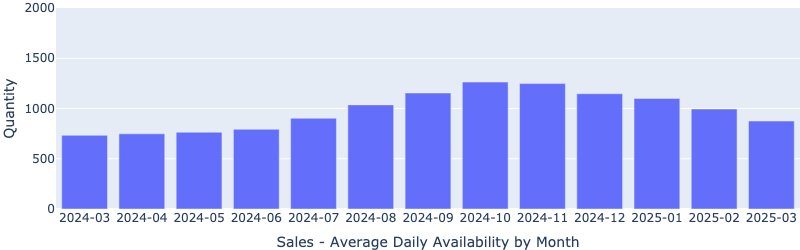
Sales – Availability by Month
This chart shows the average daily number of properties for sale in a particular month. It continues to decrease MoM.
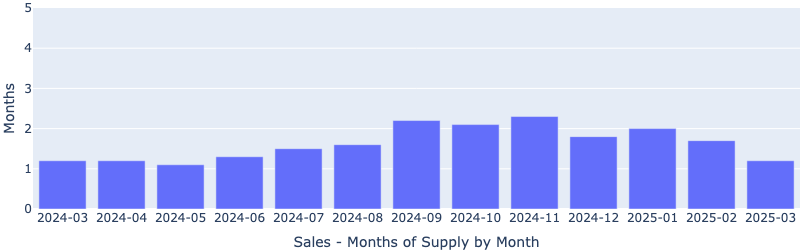
Sales – Months of Supply
There are about 1.1 months of supply for our target property profile. A 6 months supply is considered a balanced market. This limited inventory will likely continue to drive up prices.
About the Fernwood Real Estate Investment Group
We Help Investors Build Wealth through Strategic, Data-driven Real Estate Investments in Las Vegas.
Here is what our clients have to say about us:
For the last 17+ years, we’ve helped clients build highly reliable, passive income streams through real estate that they will not outlive. Several are now retired and living entirely on their rental income. Most never invested in real estate before they started working with us, and most live in other states or countries. Below is a two-minute video of the services we provide.

Want to know what we can do for you?
© 2005-2025 Cleo Li and Eric Fernwood, all rights reserved.