
- Navigating the Current Market Effectively: Taking Advantage of Loan Options
- Potential Investment Properties
- Market Trend
- About the Fernwood Real Estate Investment Group
- Schedule a discovery call with Eric Fernwood
Many people are waiting for either the price or the interest rate to come down. What is the likelihood of either happening in the foreseeable future?
- Prices – We are already seeing rents and prices rise, as discussed in last month’s newsletter (March 2023 Market Report) and also evidenced by the latest 13-month trailing stats. This is driven by falling inventory and steady demand. Inventories have fallen to about one month; a six-month inventory is considered a balanced market. I do not see any factors that will drastically increase the inventory or decrease the buyer pool (demand). Therefore, it is unlikely that prices will decrease in the foreseeable future.
- Interest rates – The Federal Reserve stated that they are committed to a low inflation policy, which will likely result in more interest rate hikes. So, interest rates are likely to increase or remain high for the foreseeable future.
The longer you wait, the more you will end up paying. Fortunately, there are options to buy now and take advantage of current prices.
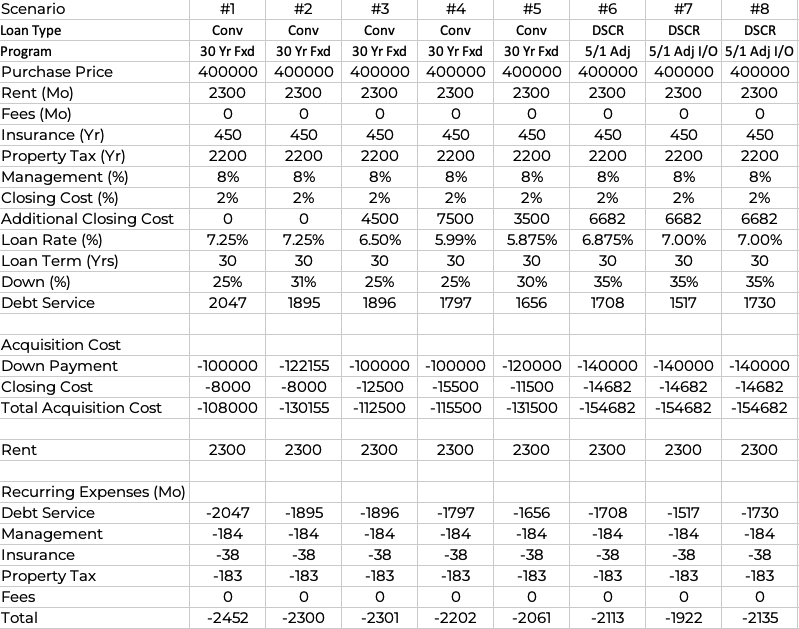
The scenarios I will cover are summarized in the table below.
Conventional Loans
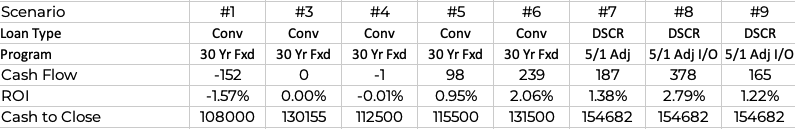
- Scenario #1: Suppose you are buying a $400,000 property with 25% down. The cash to close is approximately $108,000, and the return is -1.57%. The three-year gain/loss will be -$152/Mo x 3Yrs = -$5,472
- Scenario #2 – Increase the amount of the down payment until you break even each month; no loss. To achieve zero cash flow, you would need to increase your down payment to 31%. The cash to close will be $130,155.
- Scenario #3 – To obtain a 6.5% interest rate with a 25% down payment, the buy-down cost will be 1.5% of the principal, or $400,000 x 75% x 1.5% = $4,500. The cash to close will be $112,500. The return on investment will be approximately 0%. Therefore, you can achieve the same result (~$0) at a lower cost with an interest rate buy-down than increasing your down payment.
- Scenario #4 – To have a 5.99% interest rate, with 25% down, the cost will be 2.5% of the principal or $400,000 x 75% x 2.5% = $7,500. The return will be +.95%. The cash to close will be $115,500.
- Scenario #5 – To have a 5.875% interest rate, with 30% down, the cost will be 1.25% of the principal or $400,000 x 70% x 1.25% = $3,500. The return will be +2.06%. The cash to close will be $131,500.
The above scenarios are just examples of what can be achieved by utilizing interest rate buy-downs or increasing your down payment. In the current market, we can often get the sellers to agree to contribute up to $5,000 towards your closing cost, which decreases your cash to close.
DSCR Loans
A DSCR (Debt Service Coverage Ratio) loan is a type of commercial loan that considers the income generated by a property to determine whether the borrower can repay the loan. The DSCR ratio is calculated by dividing the property’s net operating income (NOI) by the total debt service (principal and interest payments).
DSCR Loan Advantages
- Lower Interest Rates: DSCR loans typically offer lower interest rates compared to traditional loans.
- Higher Loan Amounts: DSCR loans can provide a higher loan amount than traditional loans.
- Flexibility: DSCR loans can be used for a variety of purposes, including purchasing a property, refinancing an existing loan, or funding renovations.
- Longer Loan Terms: DSCR loans typically have longer loan terms than traditional loans.
- Lower Down Payment: DSCR loans may require a smaller down payment than traditional loans.
Jonathan Reece of GENEVA Financial provided the data for the following scenarios. Jonathan’s been in the lending business for 25 years and holds multiple affiliations. His contact details are JVR@GenevaFi.com / 602-332-1772.
- Scenario #6 – 5/1 adjustable P&I with 35% down (65% LTV) (5 years fixed and adjusts every year after five years). The cost will be 2.570% of the principal or $400,000 x 65% x 2.570% = $6,682, and the debt service will be $1,708/Mo. The cash to close will be $154,682.
- Scenario #7 – Interest-only, 5/1 adjustable, 35% down (65% LTV), the cost will be 2.570% of the principal or $400,000 x 65% x 2.570% = $6,682, and the debt service will be $1,517/Mo. The cash to close will be $154,682.
- Scenario #8 – 30-year fixed rate, 35% down (65% LTV), the cost will be 2.570% of the principal or $400,000 x 65% x 2.570% = $6,682, and the debt service will be $1,730/Mo. The cash to close will be $154,682.
Summary
There are several financing options that can help you buy today and still have a positive initial cash flow. Below is a summary of the scenarios:
If you would like to chat about your situation and goals, please use my scheduling link below.
Thanks for your time and I welcome your feedback.
…Eric
Eric@Fernwood.Team
702-358-8884
As always, I welcome your comments.
Below is a link to this month’s list of candidate investment properties. Our proprietary data mining software selected these candidate properties from thousands of available properties, and this is just the first step in our multi-step validation process, as shown below.

Below are charts from our latest trailing 13-month market report, which includes January data. Remember that this data is only for our target property profile, not the entire metro area. To see all the charts, please click here.
|
Rental Statistics
|
Sales Statistics
|
|
Rentals – Median $/SF by Month
As expected, the rents started increasing due to increasing demand and decreasing supply. YoY rents are down 1.7%.
|
Sales – Median $/SF by Month
Prices continued the upward trend since January, due to the shrinking supply and steady demand. YoY were down 6%.
|
|
Rentals – List to Contract Days by Month
Median time to rent stayed unchanged from February, significantly lower than January.
|
Sales – List to Contract Days by Month
Median days on market continued to drop rapidly, indicating buyers are back in the market.
|
|
Rentals – Availability by Month
The number of homes for rent continued to decrease rapidly, indicating decreasing supply.
|
Sales – Availability by Month
This chart shows the average daily number of properties that were for sale in a particular month. The number of homes on the market continues to drop rapidly. This is going to push up the price.
|
|
Rentals – Months of Supply
Just one month of supply for our target rental property profile. Demand is greater than supply. This will push up the rent.
|
Sales – Months of Supply
Inventory is now at 1 month for March. 6 months supply is considered a balanced market. This indicates a seller’s market.
|


For the last 15+ years, we’ve helped clients build highly reliable, passive income streams through real estate that they will not outlive. Several are now retired and living entirely on their rental income. Most never invested in real estate before they started working with us, and the vast majority live in other states or countries. Below is a two-minute video of the services we provide.

Want to know what we can do for you?

© 2005-2022 Cleo Li and Eric Fernwood, all rights reserved.

