

In This Report
-
The Time-Starved Investor’s Guide to Selecting High-Performing Rental Markets
-
-
Market Trends
-
About the FERNWOOD Team
The Time-Starved Investor’s Guide to Selecting High-Performing Rental Markets
The city where you invest will determine your long-term results. That’s why location is the single most important investment decision you’ll make, not the property itself.
Trying to pick the right city can feel like trying to put an automatic transmission back together. If you’ve ever seen inside one, it’s a maze of gears and fluid passages, and to me, it looks impossible that it could even work. Yet using it is simple. I just put the car in drive or reverse and go. I don’t need to understand how an automatic transmission works to benefit from it.
I take the same approach when choosing a city that can deliver financial independence. You could spend endless hours digging through data on hundreds of markets—economic trends, job growth, demographics, housing markets, schools—but you don’t need to. You only need to focus on a few requirements that truly matter:
-
Population growth. Prices and rents follow supply and demand. If the population is flat or declining, supply keeps up with demand and prices stagnate. But when population grows steadily, demand outpaces supply, driving up both prices and rents. Significant and sustained growth is essential, and metro areas need at least one million people to attract companies that create lasting jobs. A quick check on will tell you a metro’s size and growth.
-
Low crime. Companies and people hesitate to move to cities with high crime, and residents of the city with sufficient income will move to a safer city. The declining population erodes the tax base, so cities have no option other than to cut back on services like schools and police, which accelerates population loss. Once that cycle starts, very few cities recover. Never invest in markets on the list of .
-
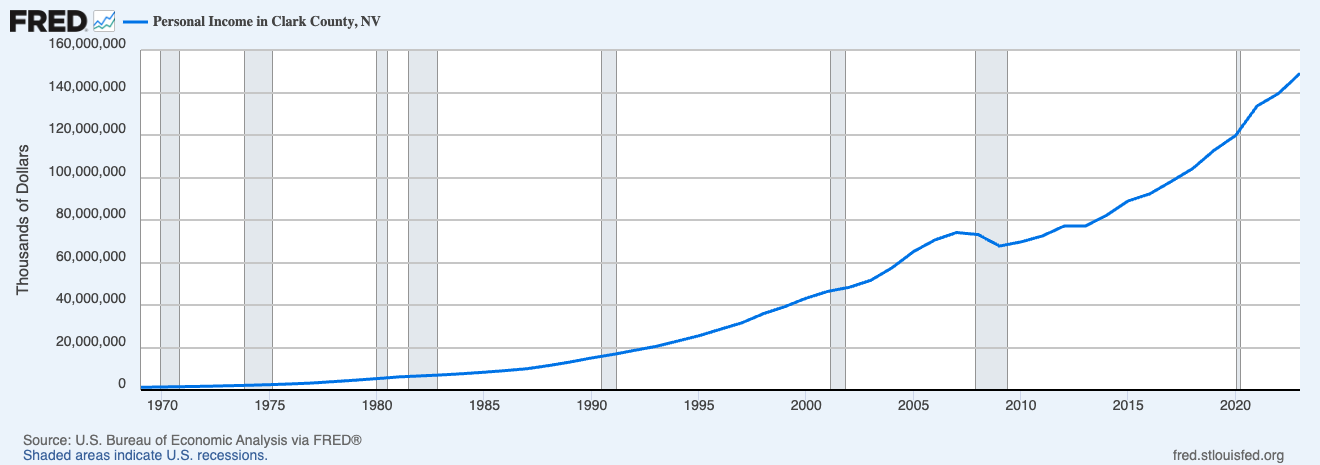
Personal income growth. If incomes don’t rise, rents can’t either. The publishes county-level personal income data—an essential check for any city. Below is the chart for Clark County, Nevada (Las Vegas).
-
No rent control. Rent control prevents you from keeping up with inflation, limits your property manager’s ability to choose tenants, and makes evictions difficult. A quick search of “[city name] rent control” will tell you if it’s an issue.
-
Low operating costs. What matters is not what you gross but what you net. Every dollar lost to operating costs is a dollar less for you to live on. The two largest operating costs are property taxes and insurance, and both vary widely by state. For reference, see these sources: and . Florida is a special case, so use this link:
-
Low natural disaster risk: When a tornado or other natural disaster hits a city, it does more than damage individual properties. Entire communities are disrupted—jobs, stores, and services disappear. Tenants will not wait a year or two for your property to be rebuilt. They will move quickly to places where they can live and work immediately. So, even if your insurer restores your property, there may be no one left to rent it. Low-cost insurance usually signals low disaster risk.
The Process
Start with cities that have a metro population of more than one million and significant and consistent population growth. Then, remove any city with high crime. Next, remove those with weak personal income growth, followed by cities with rent control. After that, I eliminate places with high operating costs and those with significant disaster risk. What remains is a short list of markets that are worth a deeper look.
The final requirement is an experienced local investment team. Real estate investing is hyper-local, and books, podcasts, and seminars only give general information. A strong team gives you the expertise, processes, and local resources you need, and they cost no more than working with a regular realtor. (For more on how to find and qualify a team, click .) If you can’t find a good team in a city, move on to the next one.
Summary
Your choice of city is the most important decision you will make as an investor. If the city doesn’t meet all these criteria and doesn’t have a capable local team, you are unlikely to achieve lasting financial independence. Follow the process described here for a straightforward and efficient way to identify high-performance markets.
If you’re interested in exploring how the current Las Vegas market conditions could align with your goals, please use the link below to schedule a time that works best for you.
Potential Investment Properties
Below is a link to this month’s list of candidate investment properties. Our proprietary data mining software selected these candidate properties from thousands of available properties, and this is just the first step in our multi-step validation process, as shown below.

Market Trend
Below are charts from our latest trailing 13-month market report, which includes August data. Remember that this data is only for our target property profile, not the entire metro area.
Rentals – Median $/SF by Month
Rents increased slightly in August. YoY is up 3%. Despite global and domestic tensions, rents remained stable.

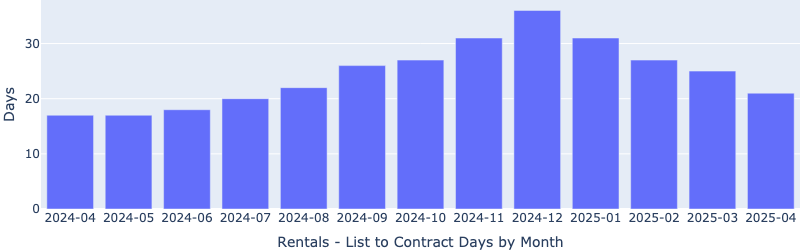
Rentals – Median Time to Rent by Month
Time to rent increased marginally MoM (from 23 days to 24 days), but remained healthy.
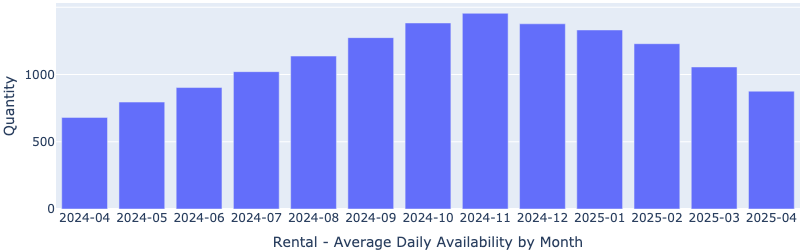
Rentals – Availability by Month
The number of homes for rent decreased slightly MoM in August, bucking the usual seasonal trend.
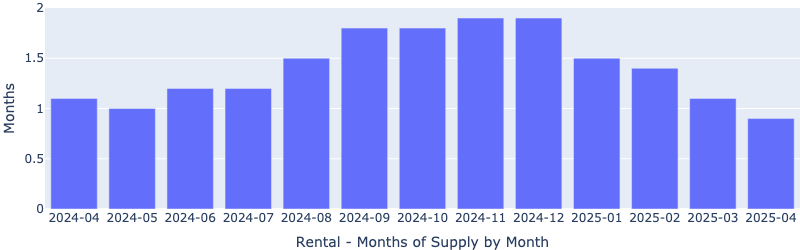
Rentals – Months of Supply
There are only 1.4 months of supply for our target rental property profile. This low inventory will continue to pressure up rents.
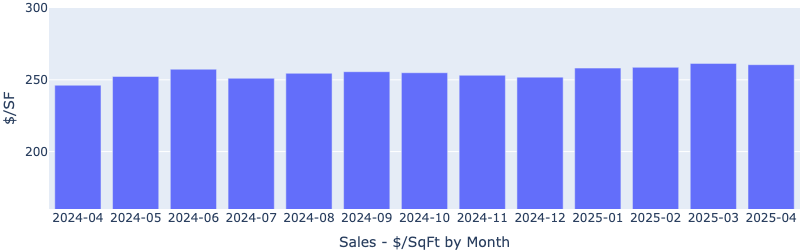
Sales – Median $/SF by Month
The price per square foot unexpectedly fell in August. While we typically see a slight slowdown when school begins mid-month, this drop was larger than normal. Since the time to sell actually decreased and the inventory (months of supply) remained stable (see charts below), my guess is that all the negative news and global uncertainty pushed some sellers to cut prices.
I also looked into distressed single-family sales, and there’s no sign of trouble. The numbers are very low:
-
Short sales: 38, about 0.0084% of all single-family homes
-
Bank owned (REO): 37, about 0.0082%
-
Foreclosures started: 33, about 0.0073%
Overall, the market still looks healthy.
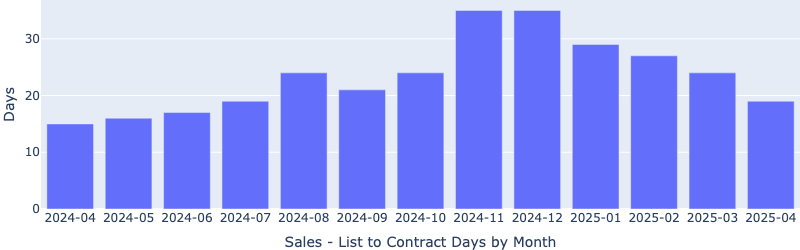
Sales – List to Contract Days by Month
Median days on the market decreased MoM, indicating that some sellers and buyers have decided not to wait any longer.
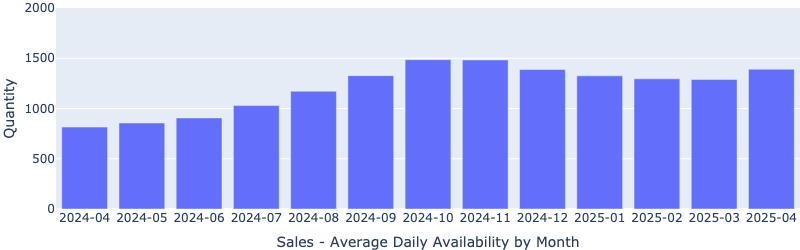
Sales – Availability by Month
The number of properties for sale has been decreasing since June, which bucks the “usual” seasonal trend.
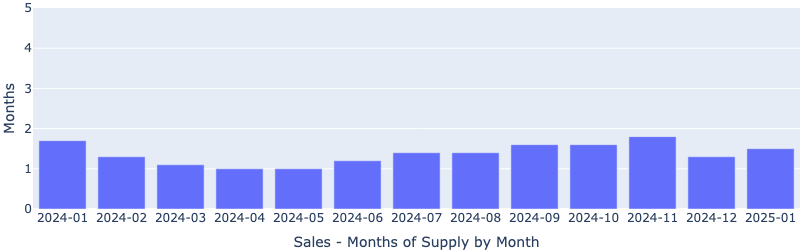
Sales – Months of Supply
Inventory remains at two months, indicating our segment is still a seller’s market.
About the FERNWOOD Team
We Help Investors Build Wealth through Strategic, Data-driven Real Estate Investments in Las Vegas.
Here is what our clients have to say about us:
For the last 17+ years, we’ve helped clients build highly reliable, passive income streams through real estate that they will not outlive. Several are now retired and living entirely on their rental income. Most never invested in real estate before they started working with us, and most live in other states or countries. Below is a two-minute video of the services we provide.

Want to know what we can do for you?
© 2005-2025 Cleo Li and Eric Fernwood, all rights reserved.
Join the newsletter. Subscribe to receive our latest post in email.