

In This Report
-
Insurance and Property Taxes – The Less Talked About Metrics
-
Potential Investment Properties
-
Market Trends
-
About the FERNWOOD Team
Insurance and Property Taxes – The Less Talked About Metrics
Cleo and I were discussing our upcoming 2026 investor outlook, and we decided to reevaluate Las Vegas’ competitiveness relative to other popular investment cities. The metrics we looked at here are insurance and property taxes, which are much less talked about than property prices and rents. Below are the cities we researched:
-
Dallas-Fort Worth, Texas
-
Charlotte, North Carolina
-
Tampa, Florida
-
Indianapolis, Indiana
-
Phoenix, Arizona
-
Raleigh-Durham, North Carolina
-
Austin, Texas
-
Cleveland, Ohio
-
Nashville, Tennessee
-
Colorado Springs, Colorado
-
Las Vegas, Nevada
Insurance Cost
Below are the average annual insurance costs and the sources of information.
| City | Average Annual Insurance | Source Reference |
|---|---|---|
| Tampa, FL | $8,160 | Insure.com – Tampa Premium Crisis Data |
| Colo. Springs, CO | $4,068 | Insurance.com – Colorado Market Hardening |
| Dallas, TX | $4,122 | Bankrate – Texas Major Metro Averages |
| Austin, TX | $3,480 | reAlpha – Texas Disaster-Safe Zones |
| Charlotte, NC | $2,952 | Way.com – NC Insurance Comparison 2025 |
| Raleigh, NC | $2,952 | NerdWallet – NC State Average Analysis |
| Nashville, TN | $2,676 | The Zebra – Tennessee Premium Trends |
| Phoenix, AZ | $2,328 | ValuePenguin – Arizona Market Snapshot |
| Indianapolis, IN | $1,668 | NerdWallet – Indianapolis Metro Rates |
| Cleveland, OH | $1,368 | Insurance.com – Ohio City Averages |
| Las Vegas, NV | $1,140 | MoneyGeek – NV Property Insurance 2025 |
Grouping Cities by Insurance Cost Volatility
High-Volatility Markets
These cities have seen insurance premiums outpace inflation significantly, often due to high-risk weather events (hurricanes, wildfires, or severe hail).
-
Tampa, FL: The most extreme case. Florida premiums have skyrocketed, with the average annual cost now exceeding $5,800. In the last decade, rates have more than doubled, with a 42% increase in the last three years alone. Source: and .
-
Dallas & Austin, TX: Texas currently has the highest insurance rates in the country after Florida. Average premiums are around $3,900. Texas saw a 28% spike between 2022 and late 2023—the highest one-year increase in the U.S.—driven by convective storms and hail. Source: .
-
Phoenix, AZ: Historically low-cost, but recently volatile. Arizona saw a 70% increase over the last six years, primarily due to rising wildfire risks and a 11.4% jump in 2024 alone. Average premiums now hover around $2,300–$2,500. Source: and .
-
Colorado Springs, CO: Colorado is now the 6th costliest state for insurance. Costs nearly tripled between 2014 ($1.9B industry-wide) and 2024 ($5.2B). Investors face an average premium of over $4,000, with rates increasing 58% just between 2018 and 2023. Source: and .Medium-Volatility Markets
Medium-Volatility Insurance Markets
These cities track closer to the national average but are still seeing “catch-up” rate hikes from insurers.
-
Charlotte & Raleigh, NC: North Carolina has seen a 36% increase from 2018–2023. While coastal areas face the most pressure, the “Triangle” and Charlotte have seen base rate increases of roughly 7.5% annually recently to offset statewide catastrophe losses. Average premiums are around $2,900. Source: .
-
Nashville, TN: Tennessee rates are rising but remain relatively manageable compared to the deep South. The 10-year trend shows a steady climb to an average of $2,670, roughly 10% above the national average. Source: and .
Lower-Volatility Markets
-
Indianapolis, IN: Remains one of the more affordable markets with an average premium of $1,666. While rates have risen, they remain nearly $800 below the national average. Source: and .
-
Cleveland, OH: Ohio consistently ranks among the cheapest states for home insurance. The average premium is roughly $1,364. The 10-year trend has been stable, making this a “safe haven” for investors worried about insurance volatility. Source: and .
-
Las Vegas, NV: Nevada offers some of the most competitive rates in the country, with an average annual premium of approximately $1,393 across all property types and price ranges. For the property segment we target, insurance averages $800 – $1000 per year. Because the region is shielded from most major catastrophic events—hurricanes, tornadoes, wildfires, and severe hail—insurance costs remain roughly $1,000 to $1,100 below the national average. Source: . Las Vegas remains highly competitive in terms of insurance costs.
Natural Disasters
Property insurance costs don’t tell the whole story. Natural disasters can devastate your property and the surrounding community, leading to job losses and business closures. This forces people to relocate. While insurance might cover reconstructing your property, the community’s recovery could take years (think about Lahaina on Maui)—or never happen at all. Meanwhile, your expenses like debt service, taxes, insurance, and maintenance continue.
Property Taxes
For investors, the other major cost component is property taxes. Below is a list of average property tax rates and information sources.
| City | Average Property Tax Rate | Source |
|---|---|---|
| Dallas-Fort Worth, TX | 2.22% | BKV Energy – Texas Major Cities 2025 |
| Austin, TX | 1.89% | Virtuance – Austin Property Taxes 2025 |
| Cleveland, OH | 1.77% | WalletHub – State Property Tax Ranking |
| Indianapolis, IN | 0.98% | LendingTree – US Metro Tax Comparison |
| Charlotte, NC | 0.98% | LendingTree – US Metro Tax Comparison |
| Tampa, FL | 0.95% | Virtuance – Tampa Tax Rates 2025 |
| Raleigh-Durham, NC | 0.92% | Motley Fool – Property Taxes by State 2025 |
| Nashville, TN | 0.60% | Construction Coverage – Nashville ETR |
| Las Vegas, NV | 0.59% | Stessa – US Cities Tax Rankings |
| Phoenix, AZ | 0.58% | LendingTree – US Metro Tax Comparison |
| Colorado Springs, CO | 0.48% | Ziprent – 2025 State Tax Rankings |
Las Vegas has near the lowest property tax rates. For our target property segment, the average property tax rate is 0.55%. The table below compares property tax, insurance, and total combined costs for a $400,000 property across all cities.
| City | Property Tax Rate | Annual Property Tax | Annual Home Insurance | Total Annual Operating Cost |
|---|---|---|---|---|
| Dallas-Fort Worth, TX | 2.22% | $8,880 | $4,122 | $13,002 |
| Tampa, FL | 0.95% | $3,800 | $8,160 | $11,960 |
| Austin, TX | 1.89% | $7,560 | $3,480 | $11,040 |
| Cleveland, OH | 1.77% | $7,080 | $1,368 | $8,448 |
| Raleigh-Durham, NC | 0.92% | $3,680 | $2,952 | $6,632 |
| Colo. Springs, CO | 0.48% | $1,920 | $4,068 | $5,988 |
| Phoenix, AZ | 0.58% | $2,320 | $2,328 | $4,648 |
| Nashville, TN | 0.60% | $2,400 | $2,676 | $5,076 |
| Indianapolis, IN | .98% | $3,920 | $1,668 | $5,588 |
| Charlotte, NC | 0.98% | $3,920 | $2,952 | $6,872 |
| Las Vegas, NV | 0.59% | $2,360 | $1,140 | $3,500 |
Below is a table showing the additional annual cash flow needed to compensate for higher overhead costs compared to Las Vegas.
| City | Additional Cash Flow Required |
|---|---|
| Dallas-Fort Worth, TX | $9,502 |
| Tampa, FL (1) | $8,460 |
| Austin, TX | $7,540 |
| Cleveland, OH | $3,948 |
| Indianapolis, IN | $2,088 |
| Raleigh-Durham, NC | $3,132 |
| Charlotte, NC | $3,372 |
| Raleigh-Durham, NC | $3,132 |
| Colo. Springs, CO | $2,488 |
| Phoenix, AZ | $1,148 |
| Nashville, TN | $1,576 |
| Las Vegas, NV | N/A |
For example, a Dallas–Fort Worth property needs to make an extra $9,502 per year (that’s $792 per month) just to cover the higher costs compared to a Las Vegas property.
Summary
Las Vegas has some of the lowest operating costs compared to other cities. In our next monthly report—our 2026 Investor Outlook—we’ll look more closely at Las Vegas as a place to invest. When you’re comparing cities to invest in, remember to include each city’s operating costs in your decision. …Eric If you’re interested in exploring how the current Las Vegas market conditions could align with your goals, please use the link below to schedule a time that works best for you.
Potential Investment Properties
Below is a link to this month’s list of candidate investment properties. Our proprietary data mining software selected these candidate properties from thousands of available properties, and this is just the first step in our multi-step validation process, as shown below.

Market Trend
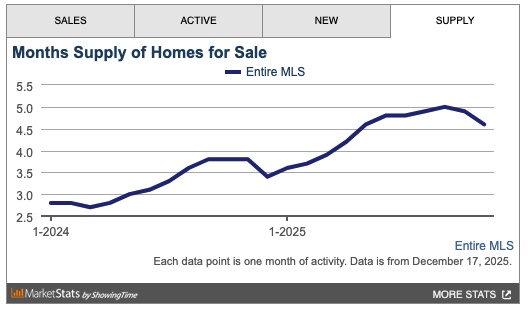
Below are charts from our latest trailing 13-month market report, which includes November data. Remember that this data is only for our target property profile, not the entire metro area. The chart below, from the MLS, includes ALL property types and price ranges. The overall inventory is trending down.
Rentals – Median $/SF by Month
Rents were flat MoM. The median $/SF has remained in a tight band of $1.16/SF and $1.20/SF for the past 13 months. 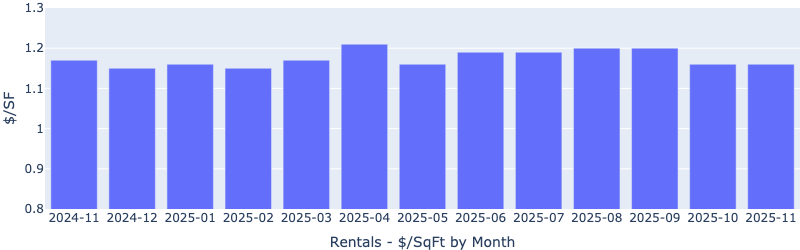
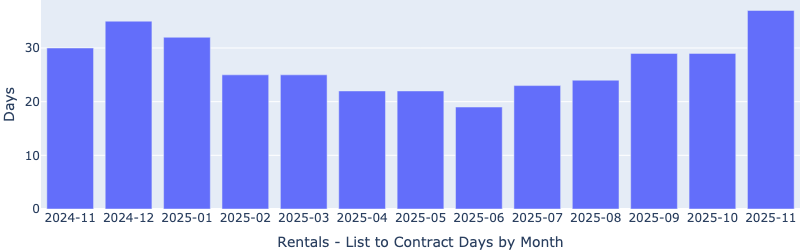
Rentals – Median Time to Rent by Month
Median days to rent increased moderately MoM, conforming to the seasonal trend.
Rentals – Availability by Month
The number of homes for rent continue to decrease MoM, which is unusual for the time of year (it usually rises during the fall). 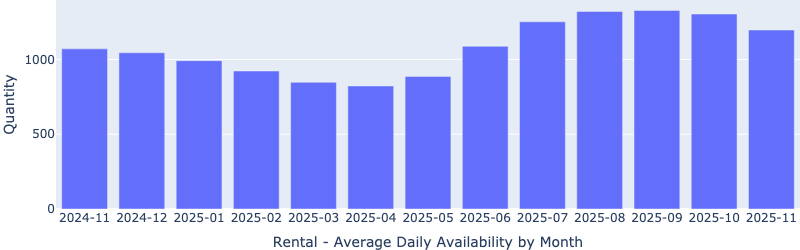
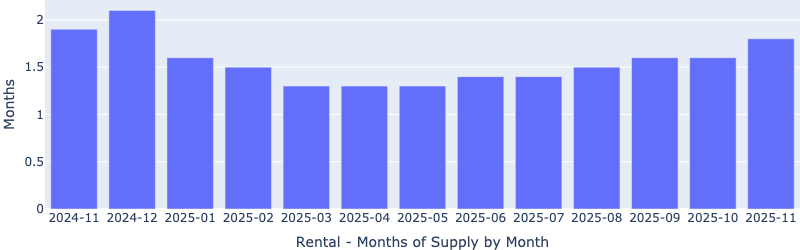
Rentals – Months of Supply
Rental inventory increased MoM, now at almost 1.8 months, still a landlord’s market.
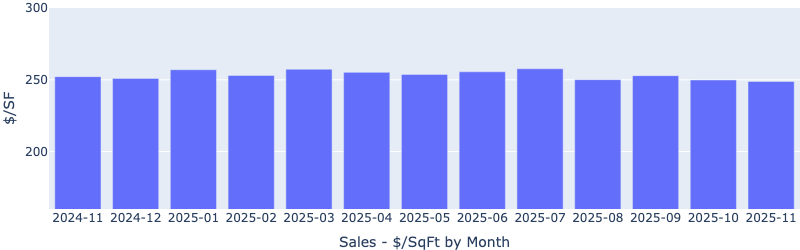
Sales – Median $/SF by Month
Prices were basically flat MoM, a bit unusual for the time of year (it usually drops in the fall).
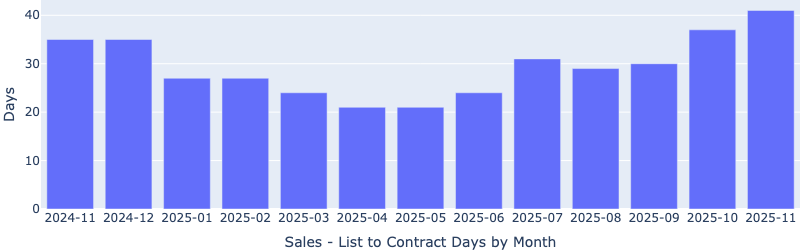
Sales – List to Contract Days by Month
Median days on the market increased moderately MoM, typical for the holiday season.
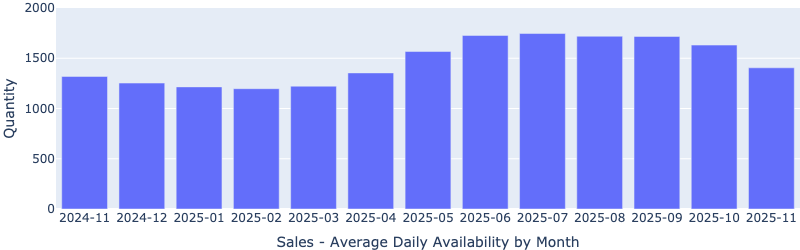
Sales – Availability by Month
The number of properties for sale has been decreasing since June, which again bucks the “usual” seasonal trend.
Sales – Months of Supply
Sales inventory has remained in a tight band around 2.5 months for the last several months, indicating a consistent seller’s market. 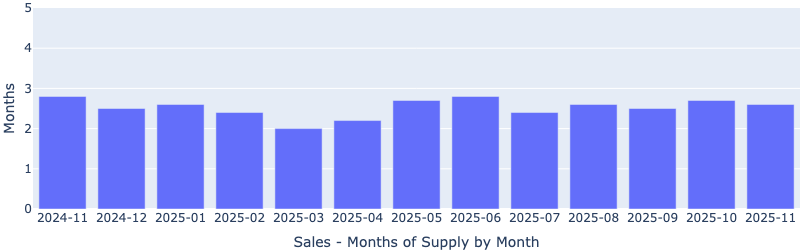
About the FERNWOOD Team
We Help Busy Professionals Build Wealth through Strategic, Data-driven Real Estate Investments in Las Vegas.
Here is what our clients have to say about us:
For the last 17+ years, we’ve helped clients build highly reliable, passive income streams through real estate that they will not outlive. Several are now retired and living entirely on their rental income. Most never invested in real estate before they started working with us, and most live in other states or countries. Below is a two-minute video of the services we provide.

Want to know what we can do for you?
Get weekly insights like this and learn how professionals build income safely.