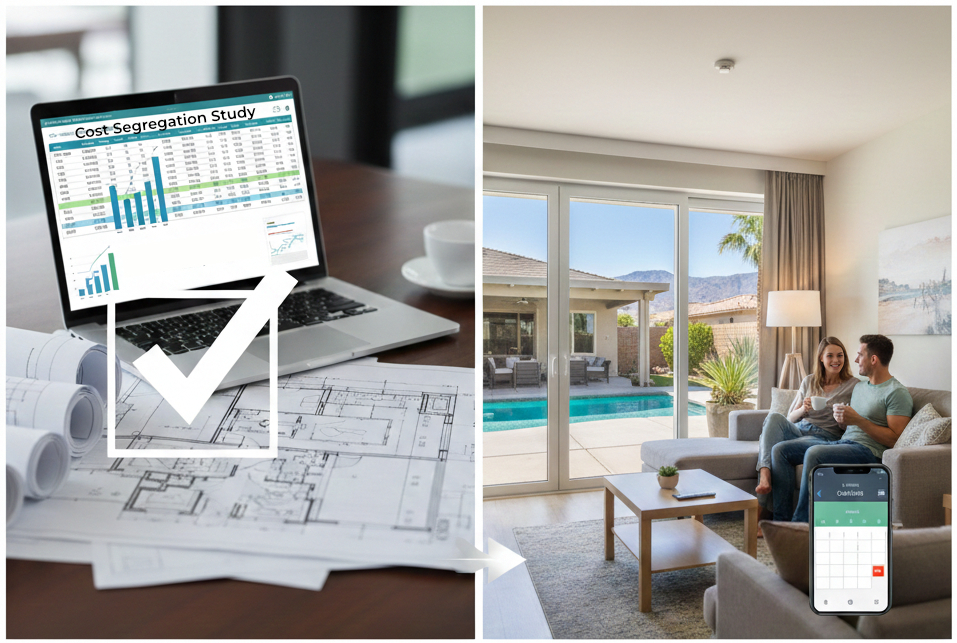
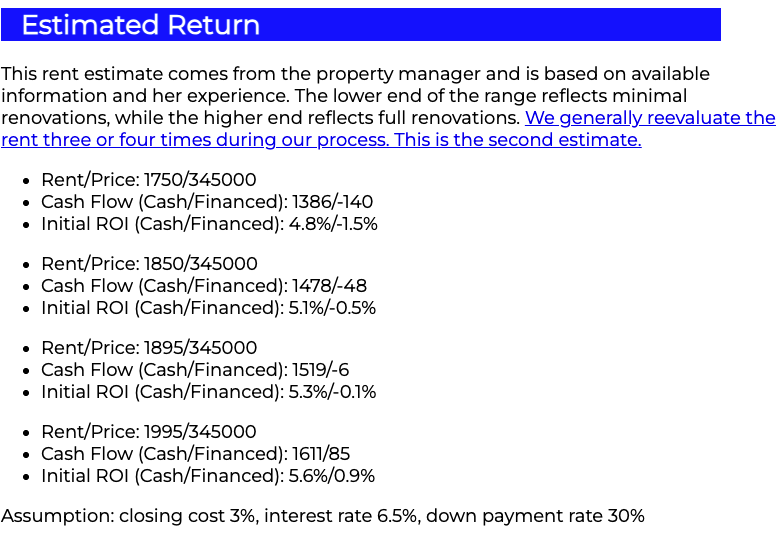
For each property we evaluate, we provide a Property Report with return estimates—including cash flow and initial ROI—as shown in the image below. The property manager may provide multiple rent estimates based on different renovation scenarios.
This paper explains how we calculate these metrics and why. I’ll also show why it’s essential to look beyond initial performance and evaluate a property’s long-term potential. Data-driven, forward-looking analysis leads to better investment decisions—especially when comparing properties across very different markets, such as Las Vegas and Cleveland, where future growth trajectories differ.
It is important to remember that these return estimates are, at best, estimates. No return estimates will accurately predict actual returns. However, they are helpful tools to allow you to compare properties and select the better performing ones, as long as you use the same metrics for all properties.
Cash Flow and ROI
When evaluating an investment property, most people turn to two popular metrics: cash flow and ROI. While these are useful for comparing similar properties under the same conditions, they only reflect how a property might perform on day one—under ideal assumptions. Real estate is a long-term investment. You’re likely to hold a property for decades, so basing decisions solely on day one estimated performance can lead to poor outcomes.
For example, suppose you are comparing two properties: Property A and Property B. The illustration shows the starting cash flow on the left and the inflation-adjusted cash flow in present-day buying power over time.
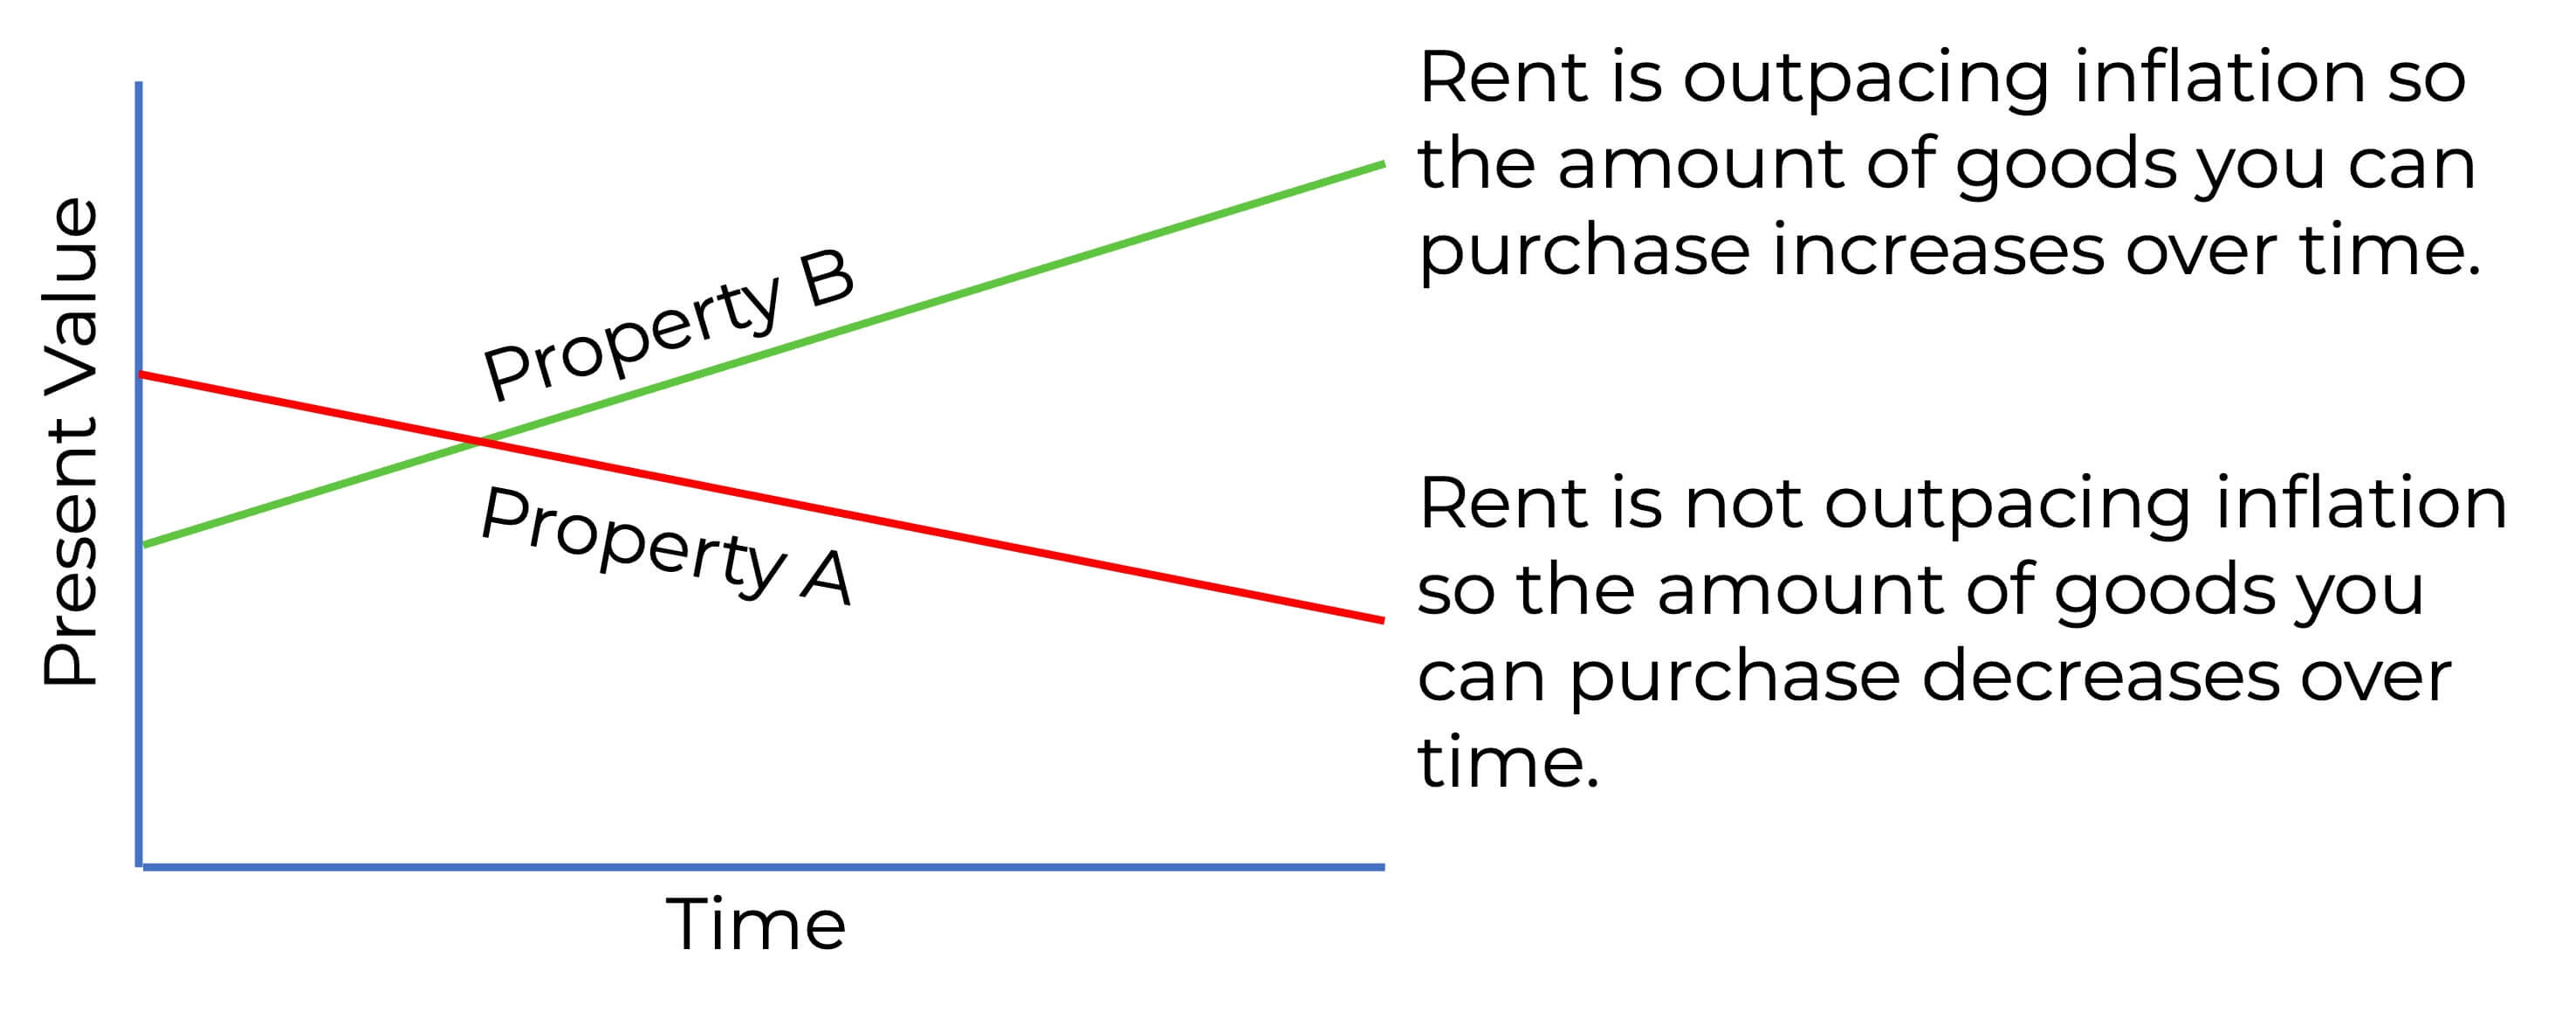
If you based your decision only on first day return (cash flow or ROI), you would choose Property A because it has a higher initial cash flow. However, you will likely hold the property for the next 30 years or more (and then pass it on to your children). So what is likely to happen over the hold time is far more important than what is predicted for day one. I will show you how to compare properties over time a little later. For now, I will explain the cash flow and ROI calculations we include in our Property Reports. I will start with cash flow.
Cash Flow
Cash Flow is defined as: Income – expenses. The actual formula is:
- Cash Flow = (Rent – DebtService – ManagementFee – Insurance – RealEstateTax – PeriodicFees – MaintenanceCost – VacancyCost)
Variable Considerations
- Maintenance and Vacancy Costs: MaintenanceCost and VacancyCost are unknown. Some real estate sites estimate maintenance cost at 5% of the projected gross annual rent and vacancy cost also as 5% of the projected gross annual rent. However, there is no relationship between vacancy cost and rent or maintenance cost and rent. Maintenance cost is property-specific, and vacancy cost is tenant-specific. Since these are unknown, we don’t include them in our calculations. Note that including any arbitrary value that is a percentage of rent invalidates the calculation results. Later in this paper, I’ll explain how we compensate for maintenance and vacancy costs.
- Insurance cost: There is no way to estimate your actual Insurance cost because it varies by credit score, the chosen deductible, the insurance provider, and whether you bundle other insurance policies with your landlord insurance. So, we use an estimate of $800/year.
- Debt Service: For DebtService, we use the current investor interest rate with 30% down (a conservative estimate) and a 30-year term. You can download the spreadsheet from the Property Report and adjust the loan terms to match your actual terms.
- Periodic fees: PeriodicFees only apply if the property is within a homeowners association and there is a fee.
Rewriting the formula removing the two unknowns
- Cash Flow = (Rent – DebtService – ManagementFee – Insurance – RealEstateTax – PeriodicFees)
This is the formula we use to calculate cash flow in the Property Report.
ROI
ROI is defined as: CashFlow / AcquisitionCost
Expanding:
- ROI = (Rent – DebtService – ManagementFee – Insurance – RealEstateTax – PeriodicFees – MaintenanceCost – VacancyCost) / ( DownPayment + ClosingCosts + RenovationCosts)
Variable Considerations
- Maintenance and Vacancy Costs: Like with cash flow, we do not include these in the ROI calculation because they are unknown. We do compensate for these costs as you will lear later.
- Renovation cost: We don’t know the actual renovation cost until the property is under contract, inspections are complete, and the team decides on the final renovation list. Therefore, we do not include RenovationCosts in our Property Report calculations.
- Closing costs: Closing costs vary by property, credit score, loan terms, and more. Based on our research, they typically run less than 2% of the purchase price for financed properties. However, many buyers purchase discount points to lower their interest rate, so we use 3% as our estimate. For cash purchases, closing costs are typically under $2,000. Closing costs include origination fees, underwriting fees, prepaid interest, inspection, escrow fees, title insurance, and prepaid taxes and insurance—essentially every cost other than the down payment.
- Property tax: We use the actual property tax for the current year. There’s no formula to estimate RealEstateTax. So, RealEstateTax is the actual current property tax.
Simplifying:
- ROI = (Rent – DebtService – ManagementFee – Insurance – RealEstateTax – PeriodicFees)/ ( DownPayment + ClosingCosts)
We know some values so I will rewrite the formulas including the estimated values:
- Cash Flow = (Rent – DebtService – (8% x Rent) – $800 – RealEstateTax – PeriodicFees)
- ROI = (Rent – DebtService – (8% x Rent) – $800 – RealEstateTax – PeriodicFees) / ( DownPayment + 3% x PurchasePrice)
Note, each Property Report includes a downloadable spreadsheet so you can do “what if’s” or evaluate a cash purchase.
Long Term Evaluation
As mentioned earlier, cash flow and ROI only predict how a property is likely to perform under ideal conditions on day one. However, you’re likely to hold the property for the rest of your life, so what happens after the first day is more important than idealized day-one performance.
To estimate the present value of future rent, we will use the standard time value formula:
- FutureValue = PresentValue x (1 + R)^Years / (1 + r)^Years
Where:
- FutureValue: The buying power of future rent in present day dollars.
- PresentValue: is either the purchase price, initial rent, or cash flow.
- R: The projected annual percentage increase (rent growth or appreciation).
- r: The projected annual inflation over the hold period.
Considerations:
- How much rent goes up each year depends on the city where the property is located, not the property itself. City economic trends develop over many years, so they typically don’t change quickly. That’s why I assume rent will grow at a steady rate each year.
- I use 5% per year inflation as an estimate.
Below is an example showing how to compare the long-term performance of two properties.
Property A
- The city where this property is located has a projected rent growth of 2%/Yr.
- Initial cash flow is $200/Mo
- Purchase price $250,000
Property B
- The city where this property is located has a projected rent growth of 8%/Yr.
- Initial cash flow is $200/Mo.
- Purchase price $400,000
If you only consider day-one performance, Property A delivers the same cash flow as Property B for $150,000 less so you would choose Property A.
What is the likely future performance of both properties after 10, 20, and 30 years?
Property A:
- Initial month cash flow: $200/Mo
- 10th year cash flow: $200/Mo × (1 + 2%)^10/(1 + 5%)^10 ≈ $150/Mo. Even though the rent increased by 2%/year, it did not keep up with inflation, and the increased rent in 10 years will only buy what $150 will today.
- 20th year cash flow: $200/Mo x ( 1 + 2%)^20/(1 + 5%)^20 ≈ $112/Mo.
- 30th year cash flow: $200/Mo x ( 1 + 2%)^30/(1 + 5%)^30 ≈ $84/Mo.
Over 30 years, the buying power declines from $200 to $84 in today’s dollars. Despite its lower purchase price, Property A is a poor long-term investment.
Property B:
- Initial month cash flow: $200/Mo
- 10th year cash flow: $200/Mo x ( 1 + 8%)^10/(1 + 5%)^10 ≈ $265/Mo
- 20th year cash flow: $200/Mo x ( 1 + 8%)^20/(1 + 5%)^20 ≈ $351/Mo
- 30th year cash flow: $200/Mo x ( 1 + 8%)^30/(1 + 5%)^30 ≈ $466/Mo.
Even though Property B costs $150,000 more than Property A, this is an excellent long-term investment and will enable you to sustain financial independence throughout your lifetime.
The key takeaway: basing investment decisions on theoretical first-day performance often leads to poor decisions.
Compensating for Maintenance and Vacancy Costs
While there is no way to know or predict vacancy or maintenance costs for any specific property, but we need to compensate for them. First, I will look at maintenance costs.
Maintenance Costs
Maintenance cost is a function of:
- Property condition
- Property age
- Climate
- Construction materials
- Renovation materials
- Target tenant segment behavior
- Property manager tenant selection skill
Maintenance cost has no relationship to the amount of rent.
Maintenance costs can be divided into two categories:
- Base maintenance: These are the running toilets, dripping faucets, all the small repairs. Based on our research, the average annual cost is about $400 per year for our properties. This equates to about 1.5% of the gross annual rent. Note that maintenance cost has no relationship to rent. However, expressing maintenance cost as a percentage of rent is a convenient way to handle it.
- High cost maintenance items: High cost items include water heaters, roof repairs, HVAC repair or replacement, etc. These types of high cost repairs are property specific. Here is a paper you may find interesting: **Determining a Property Specific Maintenance Provision.**
Vacancy Costs
Vacancy cost is a function of:
- Tenant length of stay
- Carrying cost (debt service, taxes, insurance, utilities, etc.)
- Time to re-rent the property
- Between tenant renovation cost
- Target tenant segment behavior
- Property manager tenant selection skill
Vacancy cost has no relationship to the amount of rent.
Vacancy cost is the sum of all costs incurred until the next paying tenant is in the property. Vacancy costs include debt service, utilities, taxes, insurance and the cost to restore the property to rental condition. Based on research, our client’s vacancy costs equate to about $450/Yr or 1.7% of the gross annual rent.
Combined Vacancy and Maintenance Costs
The average percentage of gross annual rent lost to maintenance and vacancy costs is about 3.2%. We compensate for these combined costs by not including any tax savings in our calculations. An example of tax savings is depreciation.
The IRS requires you to depreciate your property’s improvements. If you don’t, the IRS will assume you did and tax you accordingly when you sell. (For more information on depreciation, see this post.) While investment real estate offers multiple tax savings, depreciation alone typically increases your effective return by 3% to 6% based on client feedback. The average tax savings from depreciation almost always exceed combined vacancy and maintenance costs. The two offset each other—this is how we compensate for vacancy and maintenance costs.
Summary
This article explains how we calculate cash flow and ROI in our Property Reports, including what variables we include or exclude, and why.
We also demonstrated how to compare the long-term performance of properties by accounting for rent growth and inflation using time value calculations. The example showed that a property with lower initial returns may outperform one with higher initial returns if it is located in a city with higher sustained rent growth.
Finally, real estate decisions should be based on long-term performance, not just idealized first day performance.