
Estimating Return

Photo by Firmbee.com on Unsplash
Return estimation is critical in investment consideration. This article explains the purpose of return calculation, its limitations, and how to estimate return. I will also show you how the method we use compares to some popular methods you'll find on many real estate websites.
First, I want to clarify a couple common mis concepts of return calculation.
The Purpose of Return Calculation
The purpose of return calculation is not to predict the actual return this investment will bring you. The return calculation is used to evaluate how a property is likely to perform. It is especially effective when comparing multiple properties, as a property with a higher calculated return is likely to perform better than a property with a lower calculated return.
Bear in mind that return calculations only estimate return based on the limited information available. Your income taxes and other factors heavily influence your actual return. Costs like maintenance, vacancy, tenant characteristics, permits, inspections, and lease-up fees also alter your actual return. To estimate your actual return, create a financial model of your current situation, including all taxes and expenses. Then, add the property to the model. The difference is your actual return.
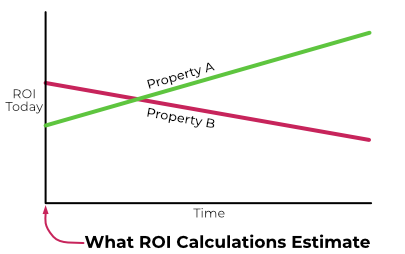
ROI and Similar Metrics Are Only A Snapshot of Time
ROI, and other such metrics, estimate how the property is likely to perform on day one of a lifetime hold. ROI tells you nothing about how the property is likely to perform in the future. The chart below shows an example of the importance of looking beyond today. Today, Property A and Property B have the same estimated ROI. However, Property A is in an appreciating market. Property B is in a market where rent increases have not kept pace with inflation. Overtime, Property A will perform far better than Property B. How the market is likely to perform in the foreseeable future is more important than how the property will perform on day one in most situations.

Below is another example. Even though Property B has a higher initial return, Property A is the clear winner over time. ROI can be misleading if you do not understand the market direction. Fortunately, there are easy ways to determine the market direction.
With the above in mind, let's look at how to estimate return.
The Formulas We Use
Below are the formulas we use for estimating return and cash flow. The primary use of these formulas is for comparing properties. While they are an approximation of your actual return, there are too many unknowns at this stage to accurately estimate your actual return. As you learn more about the property, you can add information that will improve accuracy.
ROI = (Income - Debt Service - Management Fee - Insurance - RETax - Periodic Fees) x (1 - StateIncome Tax) / ( Down Payment + Closing Costs)
Cash Flow = (Income - Debt Service - Management Fee - Insurance - RETax - Periodic Fees) x (1 - State IncomeTax)
Below is an explanation of the variables:
- Income: The monthly rent x 12.
- Debt Service: 12 x the monthly mortgage payment (principal and interest).
- Management Fee: Management fee percentage x annual rent.
- Insurance: Estimated annual landlord insurance.
- RETax: Annual property tax.
- Periodic Fees: The sum of all periodic fees. For example, the HOA dues.
- State Tax: Nevada has no state income tax so this is always zero. If you are comparing a property in Nevada to one in another state, use the appropriate tax rate for that state.
- Down Payment: For a financed purchase we use the down percent x the purchase price. For cash purchases, it is the total purchase price.
- Closing Costs: We use 3% x purchase price for financed properties and $2000 for cash purchases.
Note, when comparing properties, you are unlikely to know about property-specific costs, like maintenance, vacancy, or renovation costs. The best approach is to leave them out of the comparison calculations. Once you zero in on a specific property, you will want to include these costs.
So you can see how it all fits together below are example calculations on the following property:
- Purchase price: $150,000
- Rent: $1,000/Mo. or $12,000/Yr.
- Financing: 30 year, fixed rate of 4.5%, with 20% down. The payment would be approximately $608/Mo. or 7,296/Yr.
- Management fee: 8% x annual rent or $12,000 x 8% = $960/Yr
- Landlord insurance: $450/year
- Property tax: $1,155/Yr. This is the actual tax for this property
- Association fees: $20/Mo. or $240/Yr.
- State income tax rate: 0%
- Down payment: 20% x purchase price or: $150,000 x 20% = $30,000.
- Closing costs: 3% of purchase price: $150,000 x 3% = $4,500
If we plug the above values into the formulas:
ROI = (12000 - 7296 - 960 - 450 - 1155 - 240) x (1 - 0) / (30000 + 4500) = 5.5%
Cash Flow = (12000 - 7296 - 960 - 450 - 1155 - 240) x (1 - 0) = 1,899/Yr
Now that you see how to use the formulas, we will put them to use comparing two similar properties in different locations.
Comparing Properties in Different Locations
In this example we will compare two actual properties. One is located in Austin and the other is in Las Vegas.
| Location | Austin | Las Vegas |
|---|---|---|
| Photos |  |
 |
| Asking Price | $252,500 | $255,000 |
| Estimated Rent | $1,700/Mo | $1,490/Mo |
| SqFt | 2068 | 2033 |
| Beds | 4 | 3 |
| Baths | 3 | 3 |
| Stories | 2 | 2 |
| Monthly Fees1 | $41/Mo | $41/Mo |
| Property Tax | $6,022/Yr | $1,151/Yr |
| Insurance | 1,625/Yr | $450 |
| Debt Service | $1,024/Mo | $1,033/Mo |
Note 1: I used the same association fee for both properties to keep things "apples to apples".
Below are the assumptions for both properties.
- 20% down
- 4.5% rate
- 30 year term
- 3% closing cost
- 8% property management
- 0% state income tax. Neither Texas or Nevada have a personal state income tax.
Calculations for the Austin property:
- ROI = (1700 x 12 - 1024 x 12 - 1700 x 12 x 8% - 1625 - 6022 - 41 x 12) / (3% x 252500 + 20% x 252500) = -2.9%
- Cash Flow = (1700 x 12 - 1024 x 12 - 1700 x 12 x 8% - 1625 - 6022 - 41 x 12) = -1659/Yr. or -139/Mo.
Calculations for the Las Vegas property:
- ROI = (1490 x 12 - 1033 x 12 - 1490 x 12 x 8% - 450 - 1151- 41 x 12) / (3% x 255000 + 20% x 255000) = 3.3%
- Cash Flow = (1490 x 12 - 1033 x 12 - 1490 x 12 x 8% - 450 - 1511- 41 x 12) = 1,906/Yr. or $163/Mo.
As you can see, the high cost of insurance and property taxes in Austin had a huge impact on profitability. This is why including all major costs is important. If you do not, the numbers generated can be way off reality.
Invalid But Popular Return Calculations
Below are some popular methods found on various investment sites that produce invalid results and should not be used.
Rent/Price Ratio
Higher is better. As you can see, the result is invalid. The Austin property has a much lower rate of return and the Las Vegas property. The rent/price ration is simply wrong.
- Austin: 1700 12 / 252500 = 8.1%
- Las Vegas: 1490 x 12 / 255000 = 7.0%
Not Including Property Taxes and Insurance
Calculating returns without property taxes and insurance. Ignoring any major cost factor is guaranteed to create invalid results. As you can see, by not adding property taxes and insurance, the result was distorted and indicates the Austin property will have a higher rate of return. This approach is simply wrong.
- Austin: ROI = (1700 x 12 - 1024 x 12 - 1700 x 12 x 8% - 41 x 12) / (3% x 252500 + 20% x 252500) = 10.3%
- Las Vegas: ROI = (1490 x 12 - 1033 x 12 - 1490 x 12 x 8% - 41 x 12) / (3% x 255000 + 20% x 255000) = 6.1%
Using An Arbitrary Number For Maintenance and Vacancy
I frequently see real estate websites that add arbitrary amounts to approximate the cost of maintenance and vacancy. Just adding "numbers" to the calculations does not improve accuracy. Maintenance and vacancy are heavily influenced by property and tenant characteristics. If you would like to learn how to calculate a maintenance or vacancy provision, see the links below.
There are many other return metrics, but the above are the most common ones I see.
Summary
Return estimates are very effective for comparing properties. And, while the estimated return will not be your actual return, this is the best approximation available based on the limited data. Also, never rely only on return calculations. Always look at the market direction. If rents are not increasing above the rate of inflation, your return will decline overtime in inflation adjusted dollars.