Vacancy Provisioning

Photo by HausPhotoMedia on Unsplash
With some tenant pools, vacancy cost can be your second-highest cost after debt service. With other tenant pools, vacancy costs can be almost negligible. In this article, you will learn how to estimate a tenant-pool-specific vacancy cost, and I will show how I determined vacancy costs for the three major tenant pool segments in Las Vegas.
The Multiplier Method
On various real estate investment sites, vacancy cost is estimated by multiplying the rent by an arbitrary constant. To demonstrate why this does not work, I will use the two properties shown below. 
The property on the left:
- Rent averages $850/Mo.
- The average tenant stay is one year.
- Time to rent is 8 weeks
- Turn cost average is $1,500.
The on the right:
- Rent averages $1600/Mo.
- The average tenant stay is five years.
- Time to rent is 2 weeks
- Turn cost average is $500.
I will estimate the cost of vacancies by multiplying rent by 10%.
- Left Property: $850/Mo x 12Mo/Yr x 10% = $1,020/Yr
- Right Property: $1,600/Mo. x 12Mo/Yr x 10% = $1,920/Yr
The multiplier method predicts vacancy cost is higher for the newer property because the rent is higher, which is wrong. The newer property has a 5 year average tenant stay vs. a 1 year tenant stay for the older property. The multiplier method does not work because vacancy cost has no relationship to rent. Also, including a rent multiplier cost for vacancy distorts the estimated return.
Tenant Pool Segment Characteristics
There are no universal tenant pool characteristics; each location has different income ranges, employers, and property prices, etc. However, there is a source for all the local tenant pool segment information you need and that is local property managers. Property managers deal with tenants every day and are a wealth of knowledge.
When I first moved to Las Vegas, I developed a set of questions about tenant pool segment characteristics. I asked the same questions of multiple property managers. The questions were in the general form of, “If you were buying a rental property …?” I believe I had about ten such questions. Once I interviewed a few property managers, I started to understand the major tenant pools and their characteristics. Below is what I discovered.
The Critical Characteristic – Length of Tenant Stay
I determined the major cost difference between tenant pool segments is the length of tenant stay, which makes sense. Every time you have a tenant turn, you not only have a vacant property. The costs to get another paying tenant in the property include renovation, lease-up fees, carrying costs (debt service, utilities, taxes, insurance, etc.) and other costs. I tried several approaches to determine which tenant pool segment stayed the longest, which did not work. Finally, I tried correlating monthly rent and length of stay. Below is what I found.

Based on the median length of stay, I characterized the three major tenant pool segments as follows.
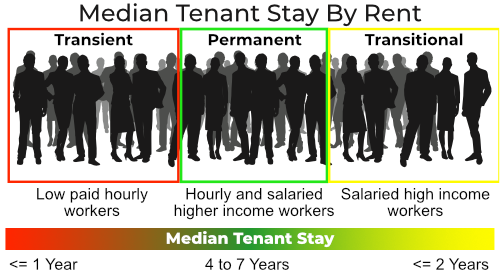
Comments on the three tenant pool segments
- Transient – This tenant pool is primarily low-skilled hourly workers making little more than minimum wage. The typical renovation cost per turn is $1,500. The average tenant stay is one year. The average rent is $850/Mo. The average time to rent is eight weeks.
- Permanent – This tenant pool could be hourly or salaried, but they earn well above minimum wage. The typical renovation cost per turn is $500. The average tenant stay is five years. Typical rent $1,600/Mo. Typical time to rent, two to four weeks.
- Transitional – This tenant pool has a high enough income that they are typically home buyers. They typically only rent if there is a major negative event in their lives. For example, a divorce, the death of a spouse, etc. Once they sort out the problem, they will buy a home. The typical tenant stay is two years. The typical renovation cost per turn is $2,000. Typical rent $2,500/Mo. The typical time to rent is eight weeks.
Once I understood the characteristics of the three major segments, I then determined the vacancy cost for each segment. Note that while segment generalizations may not apply to any specific individual, generalizations are useful when evaluating groups because the majority share common behaviors.
Estimating Vacancy Cost
The cost of a vacancy is the sum of renovation cost plus carrying costs, lease-up fees, etc. Carrying cost is dependent on financing, taxes, insurance, and other property-specific costs. Instead of evaluating vacancy cost based on specific property characteristics. To keep the following example reasonable, I will only consider lost income. The method I will use is to determine the total lost rent over a ten year period and then divide it by 10 (years) to get an annual cost factor. To keep things simple, I will ignore inflation, rent increases, and similar variables. Below are vacancy costs for each segment based on the above assumptions.
| Renovation Cost | Typical Rent | Time to Rent (Wks) | Vacancy Cost | Total Turn Cost | |
|---|---|---|---|---|---|
| Transient | 1500 | 850 | 8 | 1700 | 3200 |
| Permanent | 500 | 1600 | 2 | 800 | 1300 |
| Transitional | 2000 | 2500 | 8 | 5000 | 7000 |
If I multiply Total Turn Cost by the 10 year turn frequency, I get the following 10 year and annualized cost:
- Transient: 10 turns x 3,200 = 32,000 or $3,200/Yr
- Permanent: 2 turns x 2,000 = 4,000 or $400/Yr
- Transitional: 5 turns x 7000 = 35,000 or $3,500/Yr
The above demonstrates that to have the same net cash flow from the three different segments, you need much higher cash flow from properties that target Transitional and Transient tenant pools than the Permanent tenant pool.
Note: Note that every property targets a specific tenant pool segment. You may wish this was not the case, but that is the reality. Tenants select where they want to live; you do not get to choose which tenants are willing and able to rent your property.
Here is how you can incorporate the segment turn cost into your return estimate. Our standard cash flow comparison formula is below
Cash Flow = (Income – Debt Service – Management Fee – Insurance – RETax – Periodic Fees) x (1 – StateIncomeTax)
The same formula modified for each of the three tenant pool segments
- Cash FlowTransient = (Income – Debt Service – Management Fee – Insurance – RETax – Periodic Fees – $3,200) x (1 – StateIncomeTax)
- Cash FlowPermanent = (Income – Debt Service – Management Fee – Insurance – RETax – Periodic Fees – $400) x (1 – StateIncomeTax)
- Cash FlowTransitional = (Income – Debt Service – Management Fee – Insurance – RETax – Periodic Fees – $3,500) x (1 – StateIncomeTax)
The above formulas enable you to estimate the actual return based on the tenant pool segment the property targets.
In Conclusion
The popular method of estimating vacancy cost by a percentage of rent is invalid. Rent has no relationship with vacancy cost. Find out the tenant pool information you need from local property managers. Then, determine a vacancy cost for the major tenant pool segments so that you can incorporate it in your return estimate.