It goes without saying that the war against Iran has dominated the news since last weekend and is perhaps churning in the minds of many investors and money managers: how will the war affect our investments?
Let’s first look at the financial market’s responses so far, since the financial markets, especially the stock market, reflect and amplify sentiments.
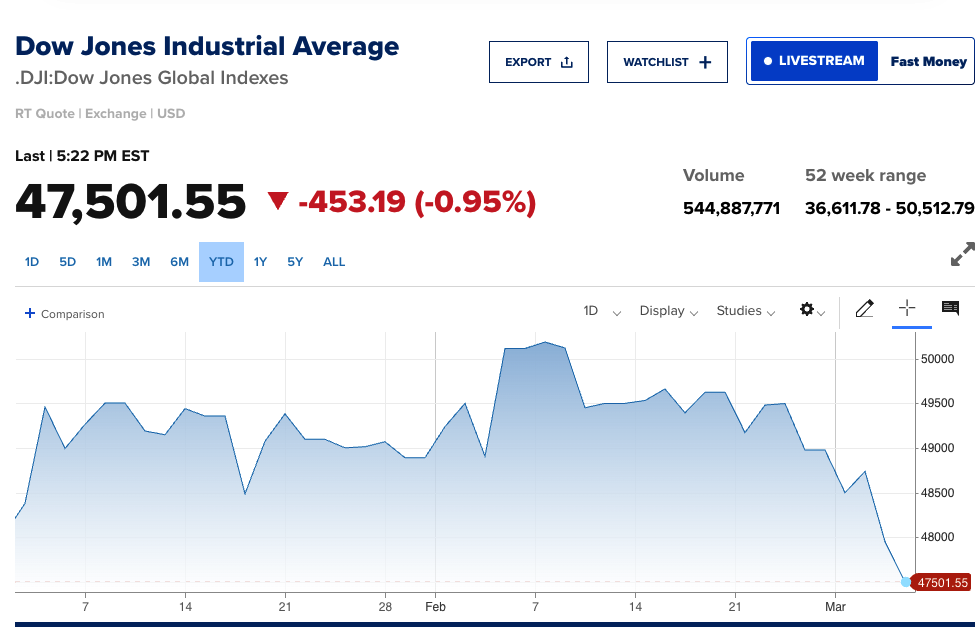
The Dow:
Before the war broke out: 48,978 (2/27)
Today (as of 03/06): 47,501 (down 3%)
Volatility has increased, but relatively calm (so far). And some other factors may be at play, such as the disappointing job report.
The 10-year Treasury Bond Yield:
The day before the war (2/27): 3.962%
Today (3/6): 4.138%
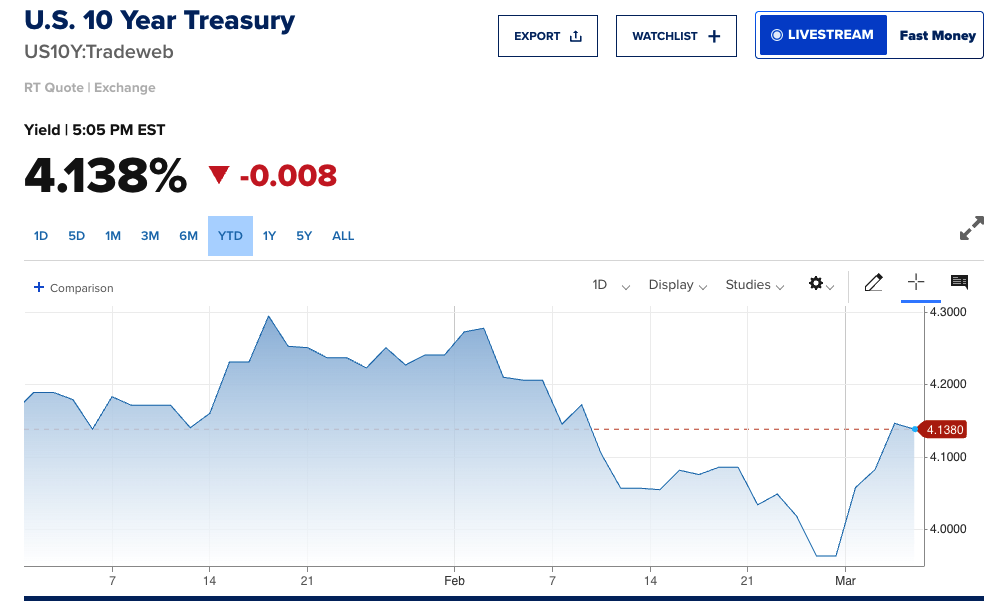
Usually, when there is heightened uncertainty and volatility, the 10-year Treasury yield tanks as people flee to safety and bid up the Treasury prices. However, it actually rose since the war started. This lack of flight to safety is even more telling than the relatively benign response in the stock market.
30-Year Fixed Mortgage Rate:
2/27: 5.99%
Today (3/6): 6.14%
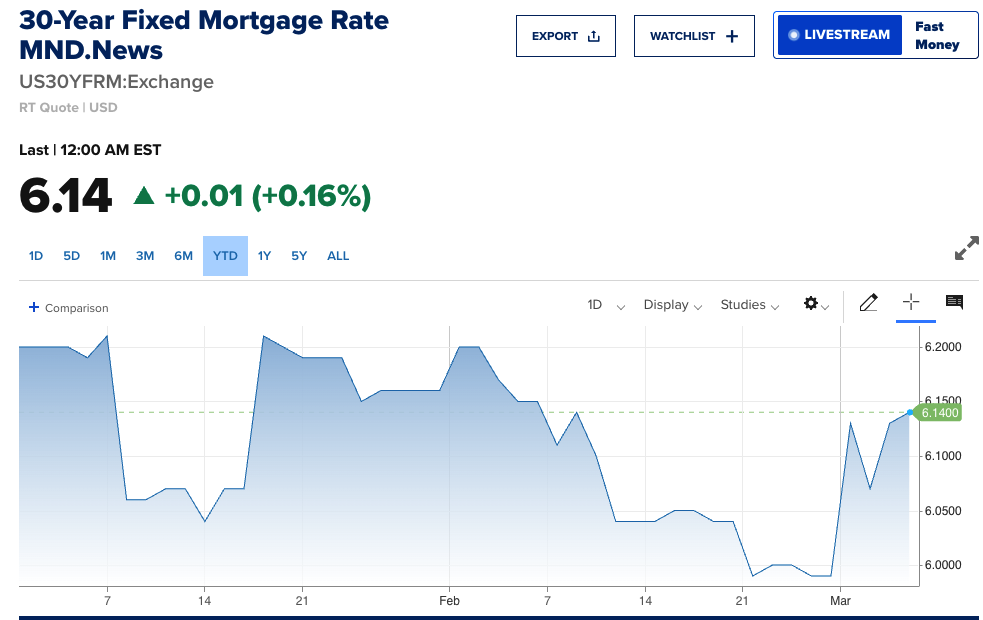
Again, no extraordinary reactions so far.
Based on the financial markets’ responses so far, it appears largely business as usual. The war does not seem to have had any significant impact (except for gasoline prices), yet. Of course, if the oil and gas traffic through the Straits of Hormuz is stopped for a prolonged period, the oil and gas prices will likely spike, and may trigger a spike in the inflation rate (even if that does happen, I’m not sure if the Fed will hike rates as the spike is not caused by an overheated economy).
However, as your Investment property advisor, our job is not to forecast any future events or predict any market reactions. Our job is to constantly evaluate the market fundamentals and our investment principles to best position our clients.
Turbulence? Opportunities?
Since I started our investor services business and chose Las Vegas as the investment city, we and the Las Vegas market have seen multiple major turbulences.
2008 Financial Crash
The Las Vegas housing market was the poster child of the 2008 crash. Home prices plummeted up to 60%, and massive numbers of properties lost tenants and went into foreclosure.
How did our clients who purchased properties before the 2008 financial crash fare? While property prices plunged, rental incomes remained relatively constant, unlike in most cities, where rents also plunged.
Needless to say, those who purchased properties after the crash, when fear was at its peak, and nobody wanted to buy, were rewarded with pretty spectacular appreciation and rent growth.
2020 COVID Shock
When the government mandated lockdowns, many people lost income. Then the government ordered an eviction moratorium. Droves of landlords lost months (if not years) of rental income while their mortgage payments and other expenses continued.
How did our clients fare?
Out of about 370 properties at that time, we were aware of 8 properties, or ~2% of the portfolio, where the tenants were unable to keep paying the rent. None that we were aware of was affected by the eviction moratorium. Those 8 tenants vacated the properties, and the properties were subsequently re-rented rapidly at a higher rate as the COVID housing frenzy kicked in. The rest of the tenants continued to pay their rent and fulfill their lease agreements.
Again, those who bought properties after the initial pandemic shock, when everyone else was afraid, enjoyed excellent appreciation and rent growth.
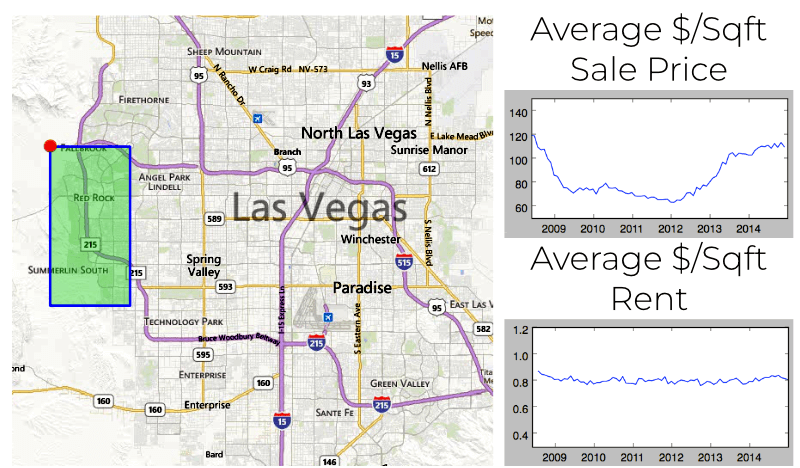
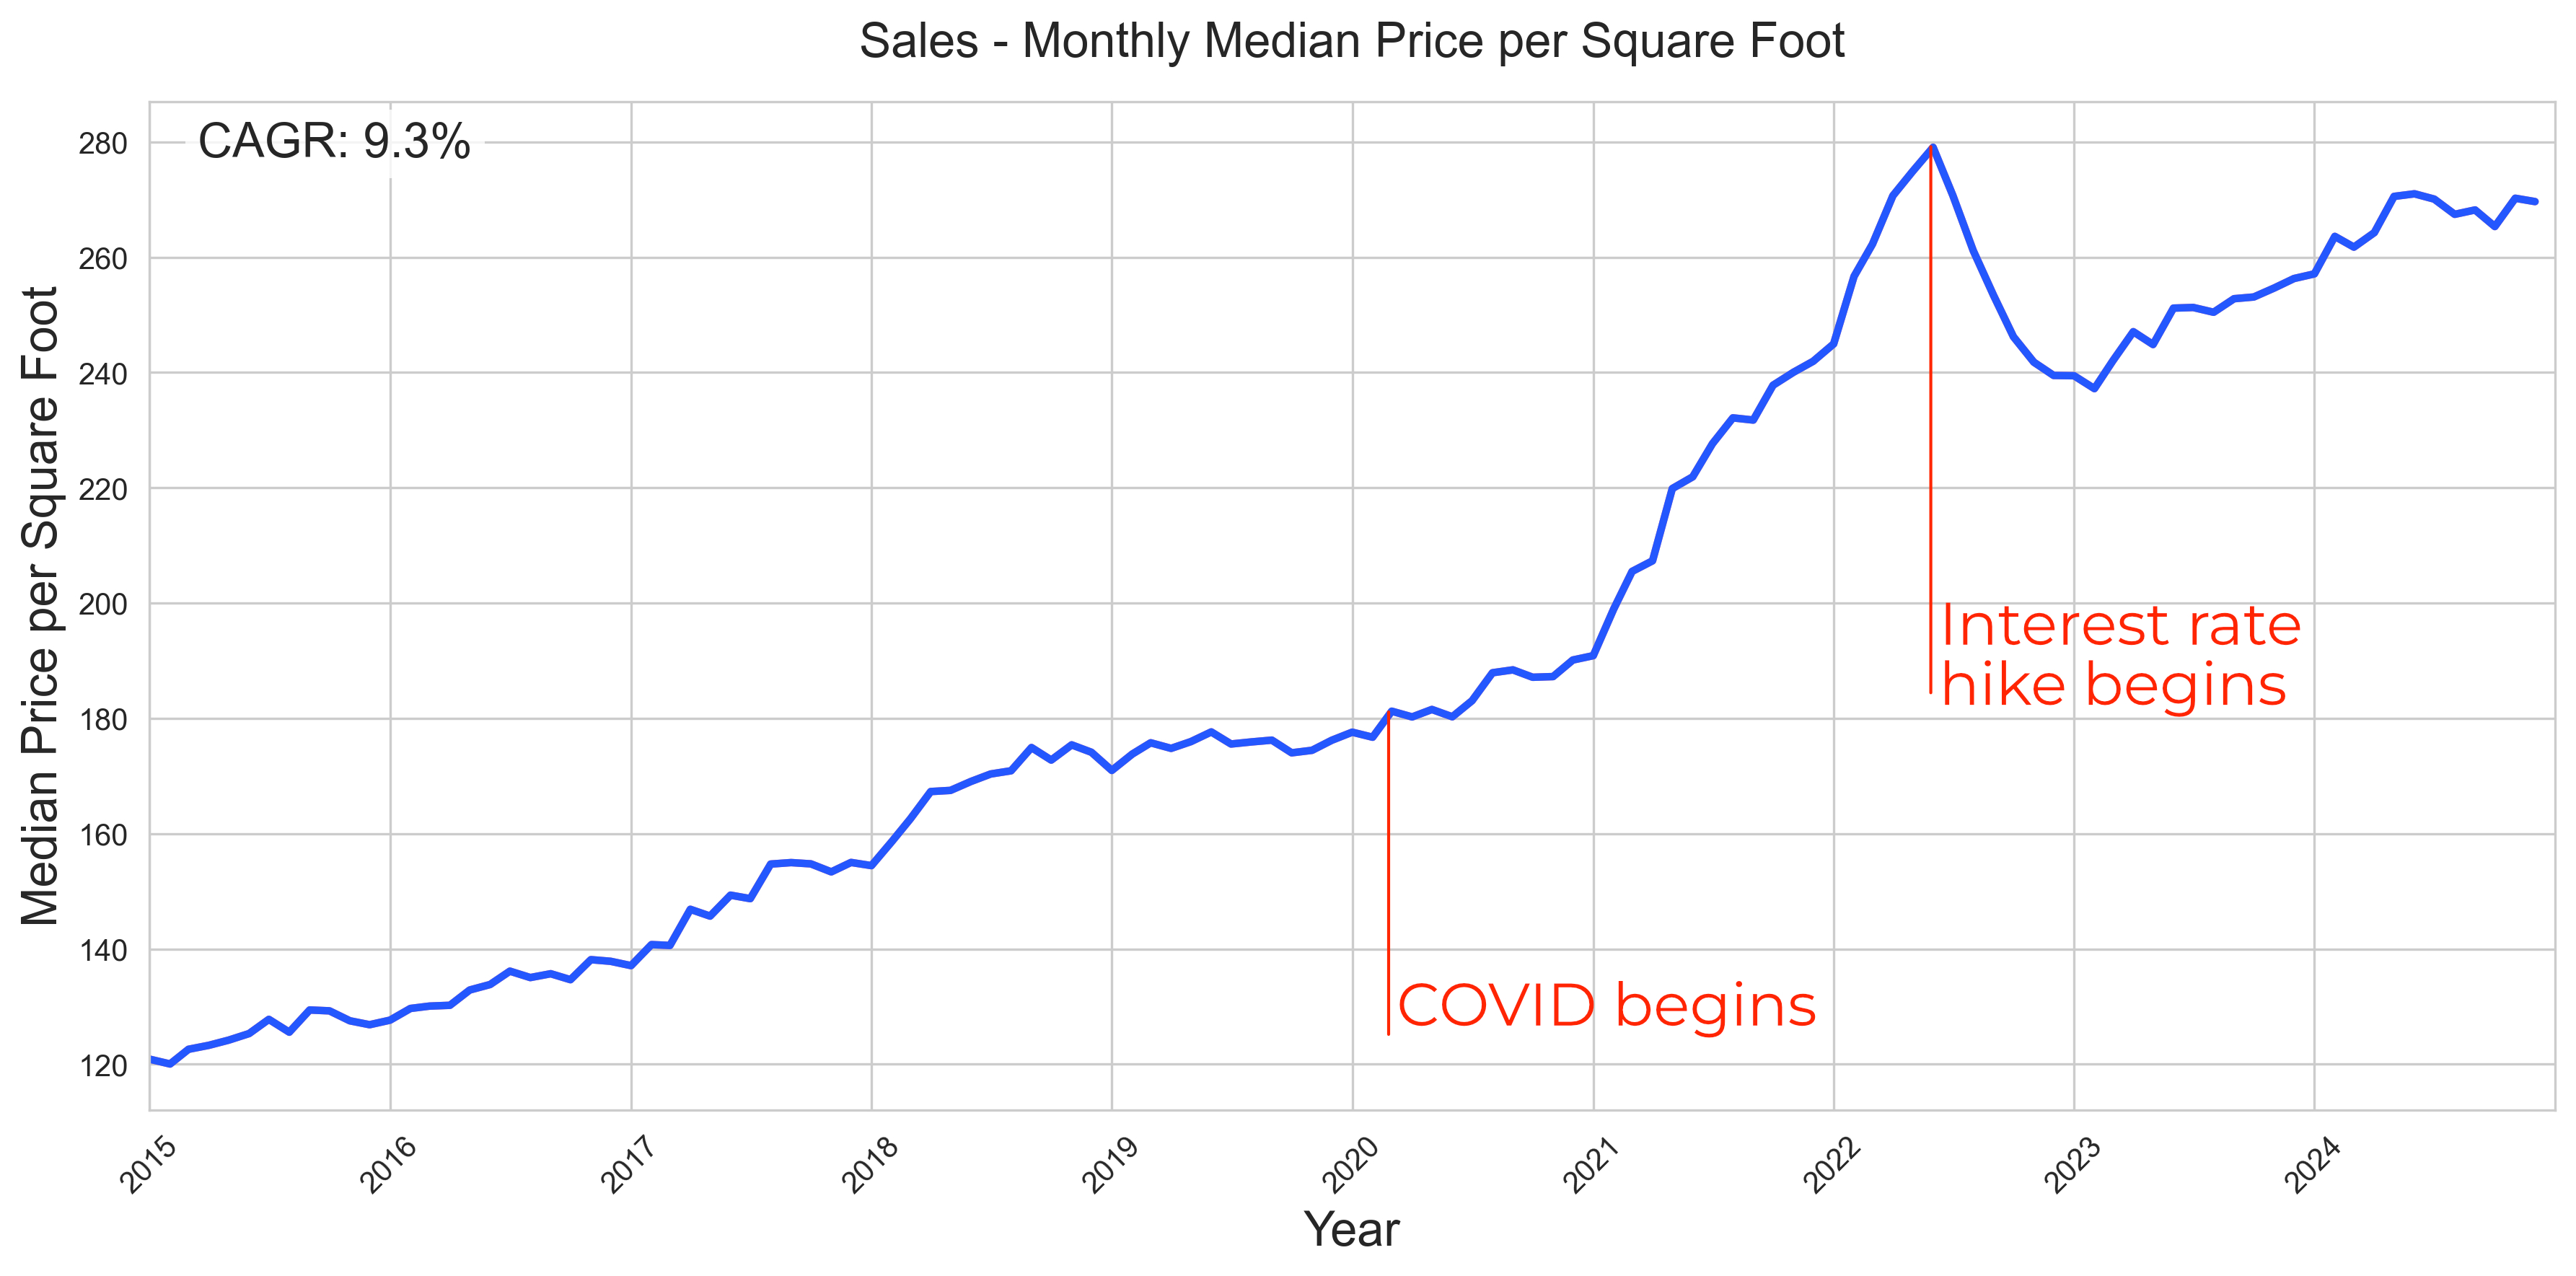
The following charts were from our 2025 Investor Outlook:
Appreciation:
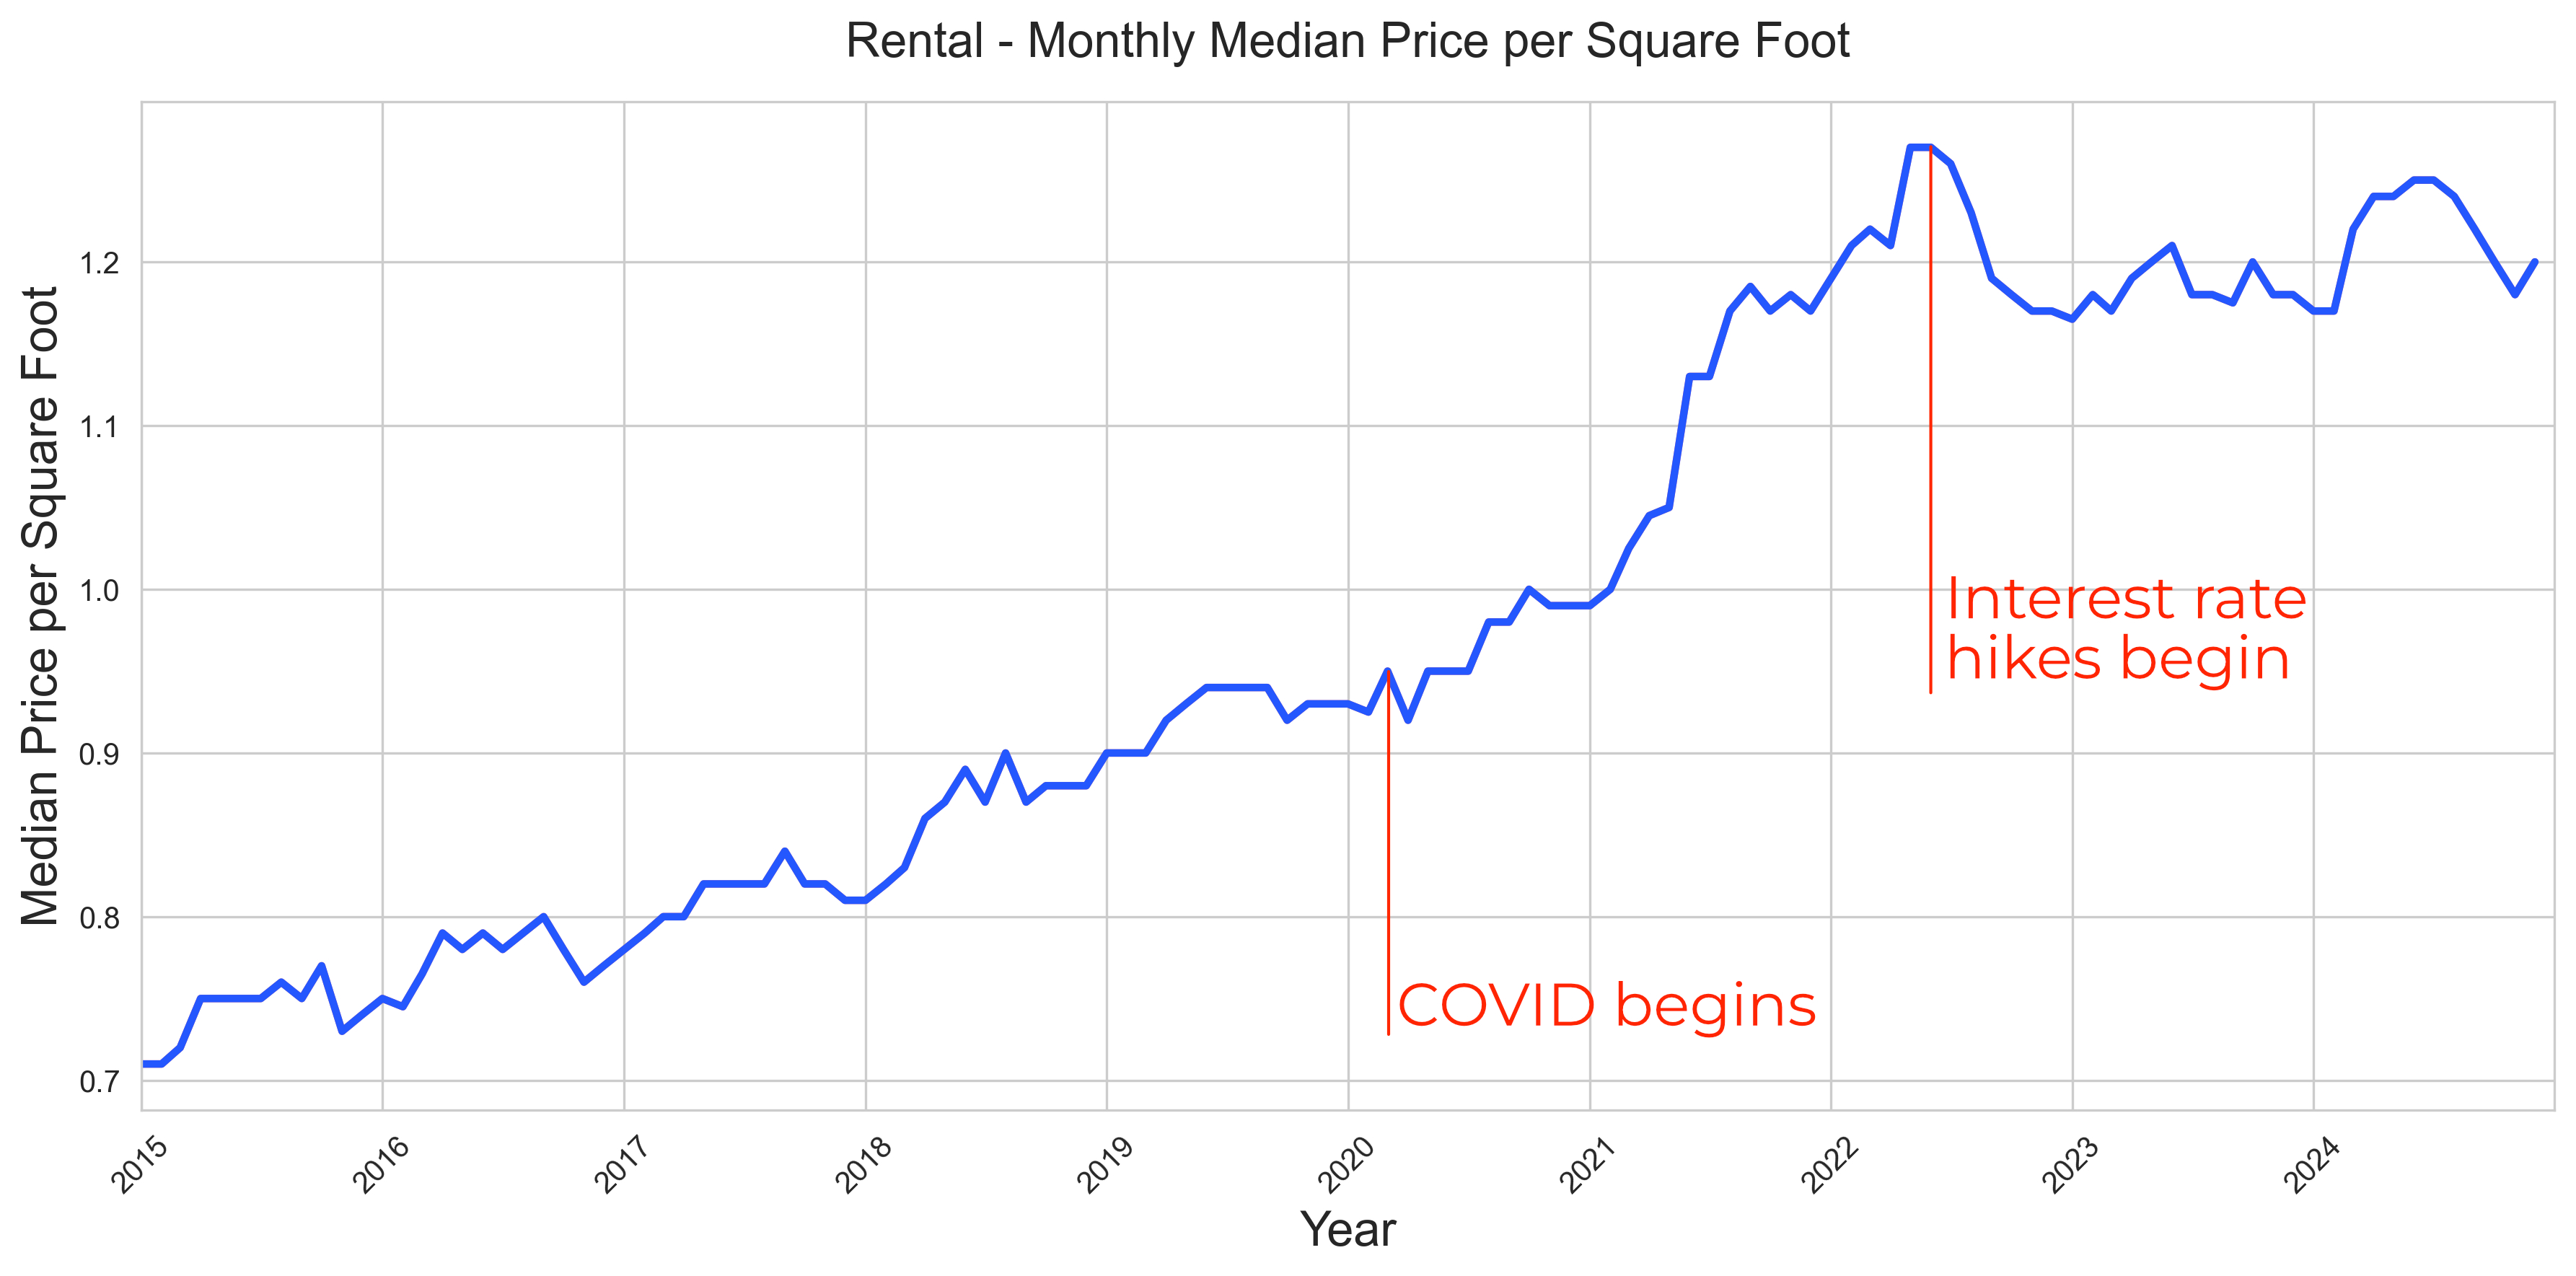
Rent growth:
But how can you build up confidence to buy during or after any major turbulence?
Evaluate the market fundamentals.
Market Fundamentals
Below are the Las Vegas market fundamentals that we monitor regularly:
Population growth
Population growth (or decline) drives housing demand. Despite global tension, the migration to Nevada remains relatively constant. [Source]
Land constraints
With the federal-controlled “ring” around the valley limiting expansion and $1M/acre land costs, builders cannot “build their way out” of the sub-$550k price point (thus increasing the supply of our target property profile).
Rent Reliability
The jobs of our target tenant demographic didn’t vanish during those shocks; their income continued uninterrupted, resulting in uninterrupted rental income.
Housing Inventory
Fortunately for housing market watchers, there is one reliable indicator of the near-term to mid-term market trend: housing inventory measured in months of supply, or how many months it would take for the current for-sale properties to sell out at the current absorption rate (purchases) if no more properties were to go on the market.
Before the 2008 crash and at the peak of the housing boom in 2006, the (12-month) cumulative inventory for all property types and price ranges in Las Vegas was 97 months! It was 8 months in the summer of 2011 when prices went down even further, and when the market bottomed out.
If we were ever to see an inventory level anywhere near 97 months again, it would be a screaming signal to “get out now!”
Not surprisingly, in March and April 2022, during the height of the COVID boom, the inventory was 1 month.
Today, overall inventory (all property types and all price ranges) is 5 months. But more importantly, we are not seeing any factors that would significantly increase supply (see our analysis in our 2026 Investor Outlook).
In summary, the Las Vegas market fundamentals are not changing.
Market Timing vs Opportunity
We are not trying to predict the exact peak or bottom. We are positioning our clients and ourselves to acquire reliable and durable income streams, especially when others hesitate. Turbulence feels uncomfortable. But when driven by emotion rather than permanent economic damage, it creates pricing inefficiencies. Smart investors who focus on long-term outcomes, not short-term headlines, are positioned to benefit.
Summary
The news is all about sensational headlines. But anchor your investment plans on market fundamentals. Opportunity rarely announces itself as opportunity. It usually arrives disguised as uncertainty.
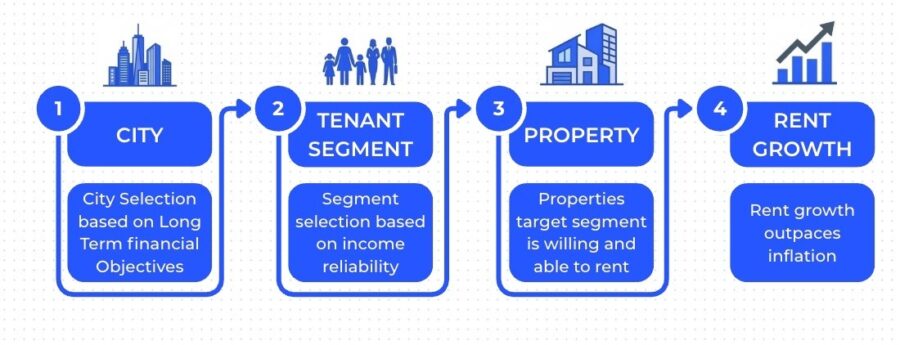
If you want to understand how we select properties designed to perform through cycles, start here → [The Engineer’s Guide to Safe Real Estate Investing]
Get weekly insights like this and learn how professionals build income safely.