Photo by Sharon McCutcheon on Unsplash
If you only consider the apparent (or paper) return, you may be making a serious mistake. Tenant pool segments have very different operating costs. You must consider the Probable Cost and not just the Apparent Cost of each tenant pool segment. Two of the major elements of Probable Cost are:
- Maintenance – This could be due to the age and condition of the property and or tenant damage.
- Turn cost – Every time a tenant moves out, you incur a significant income loss.
In this article, I will examine only the turn cost for three different tenant pool segments. The costs are based on our research and experience with three different tenant pool segments in Las Vegas.
Note: The assumptions I made in this article apply to Las Vegas but will be similar everywhere.
The Three Segments
While segment generalizations may not apply to any specific individual, generalizations are useful when evaluating groups because the majority share common behaviors. I will focus on the frequency of tenant turns by tenant pool segment.
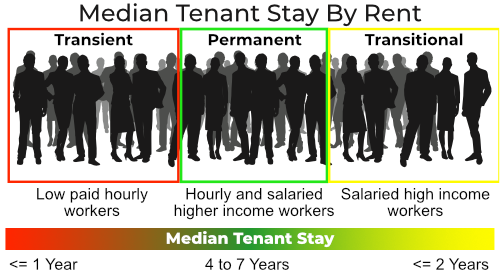
In my research, I’ve found that tenant stay has a strong correlation with income, as shown below.
Comments on the three tenant pool segments
- Transient – This tenant pool is primarily low-skilled hourly workers making little more than minimum wage. The typical renovation cost per turn is $1,500. The average tenant stay is one year. The average rent is $850/Mo. The average time to rent is eight weeks.
- Permanent – This tenant pool could be hourly or salaried, but they earn well above minimum wage. The typical renovation cost per turn is $500. The average tenant stay is five years. Typical rent $1,500/Mo. Typical time to rent, two to four weeks.
- Transitional – This tenant pool has a high enough income that they are typically home buyers. They typically only rent if there is a major negative event in their lives. For example, a divorce, the death of a spouse, etc. Once they sort out the problem, they will buy a home. The typical tenant stay is two years. The typical renovation cost per turn is $2,000. Typical rent $2,500/Mo. The typical time to rent is eight weeks.
Vacancy Cost
Vacancy cost is the sum of renovation cost plus carrying costs. Carrying cost is dependent on financing, taxes, insurance, and other property-specific costs. To keep things simple, I will base the following example only on lost income due to turn cost over ten years. Also, I will ignore inflation, probable rent increases, and similar variables. Below are the turn costs for each segment based on the above assumptions.
| Renovation Cost | Typical Rent | Time to Rent (Wks) | Vacancy Cost | Total Vacancy Cost | |
|---|---|---|---|---|---|
| Transient | 1500 | 850 | 8 | 1700 | 3200 |
| Permanent | 500 | 1500 | 4 | 1500 | 2000 |
| Transitional | 2000 | 2500 | 8 | 5000 | 7000 |
If I multiply Total Turn Cost by the 10 year turn frequency and divide by the frequency rate I get an annual vacancy cost:
- Transient: 10 turns x 3,200 = 32,000 or 3,200/Yr
- Permanent: 2 turns x 2,000 = 4,000 or 400/Yr
- Transitional: 5 turns x 7000 = 35,000 or 3,500/Yr
As you can see, to have the same net cash flow from the three different segments, you need to have a far greater return from properties that target Transitional and Transient tenant pools than the Permanent tenant pool.
If I were considering properties that target the three different tenant pools, I would use a modified return formula similar to the ones below. Note that you may have significant maintenance cost differences, which you would need to include. I did not include maintenance in the formula below since I am only considering the turn cost impact in this paper. The maintenance cost differences will be the subject of another article.
Our standard return comparison formula:
ROI = (Income – Debt Service – Management Fee – Insurance – RETax – Periodic Fees) x (1 – StateIncomeTax) / ( Down Payment + Closing Costs)
The same formula modified for each of the three tenant pool segments
- ROITransient = (Income – Debt Service – Management Fee – Insurance – RETax – Periodic Fees – $3,200) x (1 – StateIncomeTax) / ( Down Payment + Closing Costs)
- ROIPermanent = (Income – Debt Service – Management Fee – Insurance – RETax – Periodic Fees – $400) x (1 – StateIncomeTax) / ( Down Payment + Closing Costs)
- ROITransitional = (Income – Debt Service – Management Fee – Insurance – RETax – Periodic Fees – $3,500) x (1 – StateIncomeTax) / ( Down Payment + Closing Costs)
The above formulas provide a template for estimating returns for properties that target different tenant pools.
In Conclusion
If you only consider the apparent return and do not consider tenant pool segment cost, the property you believe to be a cash cow may actually be a money pit.