
Photo by Jilbert Ebrahimi on Unsplash
Las Vegas was one of the country’s hardest-hit metro areas during the 2008 real estate crash. In some areas, the vacancy rate in some tenant pool segments exceeded 50%. The only choice many investors had was short sale or foreclosure. However, our clients had no such problems because their income streams were unaffected. In this article, I will explain why our client’s properties continued to perform.
Conforming Property Performance
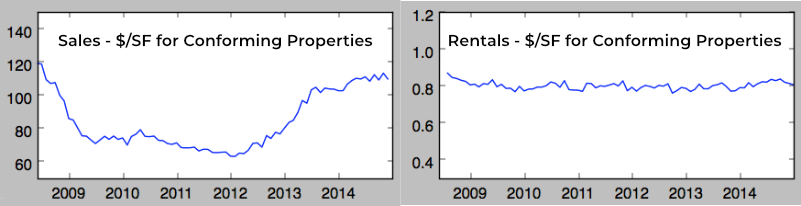
Below are two charts. On the left is market value, which plunged to about \$70/SF. On the right is rental income \$/SF for properties that conformed to our property profile. As you can see, the rental income was virtually unchanged. Why did our rental properties continue to perform when most others didn’t?
The Right Tenant Pool
When I first moved to Las Vegas to sell investment real estate, I spent a great deal of time studying tenant pools. I focused on (tenant) pool segment costs. I discovered that with some segments, you needed 2 or 3 times the cash flow to equal other segments. Based on my research, I developed a definition of a good tenant. I define a good tenant as someone who:
- Has stable employment in a market segment that is very likely to be stable or improve over time
- Has a credit history with which you can evaluate the likelihood that they will perform
- Pays all the rent on schedule
- Takes care of the property
- Does not cause problems with neighbors
- Does not engage in illegal activities while on the property
- Stays for many years
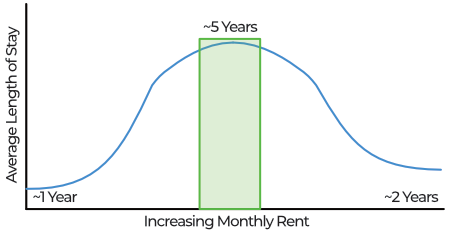
I decided that the most important factor was tenant stay. After a good bit of research, I discovered a strong correlation between the length of tenant stay and monthly rent, as shown in the diagram below. Once I had this information, I focused on the narrow tenant segment shaded in green.
One of my concerns was whether this tenant pool would perform long-term. Las Vegas, and every other city, have had downturns, and I needed a reliable income stream from their properties. After further research into the segment in green, I discovered a smaller segment that appears to have what I call mission-critical jobs. See the image below.
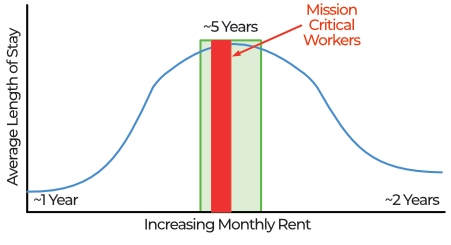
The majority of the tenant pool marked in red shared some common characteristics:
- This narrow segment can be hourly or salaried but earn well above minimum wage.
- They are their employer’s direct income producers.
- They make their employers a lot of money compared to the pay they receive.
Based on the above and other considerations, I decided that this was the tenant pool that I would target. I then built a property profile that this narrow segment would be willing and able to rent. I was confident that I made the right decision on the tenant pool segment. However, you never know if you made the right decision until your concept is stress tested. As shown in the two graphs earlier in this article, the 2008 (and COVID) results speak for themselves.
In Conclusion
The 2008 crash was devastating in Las Vegas. Short sale or foreclosure was the only option for most investors. However, our clients had zero decrease in rent and no vacancies due to our target tenant pool.